
The answer in three accounting steps
For the PNLD EJA 2026–2029 portfolio identified by FNDE as acquired in 2025 for school use in 2026, the published student-print acquisition value averages R$11.31 per student printed copy. Teacher-manual mix adds approximately R$1.02 per printed copy to the overall print average. Allocating the separately reported HTML acquisition value across all printed copies adds approximately R$0.79. The resulting all-in allocation is R$13.13 per printed copy. Each number answers a different question, even though all originate in the same acquisition workbook.
The three steps form an exact identity before display rounding. They do not estimate what a particular book should cost or what the government could save. The final ratio combines student and teacher materials with a digital allocation; it is not a price quoted for an identical student book. Reporting only the final number conceals the composition of the purchase. Reporting the student number as the whole programme’s cost would omit other acquired outputs. A useful account preserves both the narrower average and the bridge to the broader total.
An actual acquisition portfolio, with a precise boundary
This analysis concerns public acquisitions for young people and adults completing the initial and final segments of Brazil’s fundamental education (ensino fundamental) through EJA, corresponding here to stages 1–4 and 5–8. Upper-secondary education is outside this portfolio. It is not an estimate of Brazil’s entire publishing market, commercial ebook demand or household book spending. The selected source covers ten corporate publisher labels and two educational segments. Its nested table distinguishes student books from teacher manuals and printed material from material reported under HTML. That combination permits a more informative calculation than a list of approved collection codes or a single national acquisition total.
Three dates must remain visible. The programme cycle is 2026–2029. FNDE places the selected workbook under acquisitions made in 2025 for school use in 2026. The statistics page was last modified on 9 July 2026 when inspected for this study. None of those labels establishes a cash payment date. We call the monetary fields published acquisition values throughout. The workbook does not supply invoice settlement dates, publishers' accounting recognition, manufacturing expenditure or profit. Treating those concepts as interchangeable would extend the data beyond its documented financial stage.
Why a printed copy and an HTML quantity are different units
The workbook reports 11,434,085 printed copies and a separate HTML quantity of 124. Those figures belong in different unit columns. The printed total combines student copies and manuals. The HTML total is retained with its literal source meaning: reported HTML quantity. The available tabulation does not establish that this number counts people, download sessions, paid user licences or unique creative titles. We therefore do not add it to physical copies to manufacture a common book denominator, even though the source also provides a combined arithmetic total.
The monetary columns can be added because they are denominated in the same nominal Brazilian reais. Quantities require more care. A digital work can support a distribution process whose scale is unrelated to the count shown beside its acquisition value. The programme’s specification describes student and teacher versions in print and digital-interactive forms, but it does not make one reported HTML quantity equivalent to one physical copy. A chart that added the two quantity columns would imply a comparability that the source does not provide. Our tables keep those units separate and use physical printed copies only for the stated allocation ratios.
Begin with the student-print average
The student-print subtotal is R$124,174,567.84 for 10,976,682 printed copies. Dividing this acquisition value by these copies produces the R$11.31 student-print average. This is a quantity-weighted portfolio ratio: large-volume purchases contribute more than small-volume purchases. It is not the arithmetic mean of publishers' quoted prices, the price of the median title or a retail price. The source does not identify a common specification across every copy, so the average should travel with its portfolio and role label.
This narrower measure is useful when a reader wants to distinguish material intended for students from the supporting teacher and digital outputs. It becomes misleading when used to describe the full bundle. Nor does it mean that a school could purchase every chosen student book at exactly that amount. Different subjects, segments, editions and print runs remain inside the subtotal. The calculation clarifies an accounting boundary; it does not remove product differences. An editor can safely describe it as published student-print acquisition value per student printed copy, with the year and programme scope attached.
Teacher manuals change the print portfolio average
Teacher manuals account for 457,403 printed copies and R$16,890,995.07 of printed acquisition value. Their own average is R$36.93 per manual printed copy. Manuals represent approximately 4.00% of physical printed quantities and 11.97% of printed acquisition value. These shares are both based on printed material alone. Their difference shows why a small quantity component can matter to an average measured in reais. It does not measure how many teachers received a manual or whether any manual reached a classroom.
The source specification treats a teacher manual as a distinct output, with teacher-facing content and requirements. That distinction is sufficient reason to avoid comparing its average as if it were the same item as a student’s copy. It is not evidence that the higher observed average was caused by one production feature. The workbook contains no experiment, common-item price comparison or publisher cost ledger. We can describe what the portfolio contains and how the components enter the calculation. We cannot identify the separate effects of page count, print-run size, subject coverage or contractual terms from these aggregated observations.
The manual-mix bridge is an identity, not a savings scenario
The overall printed average equals the student-print average plus the manual quantity share multiplied by the difference between the manual and student averages. Using the full precision of the underlying amounts, that manual-mix term is R$1.024707 per printed copy. Adding it to the student average produces an overall print allocation of R$12.337285, displayed as R$12.34. This expression simply rewrites the same combined printed acquisition value over the same physical printed quantity. No hypothetical purchase is required to make the identity hold.
It would be wrong to describe the R$1.02 term as waste, avoidable spending or the amount saved by eliminating manuals. Removing an output changes what the programme purchases. The same warning applies to claims that student books became more expensive by that amount. There is no earlier time point in this comparison: the calculation moves between roles within one acquisition snapshot. Calling the term a mix bridge keeps the interpretation honest. It tells readers how an all-print portfolio average differs from its student-print reference, while leaving the educational value and necessity of the outputs unjudged.
Add the HTML value without inventing a digital unit price
The workbook reports R$9,045,291.30 under HTML acquisition value. Dividing that amount by the 11,434,085 printed copies produces an allocation of R$0.791081 per printed copy. This step lets a reader reconcile total acquisition value with the physical scale of the print portfolio. It does not divide by the reported HTML quantity and does not estimate the price paid for each digital user. The ratio’s label matters: HTML acquisition value allocated per printed copy is an accounting measure, not a digital consumption or licence measure.
We also avoid calling the HTML value a fixed development cost. The specification and totals do not establish that every real in that field paid for initial creation, rather than another component of acquisition. The allocation does not reveal marginal digital production costs or a commercially available ebook subscription price. It is useful precisely because its purpose is limited. A newsroom can use it to explain why a total acquisition-value headline exceeds the printed-only subtotal, without pretending that the difference represents more physical books, a payment premium for each learner or the cost of an additional download.
Reconcile the entire purchase without rounding away the meaning
The printed student and manual values sum to R$141,065,562.91. Adding the HTML value produces R$150,110,854.21 of total published acquisition value in the selected EJA workbook. Dividing that total by physical printed copies gives R$13.128366 per printed copy. Our calculation retains exact integer quantities and currency rounded to the reported cent for arithmetic. Displayed averages use two decimal places, while the downloadable numerical results retain additional calculation digits so that readers can reproduce the bridge without treating display rounding as an unexplained residual.
The distinction is practical. Adding the displayed components R$11.31, R$1.02 and R$0.79 gives R$13.12, while rounding their full-precision sum gives R$13.13. Neither difference is a missing expenditure. The chart identifies rounding and the data table supplies the underlying values. The same principle applies to percentages: a quantity share and a value share should be calculated from their own exact denominators before rounding. More digits in a computation do not mean that the source measures every commercial feature of the purchase with the same precision.
Why the two educational segments remain visible
The public tables also show the initial and final EJA segments separately. Within each segment, student and manual printed quantities and values are aggregated before the same bridge is calculated. This preserves a meaningful purchasing distinction and lets a reader see whether the national result hides a different balance of student copies, manuals and HTML allocation. Segment totals are parts of the same portfolio, not new studies or independent samples. Their acquisition values should be added through their underlying amounts and quantities, not by averaging the two displayed unit allocations.
Different segment ratios are not a ranking of efficiency. The materials have different educational coverage, and the published aggregates do not supply a common quality-adjusted output. One publisher’s participation in both segments does not make the underlying titles identical. We deliberately omit publisher league tables from the public analysis: the question is how to interpret the portfolio, not which named supplier looks cheapest after its mix is ignored. This also avoids inventing conglomerate identities from corporate labels. Procurement value, brand ownership and publisher revenue are related market topics, but they require evidence beyond the selected table.
A more useful reporting question for the editorial market
For publishers, the purchase illustrates why physical volume alone does not describe the composition of a public book contract. A portfolio may contain teaching materials and digital-interactive outputs alongside the student copies that dominate the count. For editors and market researchers, that is a concrete reason to request a role and format breakdown before comparing average acquisition figures. The bridge supplies a reusable question: which outputs are inside the numerator, which physical quantity is in the denominator, and does the proposed headline describe both accurately?
A clear report might say that the EJA portfolio’s student-print average was R$11.31 and that manual mix and a separate HTML allocation reconcile it to R$13.13 of total acquisition value per printed copy. An unclear report might say every student book cost R$13.13, or that digital books added 124 readers. The first example preserves the measured units; the second introduces unsupported meanings. Neither the bridge nor the source establishes author earnings, royalties, profit margins, the size of the consumer ebook market or books actually read. Those claims should remain outside a story built from this evidence.
How the public reproduction works
The downloadable recipe runs offline using Python’s standard library and an original workbook supplied by the reader. It checks the exact file length and fingerprint before reading the numerical cells. A different workbook version stops the calculation rather than silently replacing the evidence. The recipe reads only the selected acquisition file, keeps source-empty cells flagged internally and verifies nested arithmetic. It aggregates the leaf observations into the four segment-by-role groups used in the public input table. It does not output publisher names, source rows, personal identifiers or the original workbook layout.
The independent verification checked 384 numerical positions directly in the workbook’s underlying XML, including two source-empty positions, and reconciled the hierarchy through category, publisher and repeated grand totals. One manual row has blank printed quantity and value alongside a positive HTML value. Its contribution of zero to the printed aggregate is constrained by the table’s arithmetic, rather than presented as an observation that no manuals were delivered. The public reproduction preserves that distinction in its methods. Matching an administrative table exactly demonstrates internal consistency, not external verification that every contracted item was delivered, paid for or used.
Scope, reuse and the comparisons this study does not make
The analysis uses one acquisition snapshot. It does not estimate inflation, a price trend or a causal change in purchasing policy. Other linked PNLD tables contain scope and total differences that have not been reconciled here, so they are not merged to create an apparently comparable series. Prices are not adjusted for pages, subjects, contract characteristics or quality. There is no sampling confidence interval because these are published administrative acquisition aggregates, not a newly collected probability survey. Source revisions remain possible; the frozen fingerprint identifies the exact version used.
FNDE retains its stated licence for its source material. This publication offers independently expressed numerical analysis, aggregate factual results, original graphics and reproduction code. It does not redistribute an adapted FNDE workbook, educational text, source layout, logos or a full source-cell audit, and it does not claim permission to relicense protected source content. Please credit FNDE for the original acquisition facts and Alisson Bento for this analysis and figures. When sharing a chart or statistic, retain the acquisition year, school-use year, EJA scope and physical-copy denominator. Those short labels keep a useful explanation from becoming a misleading universal book price.
From student-print average to the full acquisition allocation
Three accounting steps connect the student-print average to all-in acquisition value per physical printed copy.
Full chart and source
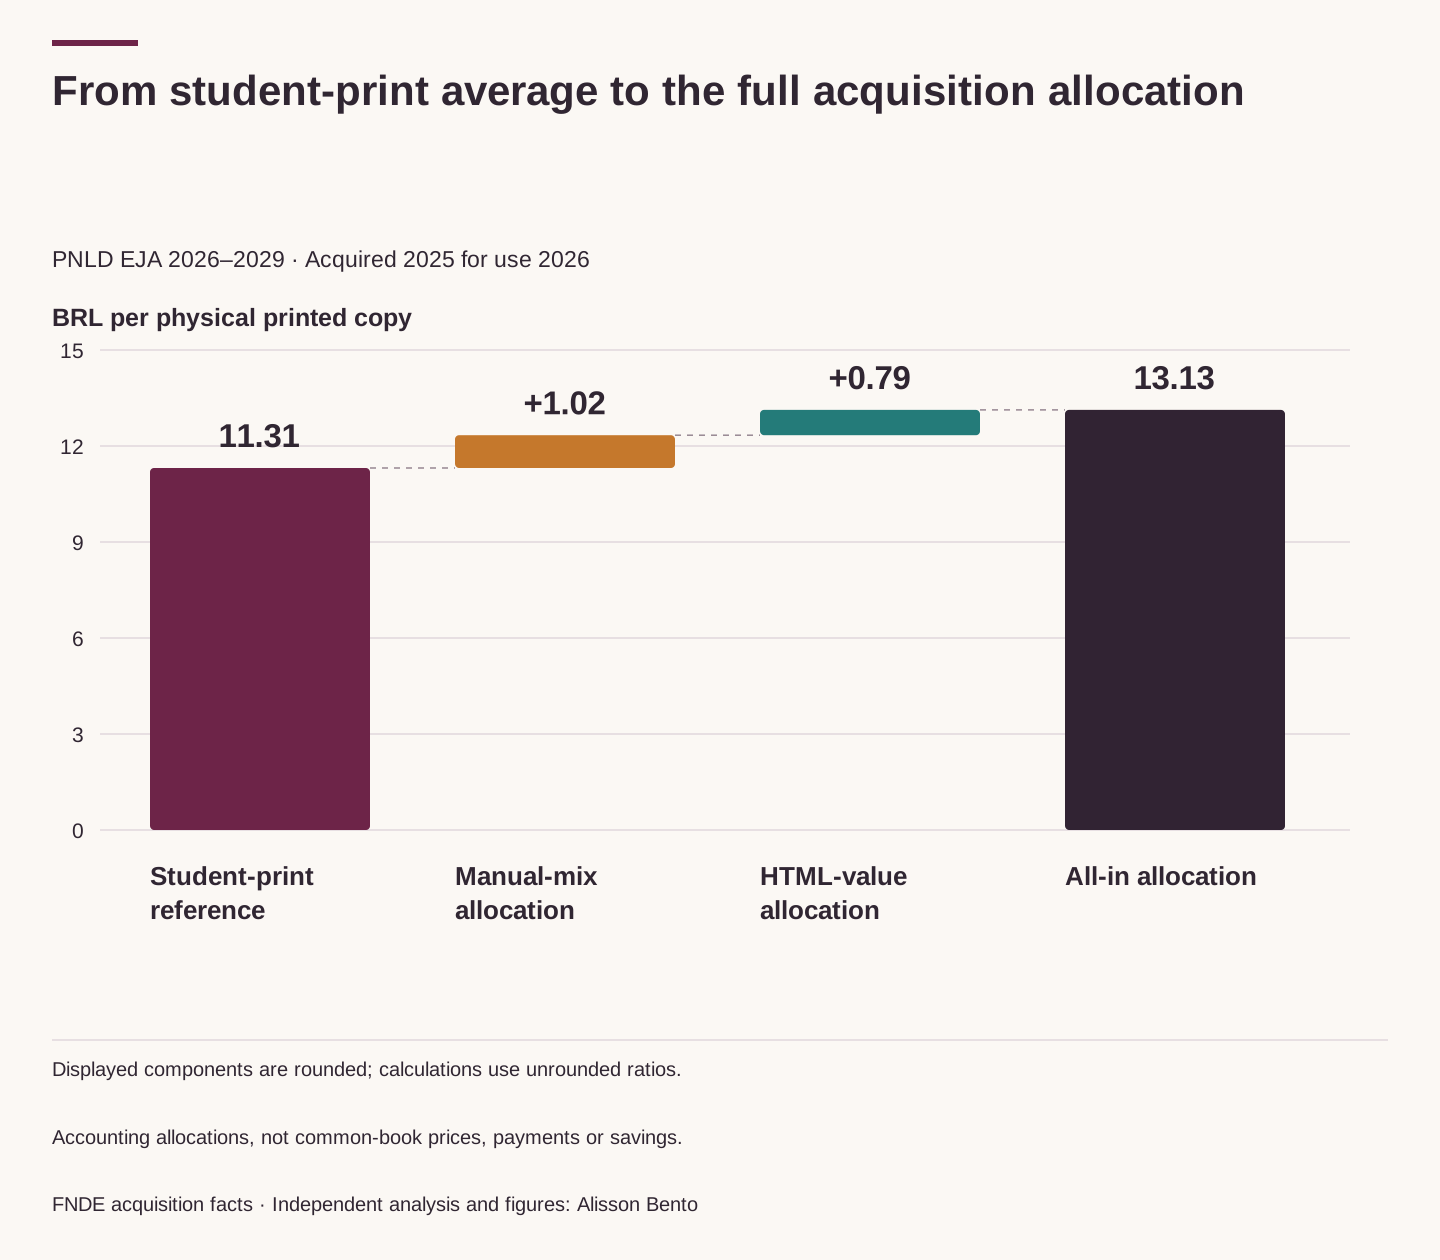
Scroll horizontally to inspect the chart. ↔
Chart and values
Scroll horizontally to see all columns.
| Portfolio scope | Student-print reference | Manual-mix allocation | All-print average | HTML allocation | All-in acquisition allocation |
|---|---|---|---|---|---|
| Whole EJA portfolio | 11.31 | 1.02 | 12.34 | 0.79 | 13.13 |
| Initial EJA segment | 11.51 | 0.52 | 12.03 | 0.75 | 12.78 |
| Final EJA segment | 11.18 | 1.35 | 12.53 | 0.82 | 13.35 |
BRL per physical printed copy, except the first column. The manual term is a mix allocation and HTML term is a value allocation, not their own unit prices. Display rounding can make component sums differ by one cent from the rounded total.

Manuals have different shares of printed copies and printed value
Teacher manuals are 4.00% of printed quantities and 11.97% of printed acquisition value. Both shares exclude HTML quantities and values.
Full chart and source

Scroll horizontally to inspect the chart. ↔
Chart and values
Scroll horizontally to see all columns.
| Portfolio scope | Student printed copies | Manual printed copies | All printed copies | Student print value (BRL) | Manual print value (BRL) | HTML value (BRL) | Total acquisition value (BRL) |
|---|---|---|---|---|---|---|---|
| Whole EJA portfolio | 10,976,682 | 457,403 | 11,434,085 | 124,174,567.84 | 16,890,995.07 | 9,045,291.30 | 150,110,854.21 |
| Initial EJA segment | 4,352,352 | 65,393 | 4,417,745 | 50,108,669.14 | 3,039,516.92 | 3,325,342.06 | 56,473,528.12 |
| Final EJA segment | 6,624,330 | 392,010 | 7,016,340 | 74,065,898.70 | 13,851,478.15 | 5,719,949.24 | 93,637,326.09 |
No mixed print-plus-HTML quantity denominator. Source-empty fields are handled only through the documented table-constrained zero contribution, not a general missing-value rule.

The same accounting bridge within two EJA segments
Initial and final EJA segments each retain their own student-print reference, teacher-manual mix allocation and separate HTML value allocation.
Full chart and source

Scroll horizontally to inspect the chart. ↔
Chart and values
Scroll horizontally to see all columns.
| Portfolio scope | Student-print reference | Manual-mix allocation | All-print average | HTML allocation | All-in acquisition allocation |
|---|---|---|---|---|---|
| Whole EJA portfolio | 11.31 | 1.02 | 12.34 | 0.79 | 13.13 |
| Initial EJA segment | 11.51 | 0.52 | 12.03 | 0.75 | 12.78 |
| Final EJA segment | 11.18 | 1.35 | 12.53 | 0.82 | 13.35 |
BRL per physical printed copy, except the first column. The manual term is a mix allocation and HTML term is a value allocation, not their own unit prices. Display rounding can make component sums differ by one cent from the rounded total.

Data & downloads
Scroll horizontally to see all columns.
| EJA segment | Role | Printed copies | Printed acquisition value (BRL) | Reported HTML quantity | HTML acquisition value (BRL) |
|---|---|---|---|---|---|
| Initial EJA segment | Student books | 4,352,352 | 50,108,669.14 | 30 | 1,752,692.50 |
| Initial EJA segment | Teacher manuals | 65,393 | 3,039,516.92 | 18 | 1,572,649.56 |
| Final EJA segment | Student books | 6,624,330 | 74,065,898.70 | 32 | 1,865,424.02 |
| Final EJA segment | Teacher manuals | 392,010 | 13,851,478.15 | 44 | 3,854,525.22 |
Nominal BRL acquisition values. Printed copies and reported HTML quantities are separate units; never add them for a physical-copy ratio.
Scroll horizontally to see all columns.
| Portfolio scope | Student-print reference | Manual-mix allocation | All-print average | HTML allocation | All-in acquisition allocation |
|---|---|---|---|---|---|
| Whole EJA portfolio | 11.31 | 1.02 | 12.34 | 0.79 | 13.13 |
| Initial EJA segment | 11.51 | 0.52 | 12.03 | 0.75 | 12.78 |
| Final EJA segment | 11.18 | 1.35 | 12.53 | 0.82 | 13.35 |
BRL per physical printed copy, except the first column. The manual term is a mix allocation and HTML term is a value allocation, not their own unit prices. Display rounding can make component sums differ by one cent from the rounded total.
Scroll horizontally to see all columns.
| Portfolio scope | Student printed copies | Manual printed copies | All printed copies | Student print value (BRL) | Manual print value (BRL) | HTML value (BRL) | Total acquisition value (BRL) |
|---|---|---|---|---|---|---|---|
| Whole EJA portfolio | 10,976,682 | 457,403 | 11,434,085 | 124,174,567.84 | 16,890,995.07 | 9,045,291.30 | 150,110,854.21 |
| Initial EJA segment | 4,352,352 | 65,393 | 4,417,745 | 50,108,669.14 | 3,039,516.92 | 3,325,342.06 | 56,473,528.12 |
| Final EJA segment | 6,624,330 | 392,010 | 7,016,340 | 74,065,898.70 | 13,851,478.15 | 5,719,949.24 | 93,637,326.09 |
No mixed print-plus-HTML quantity denominator. Source-empty fields are handled only through the documented table-constrained zero contribution, not a general missing-value rule.
Evidence & method
How we calculated it
- Freeze the exact original FNDE EJA workbook and distinguish acquisition year 2025, school-use year 2026 and programme cycle 2026–2029. Read numerical source cells offline; no original workbook is redistributed.
- Aggregate twenty-eight leaf observations into four segment-by-role groups; reconcile categories, publishers and repeated grand totals. Two source-empty printed fields contribute zero as constrained by table arithmetic, not observed no-delivery.
- Calculate the student-print reference, manual quantity-share mix bridge and separate HTML acquisition-value allocation per printed copy. Reproduce national and segment identities from integer quantities and reported currency cents.
What the data cannot tell us
- Published nominal acquisition value is not verified cash payment, publisher recognized revenue, production cost, author royalties or profit.
- Physical printed copies are not people, deliveries or books read. The reported HTML quantity is not interpreted as users, licences, downloads or unique titles and is never added to physical copies for an analytical ratio.
- Different student/manual materials and segment portfolios do not establish a common-item price, supplier-efficiency ranking, quality adjustment, price trend, causal effect or savings scenario.
- One administrative acquisition snapshot, not a newly sampled survey or the whole Brazilian book market. Source revisions, product differences and contract details remain outside this analysis. Display rounding can create a one-cent component discrepancy.
Original sources
- FNDE PNLD statistics page
Selected EJA portfolio explicitly acquired in 2025 for school use in 2026; programme cycle 2026–2029. Page updated 9 July 2026.
Accessed October 31, 2026
- PNLD EJA 2026–2029 acquisition workbook
Reader supplies unchanged original for offline reproduction. The original workbook is not redistributed.
Accessed October 31, 2026
- Official EJA third-rectification attachment
Student/manual and print/digital-interactive specifications; acquisition negotiation and subsequent contract stage distinguished.
Accessed October 31, 2026
- Underlying source licence
No claim that the ND licence permits distributing adapted protected source material.
Accessed October 31, 2026
- Creative Commons factual-data guidance
Purely factual data distinguished from creative database structure and protected content. Public outputs are independently expressed aggregate analysis.
Accessed October 31, 2026
Cite & reuse this study
Alisson Bento. 2026. What a public book acquisition average includes: student books, teacher manuals and digital material. Independent aggregate analysis of FNDE PNLD EJA 2026–2029, acquired 2025 for school use in 2026. https://alissonbento.com/research/brazil-eja-book-acquisition-accounting-2025/
Credit FNDE for original acquisition facts and Alisson Bento for independent analysis and original figures. Preserve scope, acquisition/use years, units and accounting limits. FNDE source pages display CC BY-ND 3.0; protected source workbooks, prose/layout and educational content are not adapted, redistributed or relicensed here. No official endorsement implied.
Corrections or editorial questions