
The historical result
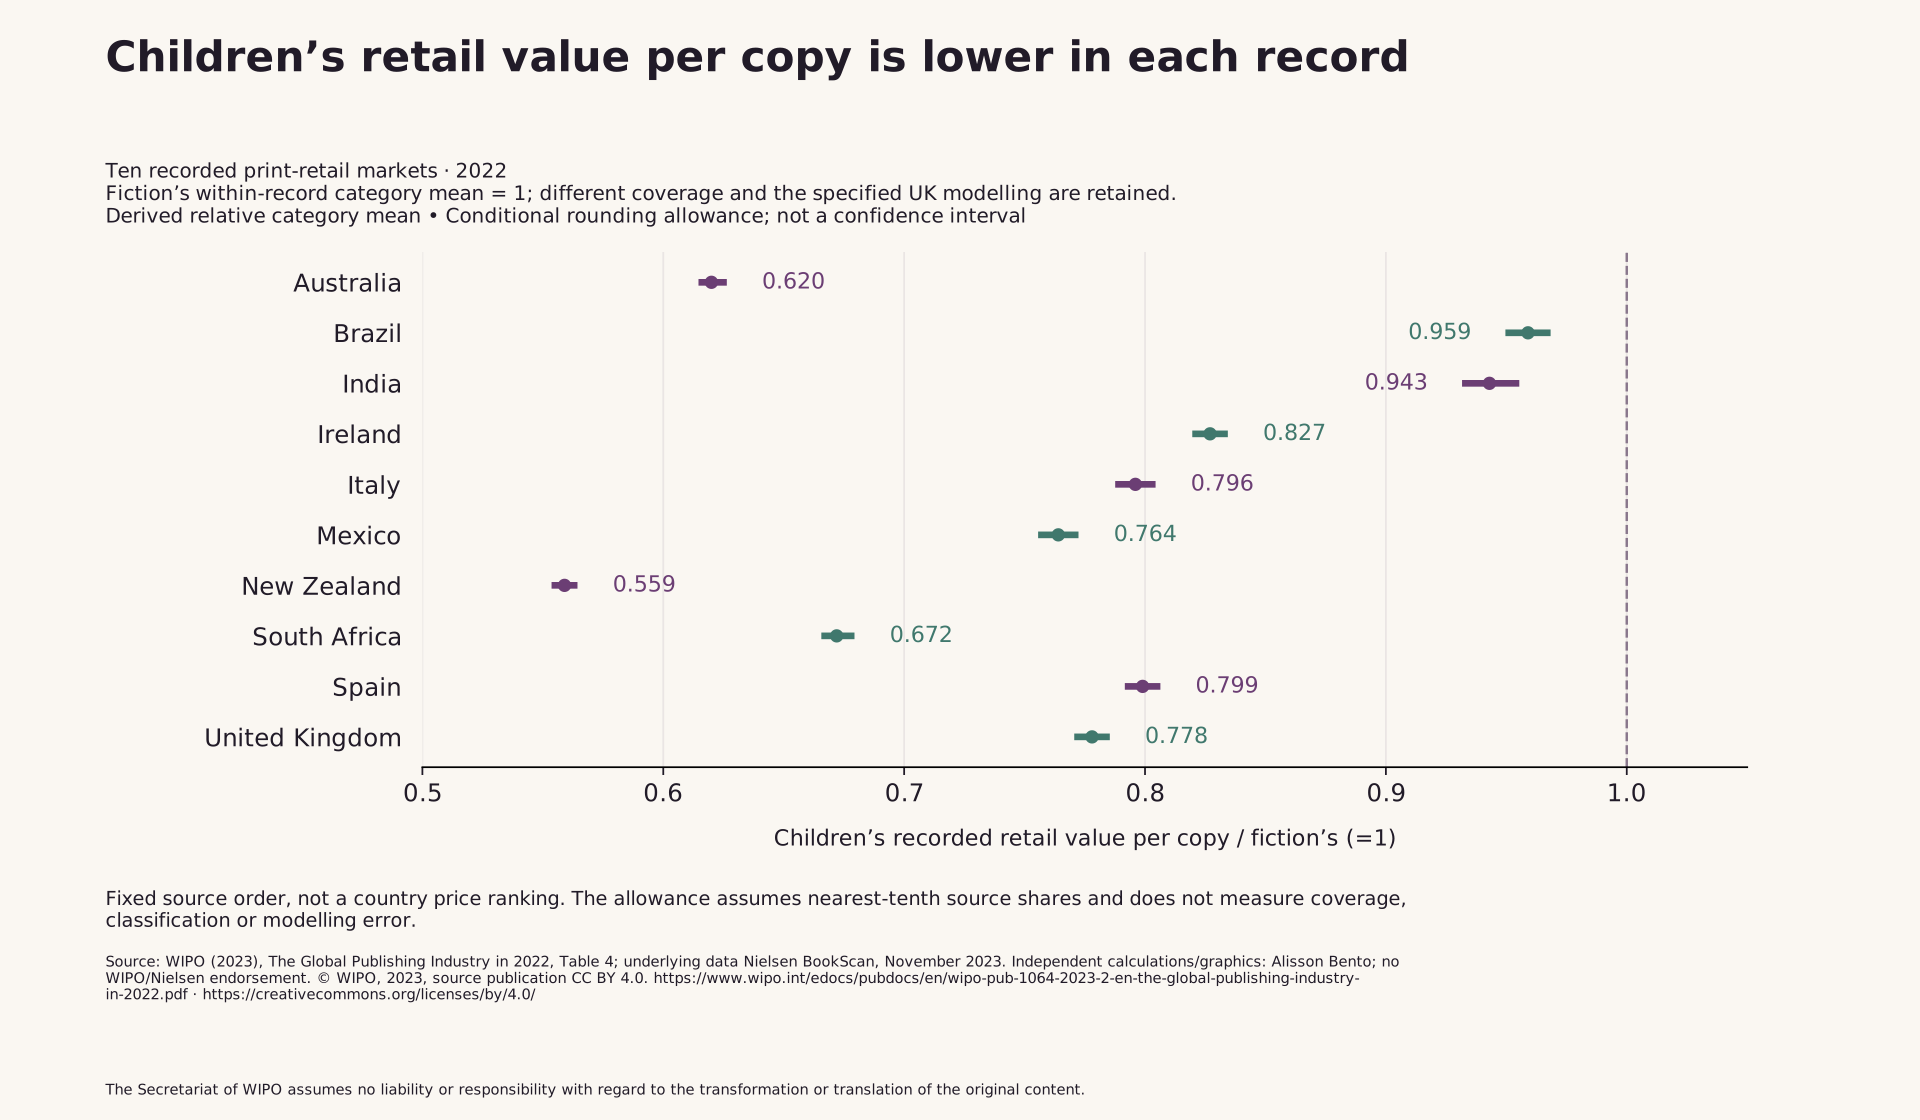
Children’s books generated a lower average recorded retail value per copy than the fiction category in each of ten 2022 print-retail market records published by WIPO. The calculated children’s-to-fiction ratios range from approximately 0.559 to 0.959. Within each record, fiction’s average is the reference value of one; the figures do not compare the prices of books in different countries.
The direction remains unchanged in every case when the four published percentage inputs are varied across an illustrative nearest-tenth rounding allowance. That is a conditional precision check, rather than a confidence interval or evidence that the underlying market data have no error.
This reference assembles one consistent comparison from paired copy-share and sales-value-share panels in WIPO’s The Global Publishing Industry in 2022. It offers original derived results and a method readers can reproduce from the official source PDF. The source year is 2022 and the report was published in 2023. These findings are historical, rather than estimates of the publishing market today.
What the ten records measure
The fixed set comprises Australia, Brazil, India, Ireland, Italy, Mexico, New Zealand, South Africa, Spain and the United Kingdom. Every record comes from Table 4 of the same WIPO report. No country was selected because its calculated ratio was especially large, small or convenient for the conclusion.
The underlying source is Nielsen BookScan, November 2023. The table concerns consumer print-book retail activity and presents separate distributions for copies sold and sales revenue. Its category labels are fiction, children’s books and non-fiction. This study retains the fiction and children’s labels as reported. It does not redefine fiction as adult romance, or children’s books as a specific age band, binding or literary genre.
Coverage differs across the ten markets. WIPO describes coverage percentages for most records and characterizes India’s coverage as a significant part of the organized market. The United Kingdom’s 2020–2022 market estimates use retail modelling and consumer-reported purchases. Consequently, these are the source’s recorded or specified-model market aggregates, rather than ten equally complete national censuses or a random sample of world publishing.
From two shares to a relative value per copy
A category’s share of retail sales value and its share of sold copies answer different questions. Dividing its value share by its copy share expresses its average recorded retail value per copy relative to the overall market average in that record. Dividing that result by the corresponding fiction result removes the overall-market reference.
The calculation is therefore: children’s value share divided by children’s copy share, then divided by fiction’s value share divided by fiction’s copy share. The equivalent multiplication form is children’s value share times fiction’s copy share, divided by children’s copy share times fiction’s value share. All four inputs come from the same record and reference year.
This relationship follows from sales value divided by sold copies. It is not a new pricing theory. Its usefulness is that the paired source panels can be read together without confusing a large copy share with an equally large sales-value share. The resulting ratio is dimensionless: it measures one category relative to another within the source record, without requiring a common international currency or a conversion to a publisher’s income.
A simple illustration of the distinction
Consider a hypothetical example, unrelated to any of the ten records. Suppose one category sells 20 copies with a combined retail value of 100 accounting units, while another sells ten copies with a combined value of 80 units. The first category has the larger copy total and sales-value total, but its average value per copy is five units rather than eight. Its relative value per copy is 0.625.
Neither the larger number of copies nor the larger total sales value settles the average-per-copy comparison. Equally, the relative average does not say which category is more profitable, which customers prefer a particular title, or what price a new book should carry. Those questions need information about costs, transactions, products and readers that this aggregate example does not contain.
The actual study applies the same accounting relationship to the source’s published percentage shares. It does not insert the hypothetical values into the empirical results. The downloadable result table contains the calculated ratios for the ten fixed historical records, with the conditional precision limits shown separately.
The result across the fixed ten records
Every calculated children’s-to-fiction ratio is below one. In the Australia record it is approximately 0.620; Brazil is 0.959; India, 0.943; Ireland, 0.827; and Italy, 0.796. The remaining records are Mexico at 0.764, New Zealand at 0.559, South Africa at 0.672, Spain at 0.799 and the United Kingdom at 0.778.
The table and figure preserve the fixed case order. They do not rank countries from cheapest to most expensive. For example, a ratio closer to one in the Brazil record means that children’s and fiction’s recorded averages are closer to each other within that record. It does not establish that a Brazilian children’s book costs more than a New Zealand children’s book, or that the same title receives different prices in those places.
Expressed with fiction’s within-record average set to 100, children’s average is roughly 56 to 96 across these records. That is a descriptive range of ten relative values, not a world estimate, an uncertainty interval around a global average, or a benchmark that every book in either category should meet.
Why currency cancels from this comparison
Both category sales values within a record use the same monetary measurement. Multiplying them by a common currency-conversion factor changes both category averages by that factor. When one average is divided by the other, the common factor cancels. The overall record’s copy and sales-value totals also cancel when the calculation is written in terms of shares.
No exchange-rate conversion is needed for the primary ratio. This avoids treating changes in currency conversion as changes in category pricing. It does not create a measure of purchasing power or make the underlying products identical across countries. A dimensionless within-record comparison can be consistent arithmetically while the mix of products, retailers and coverage remains different.
For that reason the study does not pool the ten retail markets into one worldwide price level. It does not average country currency amounts, estimate a global children’s-book market total, or assign weights based on which national book industry is largest. The result is a set of within-record relationships, each with its own source coverage.
What the rounding check tests
The focal shares in the published PDF are displayed to one decimal percentage point. The analysis first computes ratios from those displayed values. It then asks what happens under a specific additional assumption: each displayed share represents nearest-tenth rounding, allowing an underlying value up to 0.05 percentage points below or above the printed number.
The report does not establish that this is the source’s rounding rule. The allowance is therefore labelled conditional. It does not measure sampling error, retail-panel coverage error, modelling uncertainty, category misclassification or later revision. A small numerical allowance cannot stand in for those larger questions about measurement.
For each record, the ratio increases when children’s value share or fiction’s copy share increases, and decreases when children’s copy share or fiction’s value share increases. The conservative lower and upper limits follow those directions. Independent checking evaluated all 16 combinations of the four endpoint choices. Each upper limit remains below one under that allowance. Publicly displayed limits are rounded outward, so display rounding does not exclude values permitted by the calculation.
Category totals are not silently repaired
Some category distributions printed in the source do not add to 100%. The study preserves that fact and does not invent a missing category, fill the residual into fiction, or rescale the displayed columns to force a complete partition. The source note describes the breadth of non-fiction and varying educational-book coverage, but it does not resolve every residual in the printed distributions.
The focal calculation uses the children’s and fiction shares as reported in their paired panels. It requires common within-record copy and value denominators for those shares; it does not require the displayed genre list to exhaust all sales. No conclusion is drawn about the identity or average value of unreported residual activity.
This treatment also avoids changing the meaning of the source’s categories in order to produce a cleaner-looking chart. A future source update that changes classifications or coverage should be reviewed as a new measurement frame. It should not simply replace a cell in this snapshot while leaving the original interpretation unchanged.
Average recorded value is not a list-price comparison
The ratio combines the retail value and sold-copy measures supplied by the source. Differences can reflect the titles that sold, binding and product mix, retail discounts, transaction coverage and other features of the recorded aggregate. The data do not identify which mechanism generated the difference, or how large any individual mechanism was.
An average can also differ substantially from the median transaction. A few higher-value products can change the average without describing the typical purchase. The study has no title-level or transaction-level distribution from which to estimate that median, separate formats, or hold the product mix constant.
The results therefore should not be called a quality-adjusted price index or a list of recommended selling prices. Nor does a lower category average establish lower production cost, a lower publisher margin or a lower royalty rate. Each of those quantities has a different definition and requires additional evidence.
Translating the ratio into equal mean retail value
The inverse ratio offers another way to express the same result. Across the ten point calculations, approximately 1.04 to 1.79 children’s copies correspond to the average recorded retail value of one fiction copy. This is arithmetic using category averages, rather than a prediction about how many books a particular reader will buy.
The fractional quantities do not describe literal transactions. They can be scaled into an illustrative comparison of many copies, but doing so does not hold title mix, discounts or future sales conditions constant in the real world. The inverse view remains the same research question and does not provide a separate demand forecast.
For an editor explaining book-market statistics, this view can make the distinction between volume and value easier to see. A category can represent many sold copies while generating a smaller value share. That observation is useful without assuming that authors or publishers receive the retail value recorded at the checkout.
How authors, publishers and reporters can use the reference
An author or publisher can use the table as historical context for discussions that compare category copy sales. It shows why copy counts alone are insufficient to describe the recorded retail-value mix. It cannot decide whether an individual manuscript, format, territory or price is commercially attractive.
A reporter can accurately state that children’s average recorded retail value per copy was lower than fiction’s within each of these ten 2022 source records. The historical year, print-retail scope and relative within-record measure belong close to that statement. Replacing it with “children’s books are cheaper worldwide” would claim a different population, a different price measure and a broader period than this analysis supports.
The source already separates copies and sales value, and industry research has long used average selling-value measures. This reference’s contribution is the accessible fixed-ten pairing, transparent ratios, conditional precision check and reproducible route from the published source. It makes no claim to be the first analysis of category price differences or to replace detailed retail-market research.
Reproducing the results without redistributing the source table
The original WIPO PDF remains available from its official source. The companion recipe asks the reader to obtain that source legitimately and supply the local PDF path. It verifies the exact source checksum, locates the paired Table 4 panels and computes the derived results. The recipe makes no network requests and does not require access to a paid retail database.
Public downloads contain original calculated ratios, methods and code. They do not contain the original workbook, a raw selected-cell matrix, source-table images or a replacement export of the original panels. The source data and the attached workbook were retained as private audit evidence; the public result is the independent derived comparison.
Machine-readable ratios are provided at their stated display precision, with conditional limits rounded outward. The complete source identifiers and interpretation conditions travel with those outputs. A changed source file stops the calculation and requires a fresh source review rather than a silent update to a report whose categories or coverage may have changed.
Source, attribution and reuse
The numerical source is WIPO (2023), The Global Publishing Industry in 2022, Table 4, printed page 20, with underlying source attribution to Nielsen BookScan, November 2023. Alisson Bento calculated the relative measures and created the original explanatory text and graphics. The material does not imply WIPO or Nielsen endorsement.
The WIPO publication is © WIPO, 2023 and carries a CC BY 4.0 notice, with separate conditions for third-party content. This does not establish a licence to redistribute Nielsen raw data. Reuse of this study’s original outputs should retain the source, independent-adaptation credit, licence references and required notice provided with the downloads. The original source and licence links accompany the figures and result files.
The Secretariat of WIPO assumes no liability or responsibility with regard to the transformation or translation of the original content.
Children’s retail value per copy is lower in each record
Ten recorded print-retail markets · 2022. Fiction’s within-record category mean = 1; different coverage and the specified UK modelling are retained. Derived relative category mean. Conditional rounding allowance; not a confidence interval. Fixed source order, not a country price ranking. The allowance assumes nearest-tenth source shares and does not measure coverage, classification or modelling error.
Full chart and source
Scroll horizontally to inspect the chart. ↔
Chart and values
Scroll horizontally to see all columns.
| Market record | Children / fiction value per copy | Conditional lower | Conditional upper | Children’s copies for one fiction-copy mean value |
|---|---|---|---|---|
| Australia | 0.620 | 0.616 | 0.625 | 1.612 |
| Brazil | 0.959 | 0.951 | 0.967 | 1.043 |
| India | 0.943 | 0.933 | 0.954 | 1.060 |
| Ireland | 0.827 | 0.821 | 0.833 | 1.209 |
| Italy | 0.796 | 0.789 | 0.803 | 1.256 |
| Mexico | 0.764 | 0.757 | 0.771 | 1.309 |
| New Zealand | 0.559 | 0.555 | 0.563 | 1.789 |
| South Africa | 0.672 | 0.667 | 0.678 | 1.487 |
| Spain | 0.799 | 0.793 | 0.805 | 1.251 |
| United Kingdom | 0.778 | 0.772 | 0.784 | 1.286 |
All ratios are calculated within each 2022 source record. Fiction = 1. Conditional bounds use an assumed nearest-tenth share allowance, are rounded outward, and are not sampling intervals. Original raw source panels are not redistributed. Source: WIPO (2023), The Global Publishing Industry in 2022, Table 4; underlying data Nielsen BookScan, November 2023. Independent calculations/graphics: Alisson Bento; no WIPO/Nielsen endorsement. © WIPO, 2023, source publication CC BY 4.0. https://www.wipo.int/edocs/pubdocs/en/wipo-pub-1064-2023-2-en-the-global-publishing-industry-in-2022.pdf · https://creativecommons.org/licenses/by/4.0/ The Secretariat of WIPO assumes no liability or responsibility with regard to the transformation or translation of the original content.

Equal mean retail value requires more children’s copies
Historical 2022 category averages · inverse-ratio illustration. The reference is the average recorded value of 100 fiction copies within each source record. Approximate arithmetic at category means, not literal transactions, a sales forecast or publisher/author receipts. Source classifications and differing coverage remain.
Full chart and source

Scroll horizontally to inspect the chart. ↔
Chart and values
Scroll horizontally to see all columns.
| Market record | Children / fiction value per copy | Conditional lower | Conditional upper | Children’s copies for one fiction-copy mean value |
|---|---|---|---|---|
| Australia | 0.620 | 0.616 | 0.625 | 1.612 |
| Brazil | 0.959 | 0.951 | 0.967 | 1.043 |
| India | 0.943 | 0.933 | 0.954 | 1.060 |
| Ireland | 0.827 | 0.821 | 0.833 | 1.209 |
| Italy | 0.796 | 0.789 | 0.803 | 1.256 |
| Mexico | 0.764 | 0.757 | 0.771 | 1.309 |
| New Zealand | 0.559 | 0.555 | 0.563 | 1.789 |
| South Africa | 0.672 | 0.667 | 0.678 | 1.487 |
| Spain | 0.799 | 0.793 | 0.805 | 1.251 |
| United Kingdom | 0.778 | 0.772 | 0.784 | 1.286 |
All ratios are calculated within each 2022 source record. Fiction = 1. Conditional bounds use an assumed nearest-tenth share allowance, are rounded outward, and are not sampling intervals. Original raw source panels are not redistributed. Source: WIPO (2023), The Global Publishing Industry in 2022, Table 4; underlying data Nielsen BookScan, November 2023. Independent calculations/graphics: Alisson Bento; no WIPO/Nielsen endorsement. © WIPO, 2023, source publication CC BY 4.0. https://www.wipo.int/edocs/pubdocs/en/wipo-pub-1064-2023-2-en-the-global-publishing-industry-in-2022.pdf · https://creativecommons.org/licenses/by/4.0/ The Secretariat of WIPO assumes no liability or responsibility with regard to the transformation or translation of the original content.

Data & downloads
Scroll horizontally to see all columns.
| Market record | Children / fiction value per copy | Conditional lower | Conditional upper | Children’s copies for one fiction-copy mean value |
|---|---|---|---|---|
| Australia | 0.620 | 0.616 | 0.625 | 1.612 |
| Brazil | 0.959 | 0.951 | 0.967 | 1.043 |
| India | 0.943 | 0.933 | 0.954 | 1.060 |
| Ireland | 0.827 | 0.821 | 0.833 | 1.209 |
| Italy | 0.796 | 0.789 | 0.803 | 1.256 |
| Mexico | 0.764 | 0.757 | 0.771 | 1.309 |
| New Zealand | 0.559 | 0.555 | 0.563 | 1.789 |
| South Africa | 0.672 | 0.667 | 0.678 | 1.487 |
| Spain | 0.799 | 0.793 | 0.805 | 1.251 |
| United Kingdom | 0.778 | 0.772 | 0.784 | 1.286 |
All ratios are calculated within each 2022 source record. Fiction = 1. Conditional bounds use an assumed nearest-tenth share allowance, are rounded outward, and are not sampling intervals. Original raw source panels are not redistributed. Source: WIPO (2023), The Global Publishing Industry in 2022, Table 4; underlying data Nielsen BookScan, November 2023. Independent calculations/graphics: Alisson Bento; no WIPO/Nielsen endorsement. © WIPO, 2023, source publication CC BY 4.0. https://www.wipo.int/edocs/pubdocs/en/wipo-pub-1064-2023-2-en-the-global-publishing-industry-in-2022.pdf · https://creativecommons.org/licenses/by/4.0/ The Secretariat of WIPO assumes no liability or responsibility with regard to the transformation or translation of the original content.
Evidence & method
How we calculated it
- Fix all ten market records in WIPO Table 4 before calculating the primary ratio. Use only paired 2022 fiction/children copy-share and retail-value-share panels from the same published PDF.
- Compute R = (children value share × fiction copy share) / (children copy share × fiction value share). Overall market totals and a common within-record currency factor cancel. Do not renormalize incomplete category distributions.
- For a separately labelled nearest-tenth rounding assumption, vary each share by ±0.05 percentage points. Monotone lower/upper ratios and all 16 endpoint combinations test direction only; not sampling or coverage uncertainty.
- Reproduce derived-only results from a legitimately user-obtained, checksum-pinned original WIPO PDF. No raw source table, selected-cell matrix, original workbook or source images are included in public downloads.
What the data cannot tell us
- Historical 2022 recorded consumer-print retail aggregates have differing coverage; UK 2020–2022 estimates include retail modelling and consumer-reported purchases. Not equally complete national censuses or a random world sample.
- The measure is relative average recorded retail value per sold copy. It is not list price, a matched-title price index, publisher net receipts, profits, author income or a recommended selling price.
- Title, binding/product, discount and transaction mix can influence the average; the source does not identify which mechanism caused the difference. Means do not establish medians.
- The source labels fiction and children’s are preserved without an adult-romance, age-band, binding or format reclassification. Printed category residuals are retained rather than normalized away.
- The rounding allowance assumes nearest-tenth shares and does not establish the source’s rounding rule. It is not a confidence interval or protection against model, classification, coverage or revision error.
Original sources
- WIPO (2023): The Global Publishing Industry in 2022
WIPO’s 2023 publication, Table 4 (printed page 20), supplies paired 2022 print-retail copy/value distributions attributed to Nielsen BookScan, November 2023; preserve market coverage and UK modelling notes.
Accessed October 31, 2026
- CC BY 4.0 source-publication licence and third-party limitations
Source publication © WIPO, 2023, CC BY 4.0; independent derivatives require WIPO credit/change notice and exact Secretariat disclaimer. Third-party rights remain separate; no Nielsen raw-data licence is established.
Accessed October 31, 2026
Cite & reuse this study
Alisson Bento. 2026. Children’s books and fiction: retail value per copy in ten print markets. https://alissonbento.com/research/children-fiction-print-value-per-copy-2022/
Source: WIPO (2023), The Global Publishing Industry in 2022, Table 4; underlying data Nielsen BookScan, November 2023. Independent calculations/graphics: Alisson Bento; no WIPO/Nielsen endorsement. © WIPO, 2023, source publication CC BY 4.0. https://www.wipo.int/edocs/pubdocs/en/wipo-pub-1064-2023-2-en-the-global-publishing-industry-in-2022.pdf · https://creativecommons.org/licenses/by/4.0/ Source publication © WIPO, 2023, CC BY 4.0; independent derivatives require WIPO credit/change notice and exact Secretariat disclaimer. Third-party rights remain separate; no Nielsen raw-data licence is established. The Secretariat of WIPO assumes no liability or responsibility with regard to the transformation or translation of the original content.
Corrections or editorial questions