
The annual purchase reference
We have brought together the Ministry of Culture’s annual new-print, used-print and digital share series for 2012–2025. Alongside the source numbers, this reference shows what their coarse rounding allows us to calculate. The main practical distinction is between buying a different mix of books and paying a different price for comparable books. The public data support the first description much more clearly than the second.
Three findings readers can quote
The downloadable table covers all 14 selected years and all three source categories. Every sensitivity range is about the effect of rounding the published figures. None is a statistical confidence interval or a substitute for the panel’s unpublished sampling uncertainty.
- Used books’ published share of purchased copies rose from 16% in 2022 to 21% in 2025. Their spending share rose from 7% to 10%. These are shares of the Kantar purchase universe, excluding schoolbooks, rather than counts of French residents or all books read.
- The average expenditure per copy in the 2025 used-book basket is consistent with roughly 37–42% of the new-print basket’s average under an explicit nearest-whole-percentage-point rounding assumption. This compares different purchased baskets; it does not measure a discount on the same title.
- The available precision does not establish whether that relative used/new average changed after 2022: its 2022 sensitivity range, roughly 35–43%, overlaps the 2025 range. The growing role of used copies is clearer than a changing average price advantage.
What changed after the earlier official study?
The Ministry’s 156-page study published in 2024 already examined the used-book market, drawing on Kantar and GfK panels as well as interviews and other research. Its general historical comparison ends in 2022. It reports growing used-book purchases, differences between editorial categories and a considerably lower average purchase price for used books. Those findings are prior work, not discoveries of this article.
This reference uses the Ministry’s aggregate dataset updated 24 April 2026, extending the annual Kantar share comparison through 2025. We retain the three purchase categories together, show the original copy and spending shares, and test derived comparisons against coherent rounding bounds. The useful addition is a current, downloadable acquisition-basket reference that does not mistake a change in format mix for a change in the price of an unchanged book.
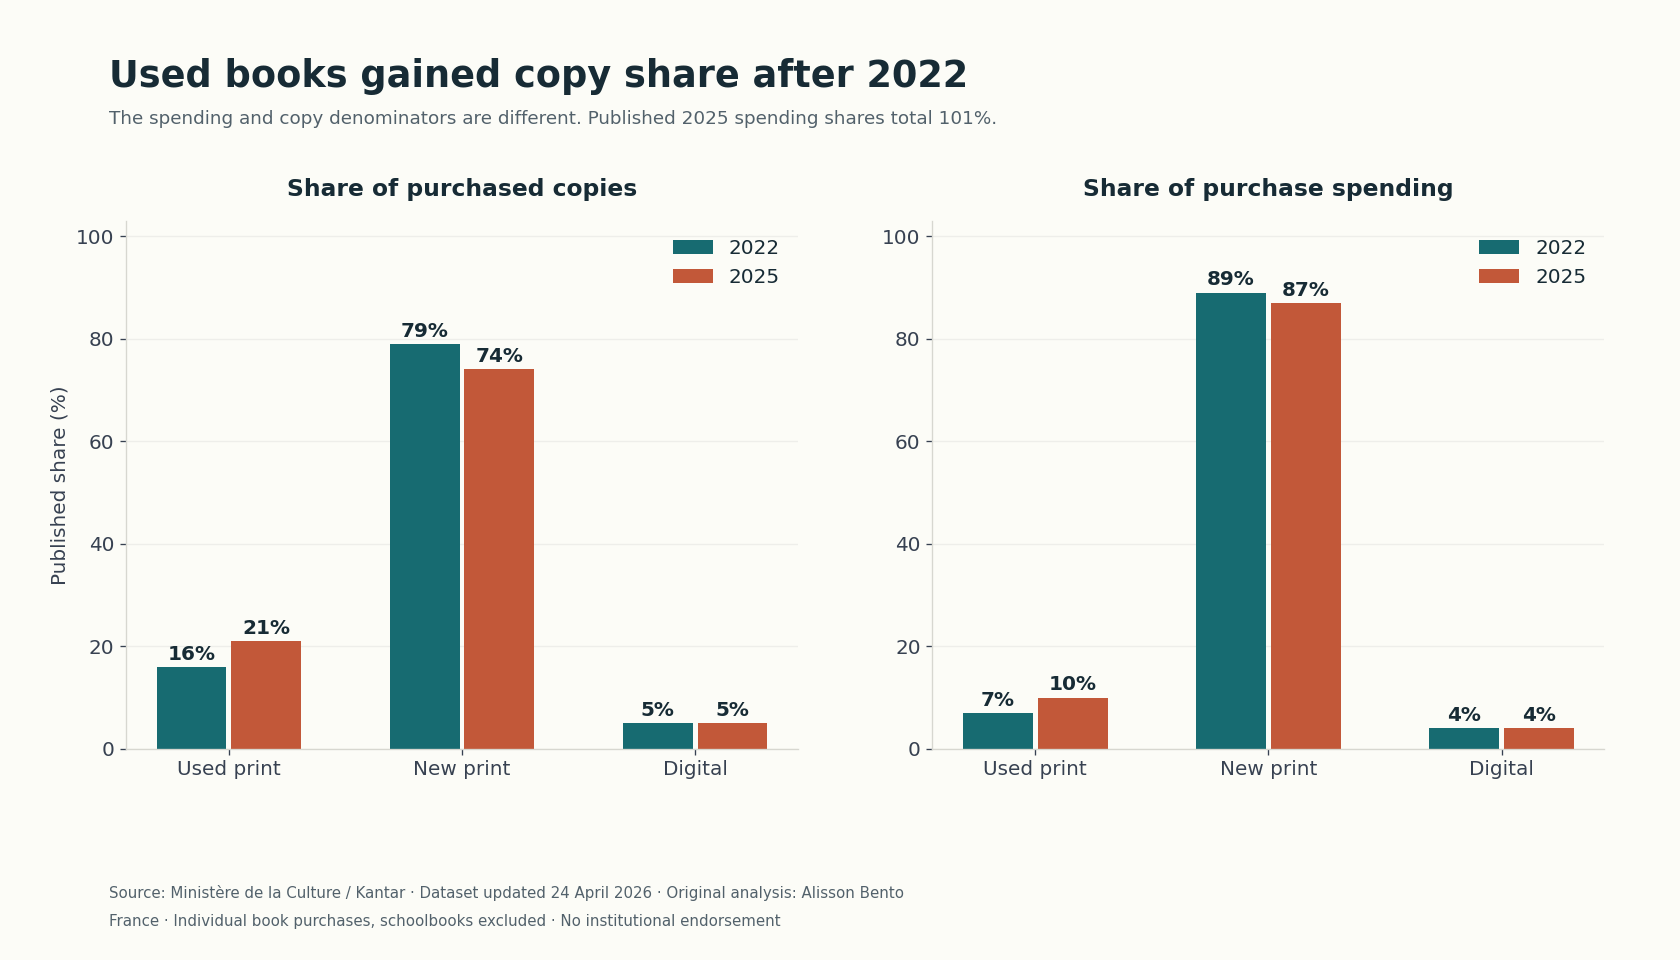
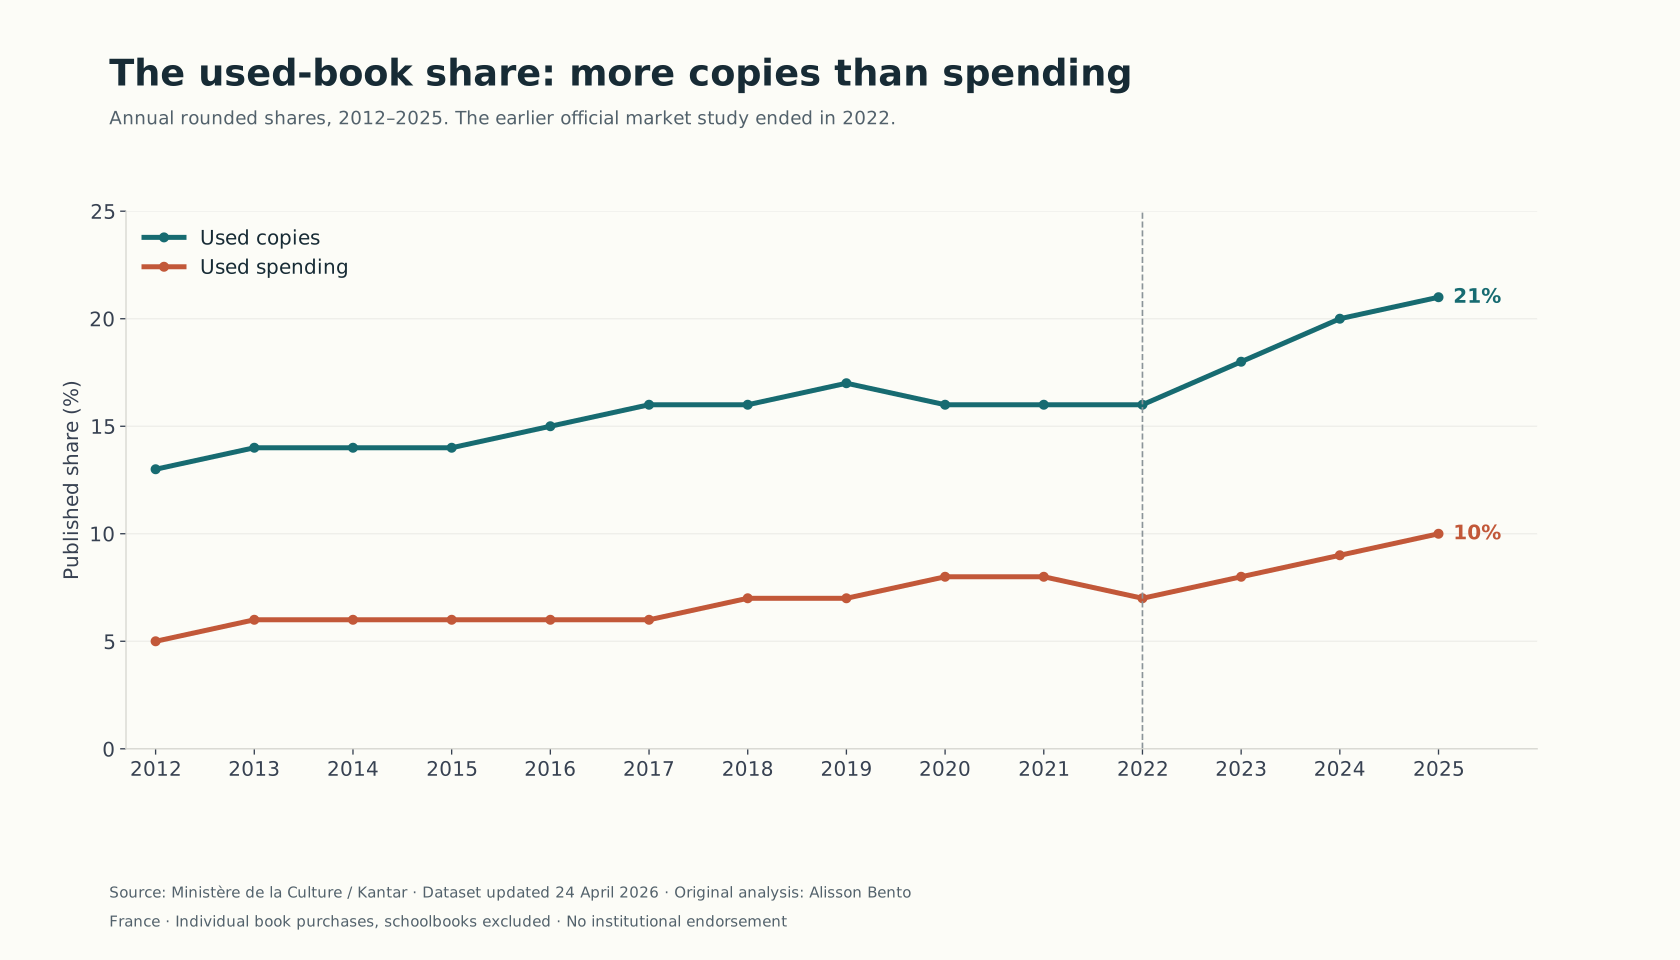
There is also a change in the recent pattern. In the displayed series, used books accounted for 16% of copies in each of 2020, 2021 and 2022, then 18% in 2023, 20% in 2024 and 21% in 2025. Spending shares were 8%, 8%, 7%, 8%, 9% and 10%, respectively. These are the published rounded observations, not exact underlying panel estimates. Describing the post-2022 mix as shifting toward used copies is supported even after allowing half a percentage point on either side of each displayed share.
Copies, spending and average unit value answer different questions
A copy share asks how purchased copies are distributed among categories. A spending share asks how the money spent on those purchases is distributed. A category can account for many copies and relatively little spending when its average purchased copy costs less than the overall average.
In 2025, the source displays 21 used copies out of every 100 purchased copies, alongside 10 out of every 100 units of book spending. New print accounts for 74% of copies and 87% of spending. Digital books account for 5% of copies and 4% of spending. The spending shares add to 101%, a visible reminder that rounded shares are not an exact accounting ledger.
To compare used with new print, divide the used spending share by its copy share, then divide that result by the same calculation for new print. The overall money and copy totals cancel. This produces an average expenditure-per-copy ratio within the common source universe without importing a euro total from another panel or from publishers’ accounts.
An average unit value describes what was bought. It can change because buyers choose different authors, genres, editions, lengths, conditions, sellers or bundles, as well as because transaction prices change. The dataset contains no title-level matching with which to separate these mechanisms. We therefore use “average expenditure per copy” rather than a matched-book price index.
Why we do not print one precise discount percentage
All six selected annual series are published in increments of 0.01 as proportions: one percentage point. The dictionary identifies the source and coverage but does not explicitly specify a rounding algorithm. We therefore make a transparent sensitivity assumption: suppose each displayed share was rounded to the nearest whole percentage point.
For each year, each true share is then allowed to lie half a percentage point below or above the displayed number, with the three copy shares summing to 100% and the three spending shares separately summing to 100%. We retain every feasible combination, including the closure constraint. We neither divide the displayed 101% total back down to 100% nor choose one adjusted vector and present it as the original observation.
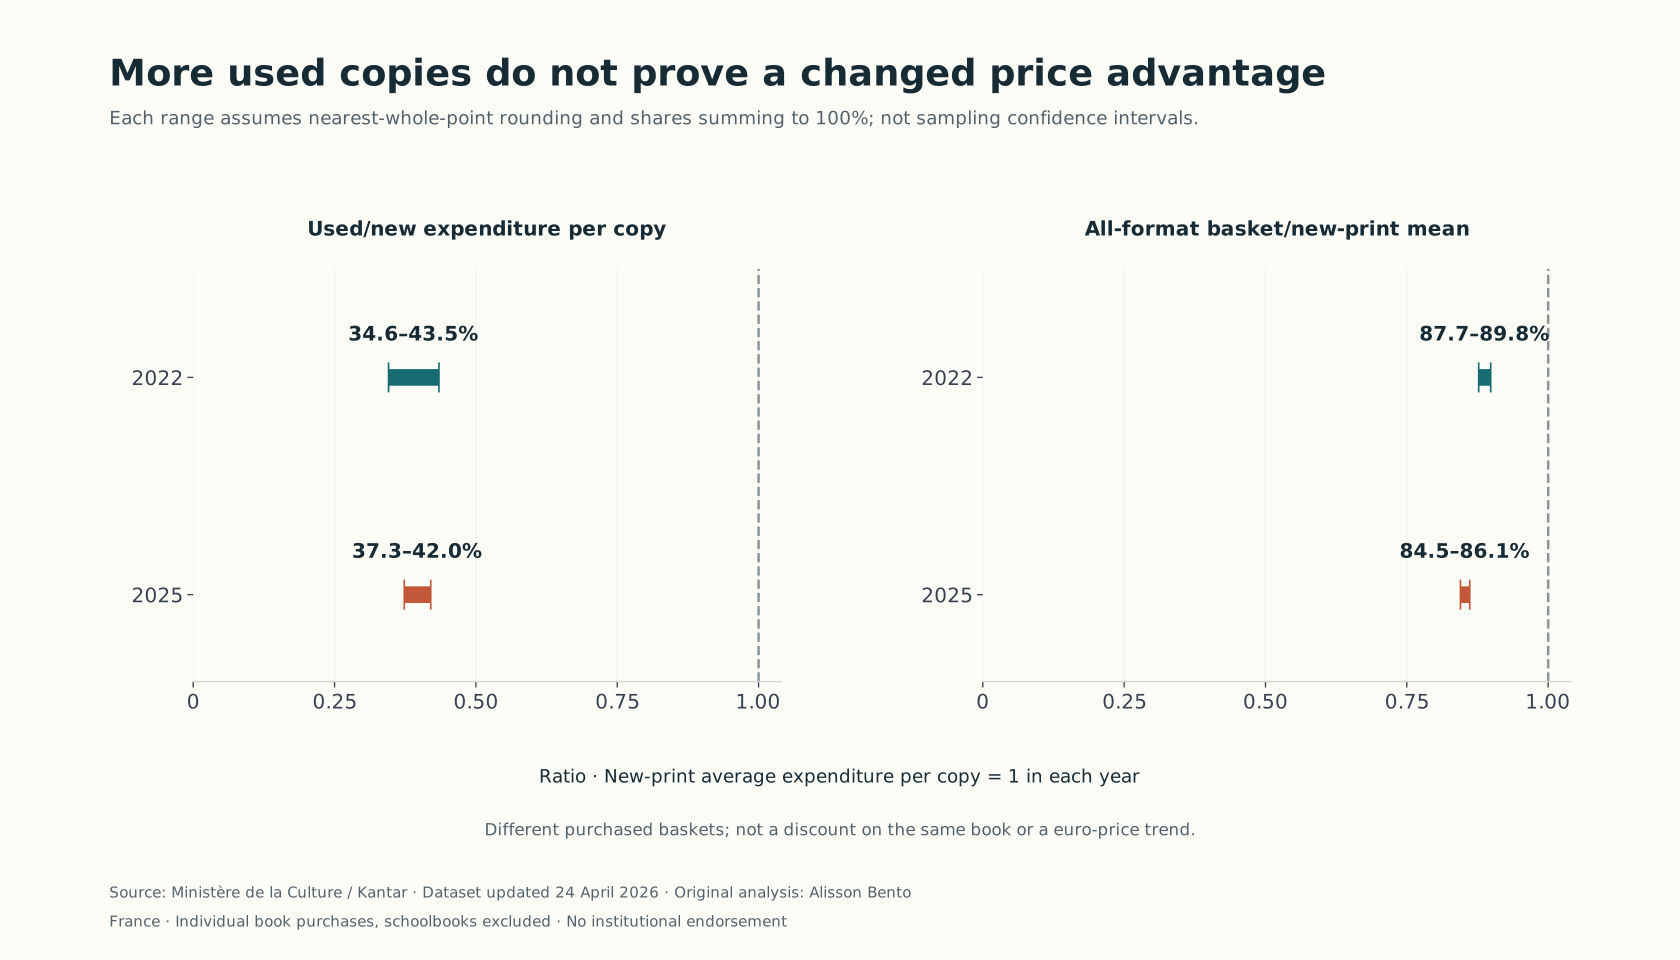
That matters for 2025. The coherent range for used/new average expenditure per copy is approximately 0.373–0.420. The 2022 range is 0.346–0.435. Although an unadjusted calculation from the printed figures produces a small increase, many underlying rounded-share combinations remain possible. The intervals overlap too much to support a directional claim about the change in that ratio.
These bounds deliberately address only numerical precision. They do not account for panel weighting, reporting error, changes in respondent composition or other survey uncertainty. Overlap is not a formal hypothesis test, and non-overlap in another metric is not a finding of statistical significance.
A different purchase mix can lower the basket average
A second useful comparison puts the average expenditure per copy across all three categories beside the new-print category average. Algebraically, that relative basket mean equals new print’s copy share divided by its spending share. It is not an absolute book price, an inflation measure or a household budget.
Under the same rounding assumption, the 2022 basket mean is approximately 87.7–89.8% of the new-print mean. In 2025 it is 84.5–86.1%. Every feasible endpoint comparison is lower in 2025, by about 1.6–5.3 points on a scale where that year’s new-print mean equals 100. Each year has its own new-print reference: this does not mean the euro cost of the basket fell.
We also supply a symmetric accounting bridge in the reproducible results. It separates the contribution of changes in category copy shares from changes in categories’ relative average expenditure per copy. It is an arithmetic description of the two endpoint baskets, not a causal model of what people would have bought without used books.
The conservative outer bound for the 2022–2025 mix component is negative throughout: roughly −4.3 to −1.8 points on the same new-print-relative scale. The direction of the within-category component remains unresolved. These component bounds are intentionally wider than a jointly optimized range; their endpoints must not be combined as if they described one actual basket. The reader-facing conclusion is straightforward: more used copies can make the overall purchase basket look less expensive relative to new print even when the data do not establish a changed used/new average price relationship.
What this helps a reader decide
If you are deciding whether to buy a particular book used, the national basket ratio is context, not a checkout quote. Compare the actual edition, condition, total delivered cost and availability of the copies you are considering. A low national used-book unit value does not guarantee that a scarce edition, a near-new copy or a posted parcel will be cheaper than your alternative.
For book clubs and reading-access organizations, the table supplies a current description of the role of second-hand purchasing. It does not identify which specific titles are affordable, whether a full club set can be obtained, or whether a digital licence allows the intended use. Those decisions need title- and supplier-level information.
For booksellers, publishers and reporters, copy share and spending share should travel together. A report that used books take 21% of copies should not silently turn that into 21% of revenue. Likewise, a higher second-hand share does not show that an equal number of new sales was displaced. Readers may buy both categories or change the total number of books they buy, and the same copy may be resold more than once.
The digital series remains in the table because excluding it changes the denominator. Its dictionary label is simply the digital-book category. The inspected dictionary does not settle subscription access, audiobook inclusion, reading completion or the treatment of every digital business model. We do not use this series to measure listening, streaming, piracy or Kindle Unlimited demand.
How to cite the 2022–2025 table without changing its meaning
For a short report, start with the two measures together: in the Ministry of Culture’s Kantar series, used books represented 21% of purchased copies and 10% of purchase spending in France in 2025, excluding schoolbooks. Give 2025 as the observation year and 24 April 2026 as the dataset update. The date of the release does not turn the purchases into 2026 observations. This formulation states the category, geography, period and separate denominators without making a claim about every reader.
To describe the recent change, compare the same columns with 2022: 16% of copies and 7% of spending. Keep both years and the same purchase scope in the sentence. Someone quoting only the rise in spending share could miss the simultaneous change in the copy mix. Someone quoting only the copy share could wrongly treat it as the second-hand share of revenue. The table makes both comparisons available, while the original rounded inputs remain visible.
To explain the basket comparison, say that each year’s average expenditure per copy across the three categories is expressed relative to that year’s average for new print. A lower ratio describes the composition and relative unit values of those purchases. It does not show a lower bill in euros between years, because the benchmark itself can change. It also does not identify a household that bought the same books twice under different conditions.
Finally, keep the conclusion that the used/new unit-value ranges overlap next to any price discussion. Do not convert the national ratio into a promised saving for a chosen title. For that decision, compare the actual copies and their delivered costs. The table classifies purchases, rather than all the books people can access through borrowing or existing collections. Its shares should not be presented as the distribution of all reading access.
Source, method and reproduction
The source is “Chiffres clés dans le secteur du livre,” published by the French Ministry of Culture’s book-economy observatory and updated 24 April 2026. The dictionary attributes the six selected purchase-share series to Kantar and describes the market as purchases by individuals, excluding schoolbooks. The dataset is a published aggregate reference; we did not collect new participant data or obtain proprietary panel records.
The selected fields are the value and volume shares for occasion, imprimé neuf and numérique. We include 2012–2025. A 2011 row exists in the CSV, but the dictionary says the selected series start in 2012, so 2011 is held rather than silently accepted. Other columns in the same file come from other providers or represent different measures; they are not interchangeable denominators.
The reproduction script uses exact rational arithmetic. It constructs the vertices of each feasible three-share simplex. For each format, the relative unit-value ratio factors into a positive spending-share ratio and an independent positive copy-share ratio. Each linear-fractional factor reaches its extremes at a simplex vertex, allowing the combined extremes to be obtained from vertex pairs. Endpoint-difference bounds use separate feasible endpoint years. The bridge uses conservative interval operations and is labelled accordingly.
The public CSV records the displayed inputs, source sums and derived ranges for all 42 year/category combinations. The source ledger gives the exact original URLs, file hashes, reference period and licence scope. The code runs without network requests once the original CSV is placed in the documented location. Its hash check prevents a later changed download from silently reproducing a different study.
Limits, attribution and reuse
This is a descriptive analysis of one published French purchase-panel series. It is not a census of all transactions, a world book-market ranking, a direct measure of reading, an author-income estimate or a claim about affordability after income and inflation. No causal substitution effect, environmental saving or loss of author royalties is estimated.
The current official aggregate dataset is offered under Licence Ouverte / Open Licence 2.0. Its Ministry/Kantar source and 24 April 2026 update date must remain attached to reused data. Our prose, calculations and charts are original analytical outputs, with no suggestion of Ministry or Kantar endorsement. The separate 2024 report is cited as prior work; its text, layout, tables and underlying proprietary records are not republished or relicensed here.
Suggested citation: Alisson Bento. 2026. Used books take a bigger place in France’s buying basket. Has their price advantage changed? Source analysis of Ministère de la Culture / Kantar, dataset updated 24 April 2026.
Used books gained copy share after 2022
2025 used books: 21% of purchased copies, 10% of spending. All published 2025 spending shares total 101%; no silent normalization.
Full chart and source

Scroll horizontally to inspect the chart. ↔
Chart and values
Scroll horizontally to see all columns.
| Year | Used copies % | Used spending % | New copies % | New spending % | Digital copies % | Digital spending % | Spending sum % |
|---|---|---|---|---|---|---|---|
| 2012 | 13 | 5 | 85 | 93 | 2 | 2 | 100 |
| 2013 | 14 | 6 | 84 | 93 | 3 | 2 | 101 |
| 2014 | 14 | 6 | 83 | 92 | 3 | 2 | 100 |
| 2015 | 14 | 6 | 82 | 91 | 4 | 3 | 100 |
| 2016 | 15 | 6 | 81 | 91 | 4 | 3 | 100 |
| 2017 | 16 | 6 | 80 | 90 | 4 | 3 | 99 |
| 2018 | 16 | 7 | 80 | 90 | 4 | 4 | 101 |
| 2019 | 17 | 7 | 79 | 90 | 5 | 4 | 101 |
| 2020 | 16 | 8 | 78 | 88 | 6 | 4 | 100 |
| 2021 | 16 | 8 | 79 | 88 | 5 | 4 | 100 |
| 2022 | 16 | 7 | 79 | 89 | 5 | 4 | 100 |
| 2023 | 18 | 8 | 77 | 88 | 5 | 4 | 100 |
| 2024 | 20 | 9 | 75 | 87 | 5 | 4 | 100 |
| 2025 | 21 | 10 | 74 | 87 | 5 | 4 | 101 |
Source: Ministry of Culture / Kantar, updated 24 April 2026. Purchases excluding schoolbooks. Original rounded shares retained; totals may differ from 100%.
The used-book share: more copies than spending
Two different denominators; used-copy share rises from 16% in 2022 to 21% in 2025.
Full chart and source
Scroll horizontally to inspect the chart. ↔
Chart and values
Scroll horizontally to see all columns.
| Year | Used copies % | Used spending % | New copies % | New spending % | Digital copies % | Digital spending % | Spending sum % |
|---|---|---|---|---|---|---|---|
| 2012 | 13 | 5 | 85 | 93 | 2 | 2 | 100 |
| 2013 | 14 | 6 | 84 | 93 | 3 | 2 | 101 |
| 2014 | 14 | 6 | 83 | 92 | 3 | 2 | 100 |
| 2015 | 14 | 6 | 82 | 91 | 4 | 3 | 100 |
| 2016 | 15 | 6 | 81 | 91 | 4 | 3 | 100 |
| 2017 | 16 | 6 | 80 | 90 | 4 | 3 | 99 |
| 2018 | 16 | 7 | 80 | 90 | 4 | 4 | 101 |
| 2019 | 17 | 7 | 79 | 90 | 5 | 4 | 101 |
| 2020 | 16 | 8 | 78 | 88 | 6 | 4 | 100 |
| 2021 | 16 | 8 | 79 | 88 | 5 | 4 | 100 |
| 2022 | 16 | 7 | 79 | 89 | 5 | 4 | 100 |
| 2023 | 18 | 8 | 77 | 88 | 5 | 4 | 100 |
| 2024 | 20 | 9 | 75 | 87 | 5 | 4 | 100 |
| 2025 | 21 | 10 | 74 | 87 | 5 | 4 | 101 |
Source: Ministry of Culture / Kantar, updated 24 April 2026. Purchases excluding schoolbooks. Original rounded shares retained; totals may differ from 100%.

More used copies do not prove a changed price advantage
Conditional rounding sensitivity, not sampling confidence intervals. Used/new unit-value ranges overlap; the all-format/new-print mean ratio decreases.
Full chart and source
Scroll horizontally to inspect the chart. ↔
Chart and values
Scroll horizontally to see all columns.
| Year | Used/new mean per copy % | All-format/new-print mean % |
|---|---|---|
| 2012 | 30.1–40.7 | 90.3–92.5 |
| 2013 | 35.2–40.4 | 89.7–90.9 |
| 2014 | 33.8–44.0 | 89.1–91.3 |
| 2015 | 33.7–43.9 | 89.0–91.2 |
| 2016 | 31.2–40.4 | 87.9–90.1 |
| 2017 | 31.9–37.6 | 87.8–89.5 |
| 2018 | 34.7–40.7 | 88.3–90.0 |
| 2019 | 33.3–37.5 | 87.2–88.3 |
| 2020 | 39.8–49.2 | 87.5–89.8 |
| 2021 | 40.3–49.9 | 88.7–90.9 |
| 2022 | 34.5–43.5 | 87.7–89.9 |
| 2023 | 35.0–43.1 | 86.4–88.6 |
| 2024 | 35.3–42.6 | 85.1–87.3 |
| 2025 | 37.3–42.1 | 84.4–86.2 |
Nearest-whole-point rounding assumed, with shares summing to 100%. Table bounds rounded outward to 0.1 percentage point; figure labels rounded to nearest tenth. Not confidence intervals or same-title discounts.

Data & downloads
Scroll horizontally to see all columns.
| Year | Used copies % | Used spending % | New copies % | New spending % | Digital copies % | Digital spending % | Spending sum % |
|---|---|---|---|---|---|---|---|
| 2012 | 13 | 5 | 85 | 93 | 2 | 2 | 100 |
| 2013 | 14 | 6 | 84 | 93 | 3 | 2 | 101 |
| 2014 | 14 | 6 | 83 | 92 | 3 | 2 | 100 |
| 2015 | 14 | 6 | 82 | 91 | 4 | 3 | 100 |
| 2016 | 15 | 6 | 81 | 91 | 4 | 3 | 100 |
| 2017 | 16 | 6 | 80 | 90 | 4 | 3 | 99 |
| 2018 | 16 | 7 | 80 | 90 | 4 | 4 | 101 |
| 2019 | 17 | 7 | 79 | 90 | 5 | 4 | 101 |
| 2020 | 16 | 8 | 78 | 88 | 6 | 4 | 100 |
| 2021 | 16 | 8 | 79 | 88 | 5 | 4 | 100 |
| 2022 | 16 | 7 | 79 | 89 | 5 | 4 | 100 |
| 2023 | 18 | 8 | 77 | 88 | 5 | 4 | 100 |
| 2024 | 20 | 9 | 75 | 87 | 5 | 4 | 100 |
| 2025 | 21 | 10 | 74 | 87 | 5 | 4 | 101 |
Source: Ministry of Culture / Kantar, updated 24 April 2026. Purchases excluding schoolbooks. Original rounded shares retained; totals may differ from 100%.
Scroll horizontally to see all columns.
| Year | Used/new mean per copy % | All-format/new-print mean % |
|---|---|---|
| 2012 | 30.1–40.7 | 90.3–92.5 |
| 2013 | 35.2–40.4 | 89.7–90.9 |
| 2014 | 33.8–44.0 | 89.1–91.3 |
| 2015 | 33.7–43.9 | 89.0–91.2 |
| 2016 | 31.2–40.4 | 87.9–90.1 |
| 2017 | 31.9–37.6 | 87.8–89.5 |
| 2018 | 34.7–40.7 | 88.3–90.0 |
| 2019 | 33.3–37.5 | 87.2–88.3 |
| 2020 | 39.8–49.2 | 87.5–89.8 |
| 2021 | 40.3–49.9 | 88.7–90.9 |
| 2022 | 34.5–43.5 | 87.7–89.9 |
| 2023 | 35.0–43.1 | 86.4–88.6 |
| 2024 | 35.3–42.6 | 85.1–87.3 |
| 2025 | 37.3–42.1 | 84.4–86.2 |
Nearest-whole-point rounding assumed, with shares summing to 100%. Table bounds rounded outward to 0.1 percentage point; figure labels rounded to nearest tenth. Not confidence intervals or same-title discounts.
Evidence & method
How we calculated it
- Use the six Kantar annual spending/copy-share series for used print, new print and digital, 2012–2025, excluding schoolbooks. Hold 2011 because the dictionary starts 2012. Do not pool GfK, SNE or publisher totals.
- Assume nearest-whole-percentage-point rounding as a sensitivity exercise, not a verified source rounding rule. Constrain each underlying share to within 0.005 of its published value and each three-share vector to sum to 1. No silent normalization.
- Calculate exact feasible relative unit-value ranges with rational simplex vertices. The ratio factors into two positive linear-fractional functions over independent value/copy feasible sets; their extrema occur at vertices. Endpoint years vary separately without a cross-year constraint.
- The symmetric mix bridge uses conservative outer interval bounds, not tight joint extrema, statistical intervals or a causal substitution model. Its component extrema must not be combined as one feasible observed basket.
What the data cannot tell us
- One French purchase-panel aggregate series, not a transaction census or an estimate of all books read. No fresh participant data or first-ever research claim.
- Different purchased baskets; no same-title or same-condition discount, euro-price inflation, household affordability, author-income or causal displacement estimate.
- Rounding sensitivity does not include panel sampling, reporting, weighting or composition uncertainty. Source dictionary does not specify the digital category’s full subscription/audio scope.
- The 2024 official prior study already covers 2012–2022 shares and average purchase-price differences. The original addition here is a current 2022–2025 extension, reusable annual table and explicit coherent precision accounting.
Original sources
- Ministère de la Culture: Chiffres clés dans le secteur du livre
Official aggregate dataset, updated 24 April 2026; Ministry of Culture / Kantar attribution and Open Licence 2.0 shown on the actual landing page.
Accessed October 31, 2026
- Official April 2026 aggregate CSV
Frozen six purchase-share series in the April 2026 CSV; schoolbooks excluded. All selected source shares have whole-percentage-point resolution.
Accessed October 31, 2026
- Official variable dictionary
Dictionary identifies Kantar and 2012 start. Conflicting 2011 CSV entry excluded; no unreported source-break correction invented.
Accessed October 31, 2026
- Official 2024 used-book market study, prior work
Official 156-page 2024 prior-art report; pages 10 and 35–43 consulted. Distinct report and proprietary panel data not redistributed or relicensed.
Accessed October 31, 2026
- Etalab: Licence Ouverte / Open Licence 2.0
Actual Etalab Open Licence 2.0 text, linked by the official dataset. Preserve source/update date and avoid any suggestion of endorsement.
Accessed October 31, 2026
Cite & reuse this study
Alisson Bento. 2026. Used books take a bigger place in France’s buying basket. Has their price advantage changed? https://alissonbento.com/research/france-used-new-digital-book-purchase-mix-2012-2025/
Source: Ministère de la Culture / Kantar, Chiffres clés dans le secteur du livre, updated 24 April 2026; official aggregate dataset under Licence Ouverte / Open Licence 2.0. Original analysis and graphics: Alisson Bento. No Ministry or Kantar endorsement. The separate 2024 report and proprietary panel records are not redistributed or relicensed.
Corrections or editorial questions