Spending and physical additions move in different directions
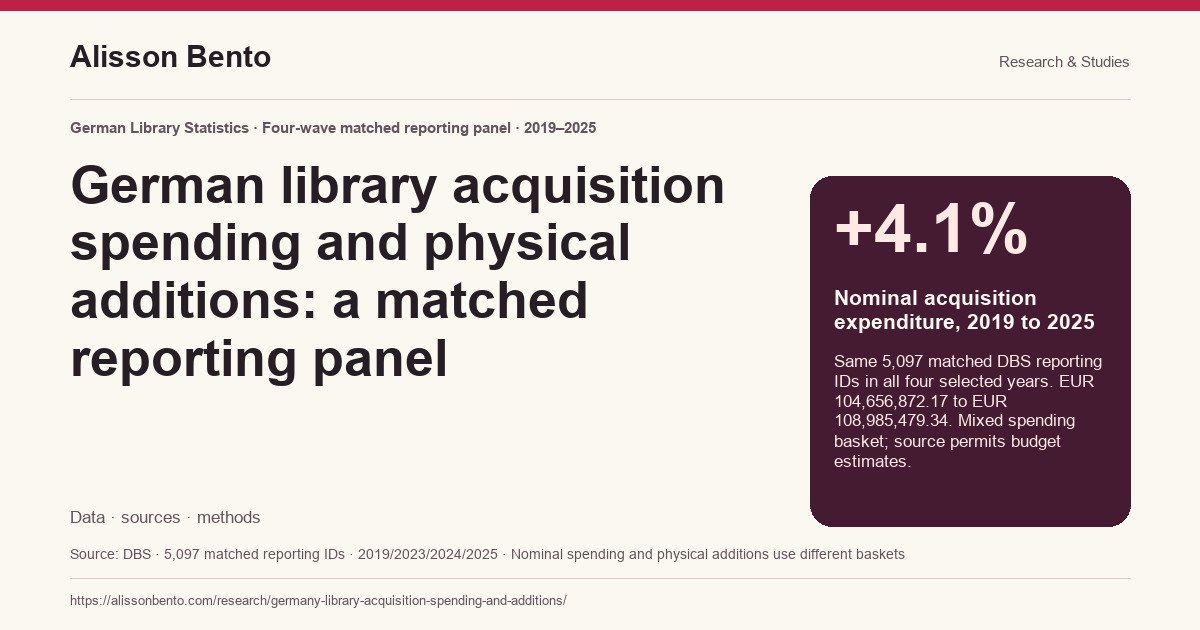
In a matched panel of 5,097 German Library Statistics reporting IDs, nominal acquisition expenditure was approximately 4.1% higher in 2025 than in 2019, while physical media additions were approximately 15.0% lower. Both statements use the same reporting panel. They describe a divergence between two published administrative measures, rather than a comparison between unrelated collections of libraries.
The source is the Deutsche Bibliotheksstatistik, or DBS. The analysis follows selected records through 2019, 2023, 2024 and 2025, using the public variable-evaluation service captured on 28 October 2026. These are four observation years, not an uninterrupted annual series. The retrieval date does not turn the measurements into 2026 conditions or establish the latest position of every institution.
The distinction matters for anyone repeating a library-spending headline. Higher nominal expenditure need not correspond to more physical additions because the two fields cover different baskets. Expenditure includes digital licences and other costs; physical additions include donations and periodical issues. The useful finding is that the recorded measures diverged in a specified matched panel. Explaining that divergence requires additional evidence.
The monetary result preserves cents and the reporting basket
Total acquisition expenditure in the primary panel rises from EUR 104,656,872.17 in 2019 to EUR 108,985,479.34 in 2025. Setting the 2019 total to an index of 100 gives a 2025 value of 104.136 after rounding to three decimals. The full downloadable table retains the underlying values and intermediate-year results, so a shortened headline can be traced to its numerator and baseline.
These are nominal euros. There is no adjustment for consumer prices, a library-specific cost index, purchasing power or changes in the mix of material acquired. A larger nominal total therefore does not establish that libraries could buy more, that their budgets improved in real terms or that their suppliers raised prices by any particular amount. No such interpretation is supplied by the arithmetic.
The unit label is supported by official DBS instructions, including selected-year 2024 guidance from Baden-Württemberg which states that currency entries are in euros, in some cases with decimal places. Cents are retained rather than silently imposing a whole-euro convention from a different regional document. Source finance instructions also allow budget estimates when actual expenditure is not yet available; reported expenditure is not necessarily a final audited payment total.
Physical media additions are broader than purchased books
The same 5,097 reporting IDs record 8,484,346 physical media additions in 2019 and 7,212,487 in 2025. Their aggregate additions index falls from 100 to 85.009. This is a count of additions to the reported physical collection under the source definition. It is not a count of newly purchased books, unique titles, newly published works or items successfully made available to a particular reader.
DBS question 36 includes physical units entering ownership through purchase, exchange, donation and other routes. Periodical issues are included. Received exchange stocks are not counted as additions by the receiving library under this definition, and additions to the virtual consortium collection are excluded. A change in donations or periodical handling can therefore affect this number without a corresponding change in book purchasing.
For an editor, the safe wording is physical media additions in the matched reporting panel. Substituting new books makes the statement easier to picture but changes its meaning. For a local library, the relevant follow-up is to examine which types and routes of additions changed. The aggregate field cannot supply that composition or identify the reasons for an individual reporting record’s movement.
The two movements also coexist within individual reporting IDs
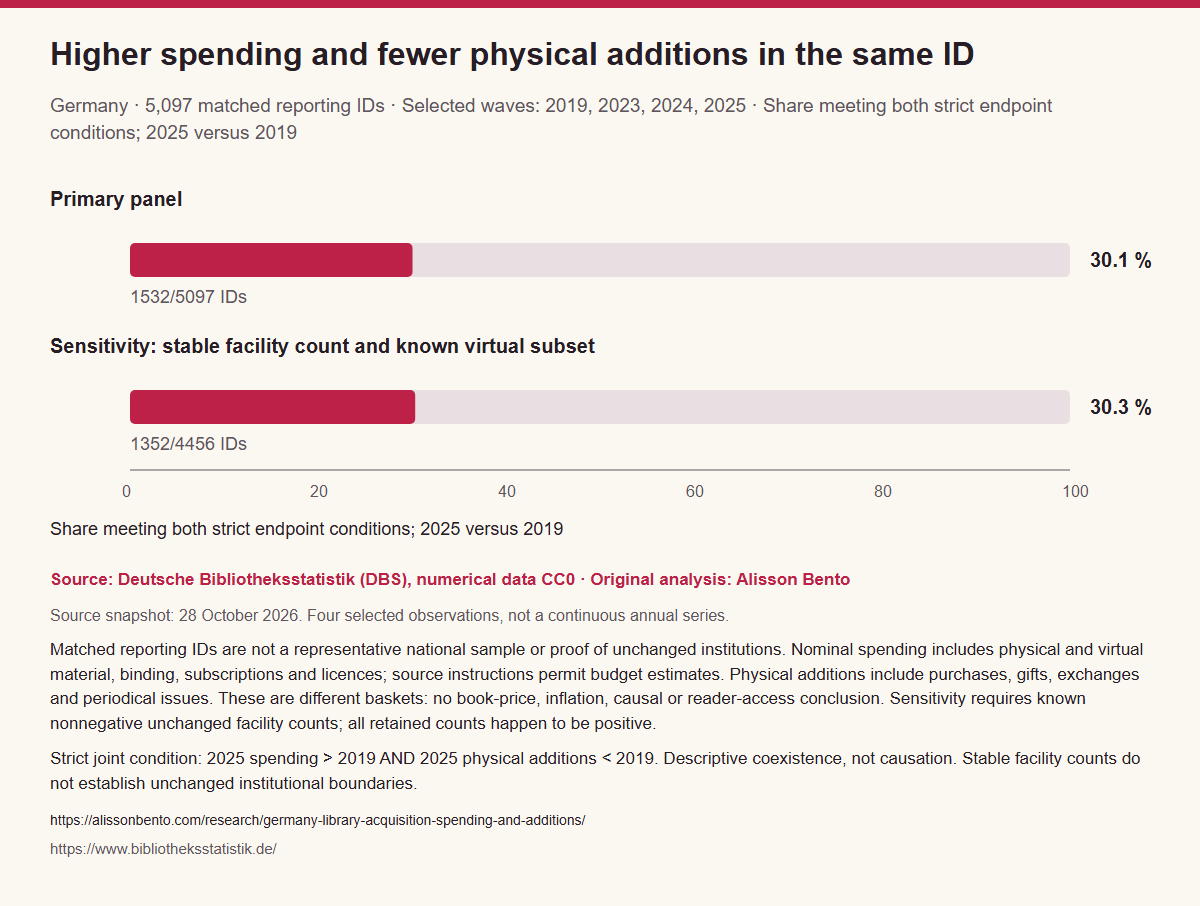
Comparing aggregate totals leaves an important question unanswered: could spending have increased in one set of records while additions fell only in another? The joint calculation addresses that descriptive issue. Exactly 1,532 of the 5,097 matched IDs have both higher expenditure in 2025 than in 2019 and fewer physical additions. Their share is approximately 30.1%, with the full result about 30.0569%.
The conditions are strict inequalities. An ID with unchanged expenditure does not satisfy the higher-expenditure condition; an ID with unchanged additions does not satisfy the lower-additions condition. The calculation compares each ID with its own 2019 baseline before counting how many meet both conditions. It does not infer the joint result from two separate percentages or multiply marginal shares.
This is stronger descriptive evidence of coexistence than two aggregate trends alone, but it is not a causal finding. The count does not identify inflation-affected libraries, unsuccessful procurement or reduced reader access. A stable DBS identifier also does not certify an unchanged institution. The result should travel with its denominator, years, matched-record description and mixed-basket qualification whenever it is quoted or charted.
A summed index and an equal-ID median answer different questions
The expenditure index compares sums, so a reporting ID with a large acquisition total contributes more to the result than one with a small total. The additions index works in the same way for physical units. These summaries describe the combined recorded amounts in the panel. They do not describe the experience of an equally weighted library or give every municipality an equal voice.
The median uses a different operation: calculate the percentage change within each retained ID, then find the middle value across IDs. In 2025, the median expenditure change is approximately +6.4500%, while the median additions change is approximately −11.1111%. Each ID contributes one change to its respective median, regardless of the size of its expenditure or collection.
The two medians must not be joined into a fictional typical library that has both exact changes. They are separate distributional summaries, and the middle expenditure record need not be the middle additions record. Showing both medians alongside the summed indices makes the weighting choice visible. A reader can then choose the summary that matches the question being asked instead of treating the numbers as interchangeable.
What the initial selector includes—and what it cannot establish
The public DBS selector returned 7,200 reporting IDs under its current ordinary-public-library type selection. The acquisition included choices that were not marked currently active. Restricting a historical comparison to today’s active choices would introduce a further current-status filter. Including inactive choices avoids that particular restriction, but it does not remove reporting selection or recover every institution that might once have existed.
The current type selection is a way of locating records in the service, not proof that each selected ID had the same institutional type in every observation year. Likewise, persistence of an identifier does not establish a constant service area, governance structure or institutional boundary. The analysis keeps the reporting-ID terminology because those possibilities cannot be settled from the selected numerical fields.
The initial acquisition contains 28,800 ID-year rows: 7,200 IDs for each of four years. Five acquired fields generate 144,000 field-year cells. Those counts describe the bounded data retrieval, not the final analytic sample. The primary panel is smaller because the planned comparison requires usable primary measures throughout the four selected observations and positive starting values for percentage changes.
How 7,200 selected IDs become 5,097 primary records
Panel selection proceeds through explicit checks. First, 1,998 IDs lack at least one required expenditure or additions value. Three further IDs have an observed virtual-expenditure subset that fails the consistency check against total expenditure. Another 102 have a nonpositive 2019 baseline for a primary measure. After these sequential exclusions, 5,097 IDs remain for the primary matched comparison.
Every included ID has numeric, nonnegative expenditure and additions observations in all four selected years, with positive 2019 expenditure and additions. A positive baseline is required because the planned relative-change calculation divides by the 2019 value. The analysis does not replace a zero baseline with a small positive number, conceal it inside a percentage or add a new outcome-dependent rule.
Where a virtual subset is observed, it must be nonnegative and no greater than total acquisition expenditure. A missing virtual subset does not by itself exclude an otherwise usable ID from the primary panel. It does exclude that ID from the stricter sensitivity panel. No outlier removal was added after the results were seen. Selection reasons remain available with the derived rows so readers can audit the denominator.
A blank, an N and a zero remain different
Across all five acquired fields and four years, the source contains 122,344 numeric cells, 7,650 N cells and 14,006 empty cells. These counts cover the acquisition as a whole; they are not the completeness rate of expenditure and additions alone. They cannot be divided indiscriminately into the primary sample size or treated as the number of excluded institutions.
The recorded source notation distinguishes unavailable information from a numeric zero. Current 2026 guidance explains N as an applicable quantity that cannot be supplied, while zero can indicate absence or non-applicability. Supplemental 2024 guidance corroborates the notation. Empty cells are retained separately rather than assigned a historical explanation that the source does not provide.
This distinction affects every comparison. Replacing missing spending with zero could create an invented increase later; replacing missing additions with zero could create an invented decline. The derivative retains both the value and its controlled status, along with panel flags. A reader can therefore tell whether a row was excluded because information was unavailable, a subset was invalid or a baseline did not support the planned calculation.
Intermediate observations do not form a continuous trend
The primary panel’s expenditure index is 105.559 in 2023, 103.435 in 2024 and 104.136 in 2025, with 2019 set to 100. Spending therefore does not follow a steadily rising path across these selected observations. The corresponding additions indices are 90.589, 88.165 and 85.009. The table preserves each year instead of drawing an uninterrupted annual story from the endpoints.
The unselected years remain unobserved in this analysis. The comparison cannot establish when a divergence began, whether a temporary reversal occurred between selected years or what happened during a particular crisis. It also cannot isolate the effects of the pandemic, inflation, funding decisions or changes in digital provision. Those are possible topics for separately designed research, not explanations produced by these four observations.
A stricter panel checks specific comparability concerns
The sensitivity panel retains 4,456 IDs with a complete known virtual-expenditure subset and the same nonnegative reported facility count in all four years. All retained counts are positive in the actual panel. Its 2025 expenditure index is approximately 104.959 and its physical-additions index approximately 84.926. Within this stricter panel, 1,352 IDs meet the joint higher-expenditure/lower-additions condition, or approximately 30.3411%.
The broad descriptive direction remains similar under these restrictions. That agreement is useful because the stricter panel addresses particular missing-subset and facility-count concerns. It is not proof that selection has no effect or that either panel represents all German libraries. The sensitivity removes some records and therefore changes the population being summarized as well as the requirements imposed on it.
Facility counts are a limited diagnostic. Source guidance indicates that these fields can be maintained through address administration. An unchanged count does not prove that the same buildings remained open, that boundaries stayed fixed or that responsibilities were constant. The restriction should be described exactly, without translating it into a claim of institutionally identical libraries throughout the period.
Subtracting a virtual subset does not create a book-purchase budget
For the sensitivity panel, subtracting the declared virtual-expenditure subset from total acquisition expenditure gives a residual expenditure index of 99.767 in 2025, against 2019 equal to 100. The intermediate residual indices are 101.413 in 2023 and 99.535 in 2024. This calculation makes one part of the spending composition more transparent while retaining the source’s accounting definitions.
The residual still contains a mixed basket. Binding, subscriptions and other included expenditure do not become purchased physical books simply because the declared virtual subset has been removed. The subset itself follows DBS definitions, including specified treatment of inseparable portal costs. The residual is consequently labelled as a subtraction result, rather than renamed a physical-book purchasing budget.
For the same reason, dividing total expenditure—or this residual—by physical additions would not identify a book price. The denominator includes donated units and periodical issues, while the expenditure basket includes costs that do not produce a physical addition. This analysis does not publish that ratio. A genuine price study would need compatible purchased-item quantities and expenditure, together with a defensible treatment of changing composition.
How to use the benchmark in a local discussion
A library manager can begin by comparing the direction of local expenditure and physical additions using the same definitions and years. If the measures diverge, the next step is to inspect licences, subscriptions, donations, binding and changes in reporting scope. The panel provides a transparent reference for that investigation. It does not supply the institution-specific explanation or determine whether a funding decision was appropriate.
An editor can use the joint result to sharpen a question for local reporting: did higher recorded expenditure coexist with fewer physical additions, and what changed inside the baskets? The answer should come from local records and attributable evidence. The national-language label German libraries should not erase the matched-panel denominator, current-type selection or absence of a representative national design.
For a researcher, the useful contribution is the structured derivative: explicit selection flags, retained missing statuses, a common four-wave frame and reproducible sums, medians and joint conditions. DBS already offers annual and multiyear variable evaluations. The value here is the auditable comparison and interpretation, not a claim that the underlying public data were proprietary, newly discovered or never analyzed before.
Administrative completeness is not certainty
No sampling confidence interval is attached to these administrative-record summaries. That is appropriate for the calculation presented, but it does not make the values error-free. Reporting mistakes, incomplete responses, estimated budget figures, changing composition and institutional reorganization can all affect interpretation. The source itself cautions that errors or incomplete values can remain despite checks.
The study does not measure loans, unique readers, satisfaction, collection quality, staffing or opening hours. Fewer physical additions cannot by itself establish reduced reader access, just as higher expenditure cannot establish better service. Digital provision and the quality or suitability of acquisitions require other evidence. A descriptive benchmark is useful precisely when its boundaries remain visible alongside its headline.
Nominal acquisition spending in the matched DBS panel
Germany · 5,097 matched reporting IDs · Selected waves: 2019, 2023, 2024, 2025 · Aggregate index; own 2019 total = 100
Full chart and source

Scroll horizontally to inspect the chart. ↔
Chart and values
Scroll horizontally to see all columns.
| Reporting panel | Matched reporting IDs | Observation year | Nominal acquisition expenditure — EUR | Aggregate expenditure index — own panel 2019 = 100 | Median within-ID expenditure change from 2019 — % | Physical media additions — units | Aggregate additions index — own panel 2019 = 100 | Median within-ID additions change from 2019 — % |
|---|---|---|---|---|---|---|---|---|
| Primary matched panel | 5,097 | 2019 | 104,656,872.17 | 100.000 | 0.0000 | 8,484,346 | 100.000 | 0.0000 |
| Primary matched panel | 5,097 | 2023 | 110,474,585.76 | 105.559 | 3.4129 | 7,685,915 | 90.589 | −10.0503 |
| Primary matched panel | 5,097 | 2024 | 108,252,277.23 | 103.435 | 4.4571 | 7,480,216 | 88.165 | −10.8333 |
| Primary matched panel | 5,097 | 2025 | 108,985,479.34 | 104.136 | 6.4500 | 7,212,487 | 85.009 | −11.1111 |
| Known virtual subset and unchanged facility-count sensitivity | 4,456 | 2019 | 76,573,736.95 | 100.000 | 0.0000 | 6,436,598 | 100.000 | 0.0000 |
| Known virtual subset and unchanged facility-count sensitivity | 4,456 | 2023 | 81,120,183.58 | 105.937 | 3.7740 | 5,793,542 | 90.009 | −9.9162 |
| Known virtual subset and unchanged facility-count sensitivity | 4,456 | 2024 | 80,332,771.41 | 104.909 | 4.7455 | 5,583,420 | 86.745 | −10.8078 |
| Known virtual subset and unchanged facility-count sensitivity | 4,456 | 2025 | 80,371,304.12 | 104.959 | 6.8198 | 5,466,347 | 84.926 | −11.0046 |
Matched DBS reporting IDs, not a representative national sample or proof of unchanged institutions. Four selected observations, not a continuous annual series. Main panel: 5,097 IDs; sensitivity: 4,456 IDs with a known virtual subset and unchanged nonnegative facility count (all retained counts positive). Expenditure is nominal EUR and includes physical and virtual material, binding, subscriptions and licences; source permits budget estimates. Physical additions include gifts and periodical issues, not only purchased books. Each index uses its own panel and measure’s 2019 sum = 100; separate ID medians give every ID equal weight. Mixed baskets do not identify a book price or cause.

Physical media additions in the same matched panel
Germany · 5,097 matched reporting IDs · Selected waves: 2019, 2023, 2024, 2025 · Aggregate index; own 2019 total = 100
Full chart and source

Scroll horizontally to inspect the chart. ↔
Chart and values
Scroll horizontally to see all columns.
| Reporting panel | Matched reporting IDs | Observation year | Nominal acquisition expenditure — EUR | Aggregate expenditure index — own panel 2019 = 100 | Median within-ID expenditure change from 2019 — % | Physical media additions — units | Aggregate additions index — own panel 2019 = 100 | Median within-ID additions change from 2019 — % |
|---|---|---|---|---|---|---|---|---|
| Primary matched panel | 5,097 | 2019 | 104,656,872.17 | 100.000 | 0.0000 | 8,484,346 | 100.000 | 0.0000 |
| Primary matched panel | 5,097 | 2023 | 110,474,585.76 | 105.559 | 3.4129 | 7,685,915 | 90.589 | −10.0503 |
| Primary matched panel | 5,097 | 2024 | 108,252,277.23 | 103.435 | 4.4571 | 7,480,216 | 88.165 | −10.8333 |
| Primary matched panel | 5,097 | 2025 | 108,985,479.34 | 104.136 | 6.4500 | 7,212,487 | 85.009 | −11.1111 |
| Known virtual subset and unchanged facility-count sensitivity | 4,456 | 2019 | 76,573,736.95 | 100.000 | 0.0000 | 6,436,598 | 100.000 | 0.0000 |
| Known virtual subset and unchanged facility-count sensitivity | 4,456 | 2023 | 81,120,183.58 | 105.937 | 3.7740 | 5,793,542 | 90.009 | −9.9162 |
| Known virtual subset and unchanged facility-count sensitivity | 4,456 | 2024 | 80,332,771.41 | 104.909 | 4.7455 | 5,583,420 | 86.745 | −10.8078 |
| Known virtual subset and unchanged facility-count sensitivity | 4,456 | 2025 | 80,371,304.12 | 104.959 | 6.8198 | 5,466,347 | 84.926 | −11.0046 |
Matched DBS reporting IDs, not a representative national sample or proof of unchanged institutions. Four selected observations, not a continuous annual series. Main panel: 5,097 IDs; sensitivity: 4,456 IDs with a known virtual subset and unchanged nonnegative facility count (all retained counts positive). Expenditure is nominal EUR and includes physical and virtual material, binding, subscriptions and licences; source permits budget estimates. Physical additions include gifts and periodical issues, not only purchased books. Each index uses its own panel and measure’s 2019 sum = 100; separate ID medians give every ID equal weight. Mixed baskets do not identify a book price or cause.

Higher spending and fewer physical additions in the same ID
Germany · 5,097 matched reporting IDs · Selected waves: 2019, 2023, 2024, 2025 · Share meeting both strict endpoint conditions; 2025 versus 2019
Full chart and source

Scroll horizontally to inspect the chart. ↔
Chart and values
Scroll horizontally to see all columns.
| Reporting panel | Matched reporting IDs | IDs with higher expenditure AND fewer physical additions, 2025 versus 2019 | Share of matched IDs meeting both strict conditions — % |
|---|---|---|---|
| Primary matched panel | 5,097 | 1,532 | 30.0569 |
| Known virtual subset and unchanged facility-count sensitivity | 4,456 | 1,352 | 30.3411 |
Strict joint condition within the same reporting ID: acquisition expenditure in 2025 exceeds 2019 AND physical additions in 2025 are below 2019. Primary: 1,532/5,097; sensitivity: 1,352/4,456. Descriptive coexistence, not an inflation or causal estimate. Unchanged facility count does not prove unchanged institutional boundaries. Nominal expenditure can include digital licences and budget estimates; physical additions include nonpurchase routes. Source snapshot: 28 October 2026.
Data & downloads
Scroll horizontally to see all columns.
| Reporting panel | Matched reporting IDs | Observation year | Nominal acquisition expenditure — EUR | Aggregate expenditure index — own panel 2019 = 100 | Median within-ID expenditure change from 2019 — % | Physical media additions — units | Aggregate additions index — own panel 2019 = 100 | Median within-ID additions change from 2019 — % |
|---|---|---|---|---|---|---|---|---|
| Primary matched panel | 5,097 | 2019 | 104,656,872.17 | 100.000 | 0.0000 | 8,484,346 | 100.000 | 0.0000 |
| Primary matched panel | 5,097 | 2023 | 110,474,585.76 | 105.559 | 3.4129 | 7,685,915 | 90.589 | −10.0503 |
| Primary matched panel | 5,097 | 2024 | 108,252,277.23 | 103.435 | 4.4571 | 7,480,216 | 88.165 | −10.8333 |
| Primary matched panel | 5,097 | 2025 | 108,985,479.34 | 104.136 | 6.4500 | 7,212,487 | 85.009 | −11.1111 |
| Known virtual subset and unchanged facility-count sensitivity | 4,456 | 2019 | 76,573,736.95 | 100.000 | 0.0000 | 6,436,598 | 100.000 | 0.0000 |
| Known virtual subset and unchanged facility-count sensitivity | 4,456 | 2023 | 81,120,183.58 | 105.937 | 3.7740 | 5,793,542 | 90.009 | −9.9162 |
| Known virtual subset and unchanged facility-count sensitivity | 4,456 | 2024 | 80,332,771.41 | 104.909 | 4.7455 | 5,583,420 | 86.745 | −10.8078 |
| Known virtual subset and unchanged facility-count sensitivity | 4,456 | 2025 | 80,371,304.12 | 104.959 | 6.8198 | 5,466,347 | 84.926 | −11.0046 |
Matched DBS reporting IDs, not a representative national sample or proof of unchanged institutions. Four selected observations, not a continuous annual series. Main panel: 5,097 IDs; sensitivity: 4,456 IDs with a known virtual subset and unchanged nonnegative facility count (all retained counts positive). Expenditure is nominal EUR and includes physical and virtual material, binding, subscriptions and licences; source permits budget estimates. Physical additions include gifts and periodical issues, not only purchased books. Each index uses its own panel and measure’s 2019 sum = 100; separate ID medians give every ID equal weight. Mixed baskets do not identify a book price or cause.
Scroll horizontally to see all columns.
| Reporting panel | Matched reporting IDs | IDs with higher expenditure AND fewer physical additions, 2025 versus 2019 | Share of matched IDs meeting both strict conditions — % |
|---|---|---|---|
| Primary matched panel | 5,097 | 1,532 | 30.0569 |
| Known virtual subset and unchanged facility-count sensitivity | 4,456 | 1,352 | 30.3411 |
Strict joint condition within the same reporting ID: acquisition expenditure in 2025 exceeds 2019 AND physical additions in 2025 are below 2019. Primary: 1,532/5,097; sensitivity: 1,352/4,456. Descriptive coexistence, not an inflation or causal estimate. Unchanged facility count does not prove unchanged institutional boundaries. Nominal expenditure can include digital licences and budget estimates; physical additions include nonpurchase routes. Source snapshot: 28 October 2026.
Evidence & method
How we calculated it
- Freeze the public DBS variable-evaluation selection and source export captured on 28 October 2026 at 23:54:08 UTC. The selection uses the current ordinary-public-library type and includes inactive choices; the source observations are 2019, 2023, 2024 and 2025.
- Check source fingerprints before parsing. Preserve German numeric punctuation through explicit conversion, use decimal arithmetic for expenditure and retain raw missing-status distinctions. The public derivative contains 28,800 ID-year rows and omits institutional names, addresses and contact fields.
- Apply the planned four-wave numeric/nonnegative primary requirements, positive 2019 baselines and validity checks on observed virtual subsets. Record sequential exclusions and do not remove outliers after observing the results.
- Calculate aggregate indices from panel sums with 2019 equal to 100. Separately calculate within-ID percentage changes and their equal-ID medians. Count the joint endpoint condition using strict higher-expenditure and lower-additions inequalities within the same ID.
- Repeat the specified summaries for the 4,456-ID sensitivity panel with a complete virtual subset and unchanged nonnegative facility count (all retained counts are positive). Label total-minus-virtual expenditure as a mixed residual. Do not convert it into physical-book spending or a unit price.
- Use the historical DBS category dictionaries, the 2024/2025 concordance and selected-year official currency guidance together. Report nominal euros, physical media units and source-permitted budget estimates accurately. Preserve the distinction between observation years, retrieval and publication.
What the data cannot tell us
- The complete-case reporting panel is not a representative sample of all German libraries. Current type selection and a persistent DBS ID do not establish historical type or unchanged institutional boundaries.
- Acquisition expenditure and physical additions cover different baskets. Digital licences, binding and subscriptions can enter expenditure; gifts and periodical issues can enter physical additions. No inflation, book-price or causal effect is estimated.
- Reported finance values can include budget estimates when actual expenditure is not yet available. A source check or exact reproduction does not validate every original report.
- The four selected years are not a continuous annual series. No claim is made about 2026 conditions, changes in omitted years, efficiency or reader access.
- The stable-facility sensitivity is limited: counts can be maintained through address administration and do not prove constant buildings, boundaries or responsibilities. Absence of a sampling interval does not remove measurement and selection uncertainty.
Original sources
- DBS public variable evaluation
Deutsche Bibliotheksstatistik (DBS), Variable Auswertung: public reporting-ID export captured 28 October 2026 at 23:54:08 UTC; observations 2019, 2023, 2024 and 2025. https://www.bibliotheksstatistik.de/
Accessed October 28, 2026
- DBS 2019 historical definitions
DBS 2019 historical definitions: questions 36 (physical media additions), 50 (acquisition expenditure) and 50.1 (virtual subset), including mixed baskets and permitted budget estimates. https://www.bibliotheksstatistik.de/konkordanz?art=bix&jahr=2019&fb=OEB
Accessed October 28, 2026
- DBS 2023 historical definitions
DBS 2023 historical definitions: comparison definitions for the selected fields; physical additions are not assumed to be purchased books. https://www.bibliotheksstatistik.de/konkordanz?art=bix&jahr=2023&fb=OEB
Accessed October 28, 2026
- DBS 2024–2025 concordance
DBS 2024–2025 concordance: selected-year category concordance; facility counts can be maintained in address administration and do not establish stable institutional boundaries. https://www.bibliotheksstatistik.de/konkordanzvj?art=bix&jahr=2025&fb=OEB
Accessed October 28, 2026
- DBS official variable-evaluation manual
Official DBS manual: annual and multi-year variable evaluations; source data are reusable under CC0. Original analysis and presentation: Alisson Bento. No endorsement is implied. https://service-wiki.hbz-nrw.de/spaces/DBS/pages/366477482/Anleitung+Variable+Auswertung
Accessed October 28, 2026
- Official Baden-Württemberg DBS 2024 instructions
Official Baden-Württemberg DBS 2024 instructions, pages 2 and 8: currency entries in euros (partly with decimal places), permitted budget estimates for total expenditure and accounting definitions. https://rp.baden-wuerttemberg.de/fileadmin/RP-Internet/Tuebingen/Abteilung_2/Referat_23/Fachstelle_Bibliothekswesen/Fachinformationen/_DocumentLibraries/Documents/DBS_2024_Erlaeuterungen_Grundfragebogen.pdf
Accessed October 29, 2026
- DBS 2026 questionnaire: notation reference
The current DBS 2026 questionnaire distinguishes N for an applicable but unavailable quantity from zero for absence or non-applicability. Empty cells remain distinct; this guidance does not establish a historical cause for missing cells. https://service-wiki.hbz-nrw.de/download/attachments/87916549/%C3%96B_Fragebogen_BJ-2026.pdf?version=2&modificationDate=1790681146417&api=v2
Accessed October 28, 2026
Cite & reuse this study
Alisson Bento. German library acquisition spending and physical additions: a matched reporting panel. DBS observations 2019, 2023, 2024 and 2025; numeric source snapshot 28 October 2026. https://alissonbento.com/research/germany-library-acquisition-spending-and-additions/
Source DBS data are released under CC0. Original analysis, derived tables, charts and code by Alisson Bento are reusable with attribution to author and source and a statement of changes. This does not place the source website, manuals, PDFs or third-party material under the same terms or imply endorsement. Public derivatives omit institutional names, addresses and contact fields. Preserve the matched-reporting-ID denominator, observation years, nominal units, missing statuses and mixed-basket limitations.
Corrections or editorial questions