
A purchase is only one route into the last book
Among Italian leisure readers aged 35–44, the nine explicitly purchased acquisition categories in Istat’s 2024 survey add to 56.3%. Among readers aged 75 or older, they add to 36.8%. The difference is 19.5 percentage points. It describes the reported origin of the most recently read leisure book, not the share of all books sold, the proportion of people who ever buy books, or the value of purchases over a year. The question gives every eligible reader one answer about one last-read book, regardless of how many books that person reads.
That distinction makes acquisition an informative subject in its own right. A reading experience can begin with a personal purchase, a gift, a loan, a download or a book already available at home. A reader arriving through one of those routes may still make purchases on other occasions. Likewise, a book received from someone else may originally have been bought. The observed route into a particular reading experience should not be stretched into a complete account of the commercial or social life of that book.
This analysis compares the published adult age bands while retaining the complete source categories in the downloadable data. The highlighted age contrast was selected after inspecting the table and is exploratory. It is not a preregistered hypothesis test, and no statistical significance is claimed. The purpose is to describe how acquisition profiles differ without turning those differences into an explanation of why they arise.
Who is represented, and when
The underlying table covers leisure readers aged six and older in resident private households in Italy. The adult comparison here begins at ages 18–19; the source’s younger groups are retained in the analytical CSV but do not enter an adult headline. Istat defines leisure reading to include printed books, digital books and audiobooks read for reasons other than professional or school requirements. It also includes the relevant online reading-and-commenting activity. People who read for both leisure and professional or school reasons remain eligible; those who read only for professional or school purposes are not the denominator for this acquisition table.
The survey was conducted between May and September 2024. Its leisure-reading question refers to the preceding twelve months, rather than to the fixed calendar year alone. The acquisition item then asks about the last book read for non-strictly school or professional reasons. It does not impose a separate date restriction on when that book was obtained. Consequently, these results must not be described as purchases made during 2024, or even necessarily as acquisitions made during the preceding twelve months.
The survey excludes residents of collective institutions. Its household design also means that the population is not simply everyone who lives in Italy under every residential arrangement. The overall survey response totals are useful background, but they are not the number of respondents in any individual age band. Published weighted population estimates and actual sample counts answer different questions and are kept separate throughout this analysis.
What the questionnaire actually asks
Question 19.11 on page 25 of the official self-completion questionnaire asks how the respondent came into possession of the last leisure-read book. It explicitly permits one answer. This matters because a sum of selected categories can be interpreted as a combined reported share rather than as an overlapping count of several answers from the same person. The fifteen acquisition codes distinguish existing household availability, several purchase locations, borrowing, gifts, free Internet downloading and an unspecified other route.
On the same page, question 19.12 asks how people generally choose books to read and permits multiple answers. That is a discovery question, not the acquisition question examined here. A recommendation might precede a purchase, a gift or a loan, but this table does not connect an individual recommendation with an individual acquisition. It therefore cannot establish that word of mouth or social media caused a particular route into reading, nor can it rank the effectiveness of promotional channels.
The questionnaire also contains an important location qualification that the abbreviated table labels can obscure. Purchases inside shopping centres form their own category, including purchases from bookshops located there. The following six store or sales-channel categories are explicitly outside shopping centres. A bookshop percentage from those later categories is therefore not a comprehensive percentage for every bookshop purchase. Restoring that qualification avoids treating partly different retail classifications as if they were interchangeable.
Building the purchase-route summary
The combined purchase measure adds nine categories: buying with a newspaper or periodical; buying on the Internet; buying within a shopping centre; and the six subsequent categories covering bookshops, newsstands, stationery shops or combined stationery-bookshops, stalls or fairs or public-square sales, mail order or installment sales, and supermarkets or hypermarkets or post offices. Those six subsequent categories retain the questionnaire’s outside-shopping-centre qualification. This is a transparent regrouping of published percentages, not a new survey variable estimated from individual records.
For ages 35–44, the sum is 56.3%. For ages 75 and older, it is 36.8%. Subtracting the latter from the former yields 19.5 percentage points. Both rows contain numeric values in every source category, so the highlighted calculation does not require interpreting a dash as zero. The percentages are rounded in the source, however, and the regrouped result inherits that rounding. Reporting many decimal places would create an impression of precision that the inputs do not support.
The remaining reported categories sum to 42.1% and 60.7%, respectively. They should be called other reported acquisition routes, not a verified non-purchase share. The unspecified other category could conceal circumstances that the published table cannot identify, and a book already at home may have been purchased earlier. A clean binary label such as bought versus never bought would therefore be more definite than the underlying evidence.
The pattern across all adult age bands
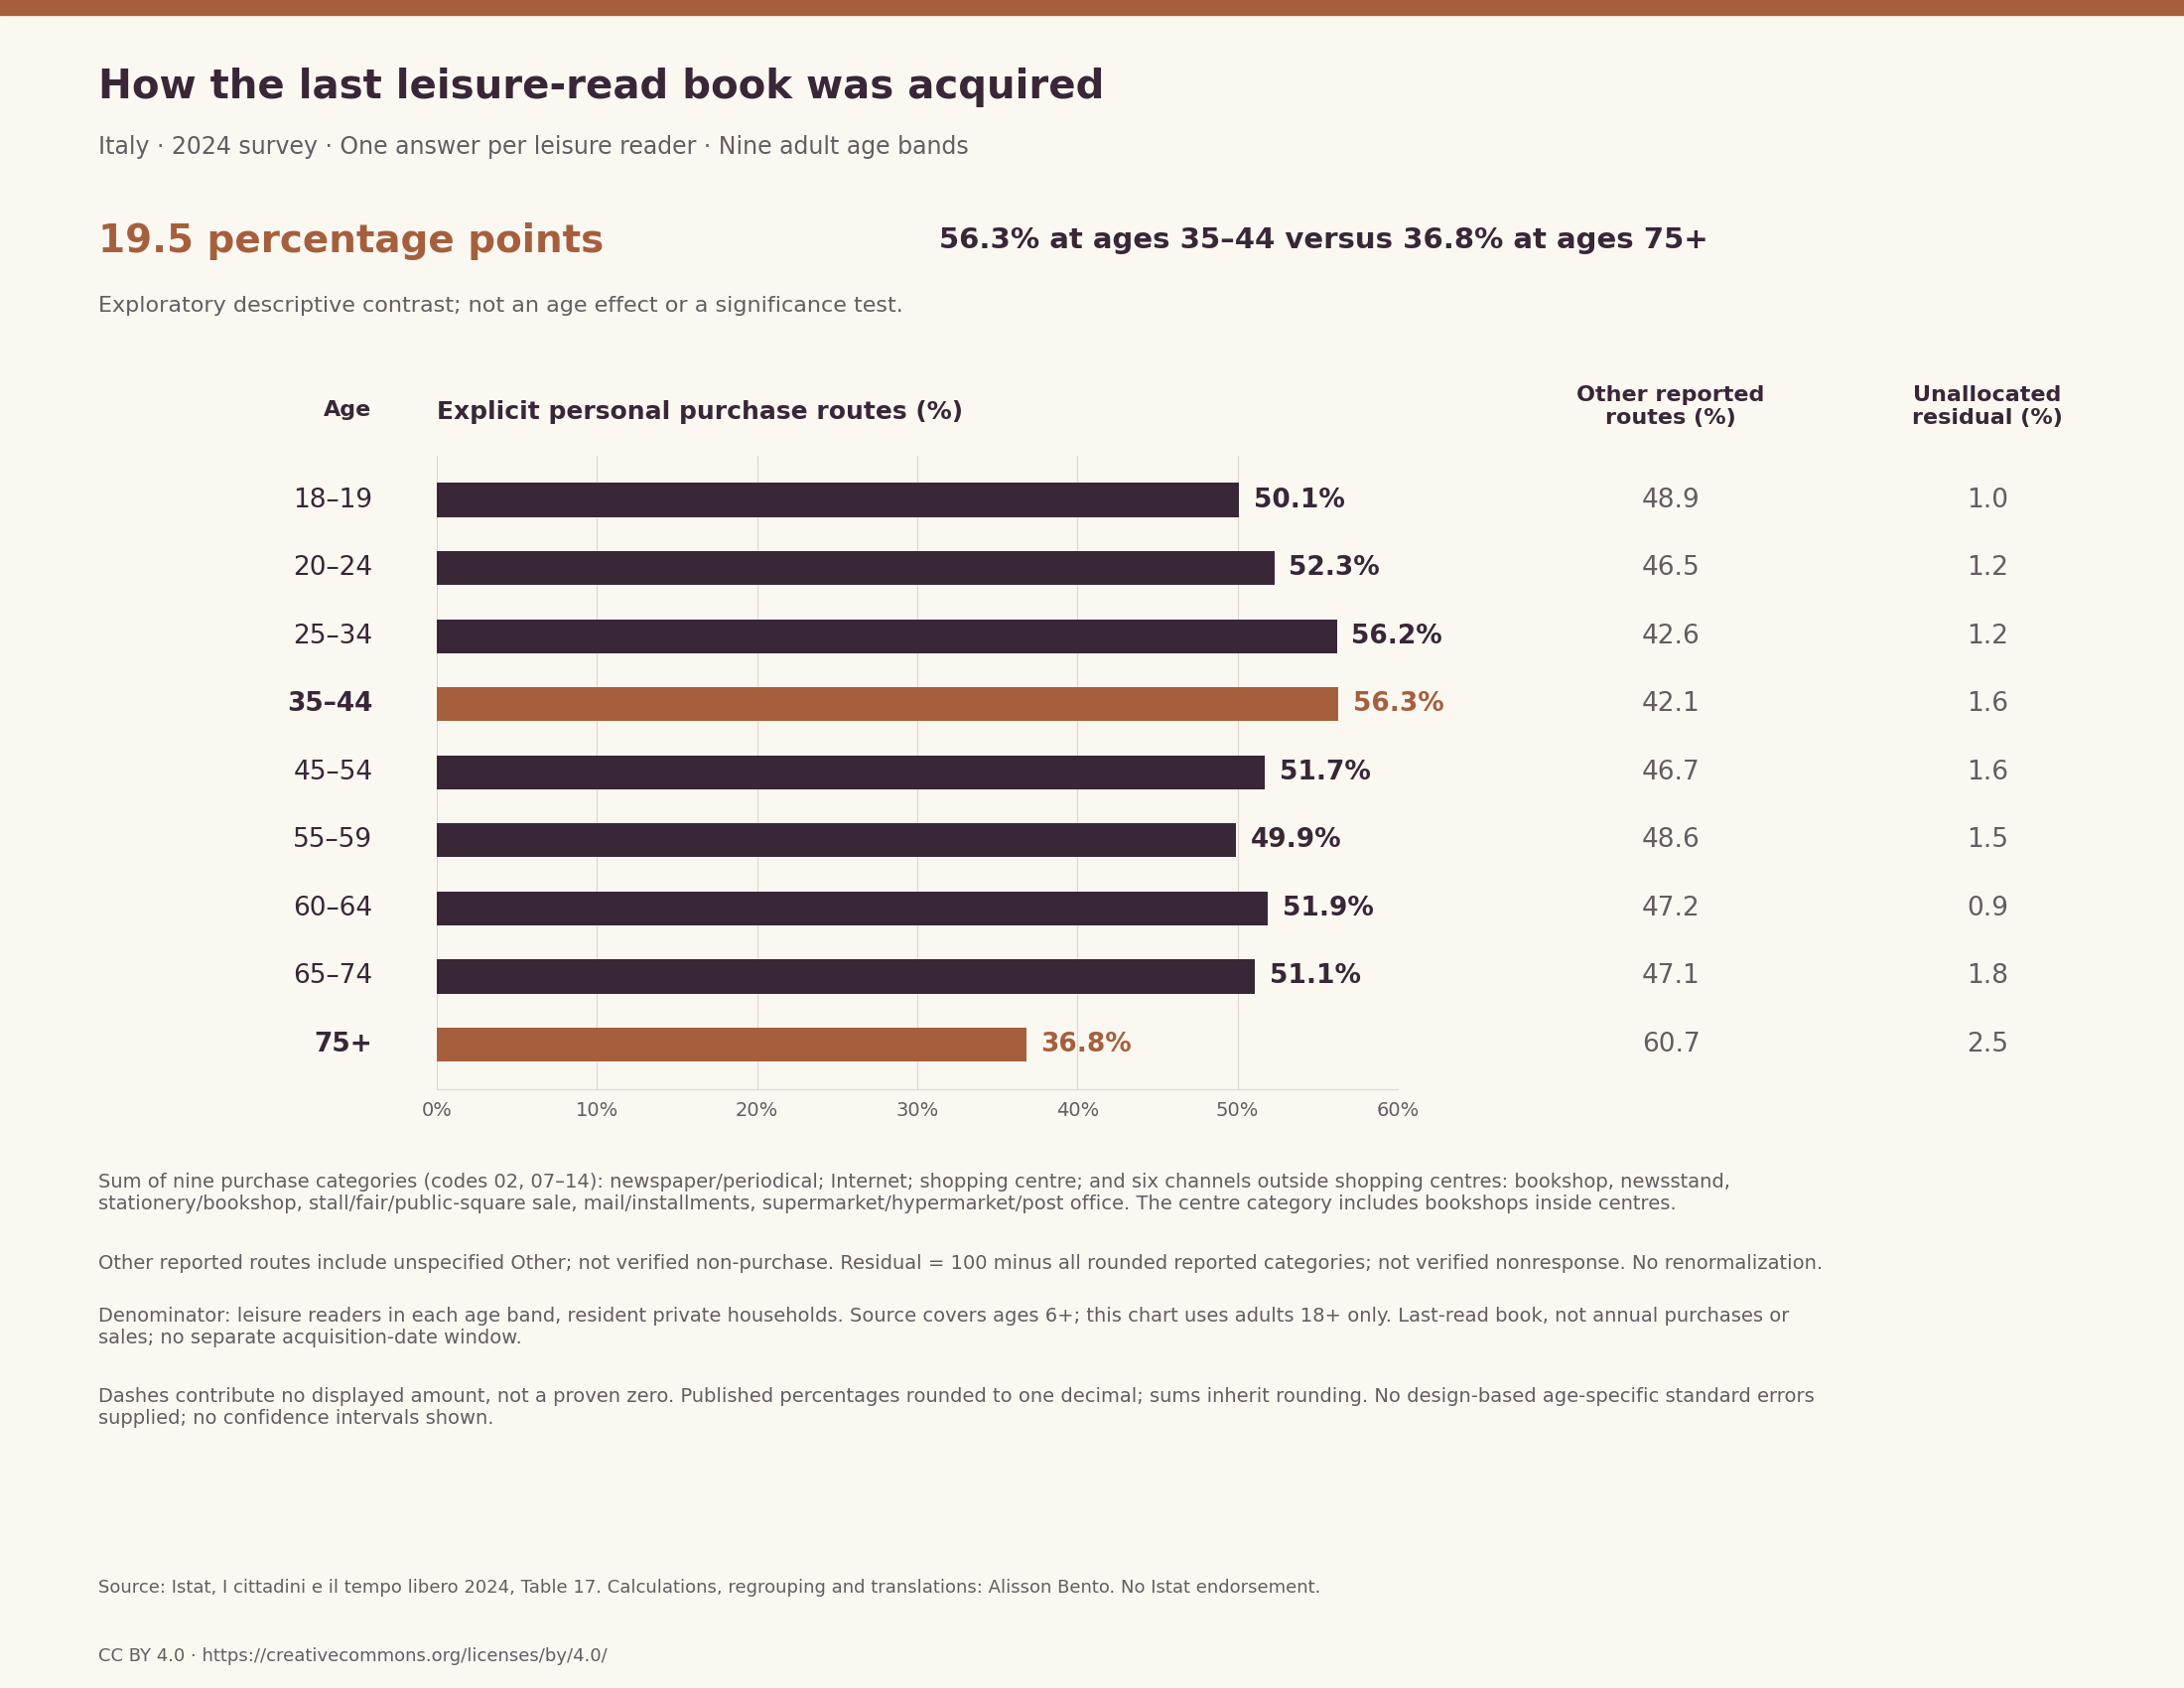
The adult age profile is not a simple straight line. Explicit purchase routes sum to 50.1% at ages 18–19, 52.3% at 20–24, 56.2% at 25–34 and 56.3% at 35–44. They then total 51.7% at 45–54, 49.9% at 55–59, 51.9% at 60–64, 51.1% at 65–74 and 36.8% at 75 and older. These are separately published age groups, not equal-width intervals, and the final group is open-ended.
The middle adult bands consequently do not support a claim that the purchase share falls steadily with each successive age category. Several nearby differences are small, and the published aggregate materials do not supply the item-specific variance information needed to decide whether those differences exceed sampling uncertainty. The useful descriptive contrast is a profile with variation across bands, rather than an asserted universal progression from younger to older readers.
An adult total must not be formed by taking the ordinary mean of these percentages. The groups contain different numbers of leisure readers, and the source estimates are survey-weighted. This analysis leaves every adult band separate instead of inventing an equally weighted adult population. It also preserves the original source total, clearly marked as covering readers aged six and older, so that a national all-ages result cannot accidentally acquire an adult label during editing or translation.
Internet and bookshop purchases tell different parts of the story
Internet purchase accounts for 18.9% of last-book acquisition among leisure readers aged 35–44 and 4.5% among those aged 75 and older. The difference is 14.4 percentage points. Purchases in bookshops outside shopping centres account for 20.9% and 14.7%, respectively, a difference of 6.2 percentage points. The latter excludes bookshops located inside shopping centres, whose purchases belong in the separate centre category. These channel-specific comparisons help explain the arithmetic of the combined purchase measure without claiming to explain the behaviour behind it.
The Internet category is a purchase channel, not a format classification. An online purchase can involve a printed book, and the table does not provide a cross-tabulation linking acquisition channel to print, digital or audio format. Conversely, a free Internet download belongs to a separate acquisition response. Combining those two Internet categories would answer a different question and would blur the distinction between reported purchase and reported free access.
Neither channel share measures retail revenue, transactions per customer, the number of books acquired, or the market share of a retailer. Each describes the last leisure-read book reported by a reader in the relevant group. A frequent reader and an occasional reader each contribute one last-book response to the survey measure, subject to the survey’s weighting. The indicator is consequently useful for studying reading access, but it is not a substitute for a sales dataset.
Gifts, borrowing and books already at home
Gifts account for 12.8% of last-book acquisition at ages 35–44 and 20.9% at ages 75 and older. The older group’s reported share is 8.1 percentage points higher. Books already at home represent 13.5% and 20.5%, respectively. Library borrowing represents 3.7% and 7.4%. These categories describe distinct arrangements and should remain visible rather than being collapsed into a single story about free reading. Even when there is no payment at the moment of acquisition, the table says nothing about previous expenditure or the costs borne by other people and institutions.
For example, receiving a book as a gift does not establish whether the giver purchased it recently, owned it previously or obtained it in another way. Borrowing from a library does not identify the library’s acquisition budget, collection age, lending format or service costs. Having a book at home does not reveal who first acquired it, how long it has been there or whether it has been read before. Those possibilities are not mistakes in the questionnaire; they are questions outside its narrow purpose.
Free Internet downloading also cannot be interpreted as piracy. The response does not distinguish lawful public-domain texts, authorized free distributions or other circumstances. Assigning a legal status or a moral interpretation to that response would add information the survey did not collect. The responsible conclusion is simply that respondents identified different routes into their latest reading experience.
Why the categories do not add to one hundred
The fifteen published percentages do not sum to exactly 100 in these rows. For ages 35–44, the combined purchase and other reported routes total 98.4%, leaving 1.6 percentage points. For ages 75 and older, they total 97.5%, leaving 2.5 points. The analysis retains those amounts as an unallocated residual calculated from rounded published categories. It does not distribute the residual proportionally, assign it to purchases, or hide it by rescaling the observed routes to a total of 100.
The table does not provide a dedicated item-nonresponse column or an item-specific explanation that would justify calling the full residual refusal, missing response or an additional acquisition route. Rounding contributes uncertainty, but it should not be used as an automatic explanation for every shortfall either. Keeping the residual visibly separate makes the calculation auditable while avoiding a diagnosis that the available documentation cannot substantiate.
Some other source rows contain dashes. These symbols are preserved in the complete CSV instead of being silently replaced with numerical observations. In exploratory sums of displayed categories, they contribute no displayed amount, but that convention does not assert an exact zero in the population. The primary comparison avoids this complication because neither highlighted row contains a dash. Original labels, source cell addresses and rounded population counts are also retained, allowing another analyst to inspect the source structure rather than relying only on the headline.
Sampling uncertainty and the limits of an age contrast
Istat’s survey uses a stratified, two-stage design with municipalities and households, followed by corrections for total nonresponse and calibration weighting. Approximately 16,950 households and nearly 38,000 individuals responded to the overall survey, with a reported response rate of 71.84%. Those figures describe the complete survey operation; they must not be inserted as the sample size of the leisure-reading acquisition item or any age-specific subgroup. The survey’s weighted percentages estimate population patterns rather than merely reporting raw sample fractions.
The methodological note gives broad approximations to relative sampling error for population-count estimates by territorial domain. It does not supply the item-and-age-specific ratio variances and covariances required for confidence intervals around this combined purchase measure or the difference between two age groups. Treating the published percentages as if they came from a simple random sample with the full survey count would ignore both the actual eligible sample and the survey design. Accordingly, no p-values, confidence intervals or statistical-significance assertions are reported here.
The comparison is cross-sectional. Differences between age groups may reflect cohort composition, reading habits, resources, household circumstances or other characteristics, but none of those mechanisms is identified by this table. It cannot show what happens when the same individuals become older, and it cannot establish an effect of age itself. The defensible finding is narrower: the published acquisition distributions differ across the observed groups.
Reproduction, reuse and the practical conclusion
The downloadable analytical data preserve all fifteen routes for each original age and sex group, together with the source worksheet cell and the published count in thousands. A separate summary lists the adult comparisons alongside clearly marked non-adult and all-age rows. The public reproduction script recalculates the regrouped percentages from those transparent inputs. It does not require an account, private records or an undisclosed statistical model. Official source links permit readers to retrieve the workbook and questionnaire independently, while the analytical files avoid republishing an unnecessary raw archive.
Percentages are retained at the source’s one-decimal precision. Nine individually rounded purchase percentages can accumulate roughly 0.45 percentage points of rounding uncertainty in a sum, and a difference between two such sums can accumulate roughly 0.9 points. These are rounding considerations, not confidence intervals. Counts rounded to thousands will not necessarily reproduce the printed percentages exactly. Independent checking of the workbook cells and a separate computation of the highlighted sum confirm the arithmetic without eliminating these measurement limitations.
Istat’s default reuse terms are Creative Commons Attribution 4.0 unless otherwise specified. Attribution, a licence link and disclosure of changes are therefore supplied; selection, regrouping and translation are changes, not an endorsement by Istat. The practical conclusion is that reading reaches people through several acquisition routes whose mix varies across adult age bands. Recognizing that diversity improves the description of reading access without turning a last-book snapshot into an estimate of sales, affordability, publisher demand or the causes of reading behaviour.
How the last leisure-read book was acquired
Italy · 2024 survey · One answer per leisure reader · Nine adult age bands. 56.3% at ages 35–44 versus 36.8% at ages 75+
Full chart and source
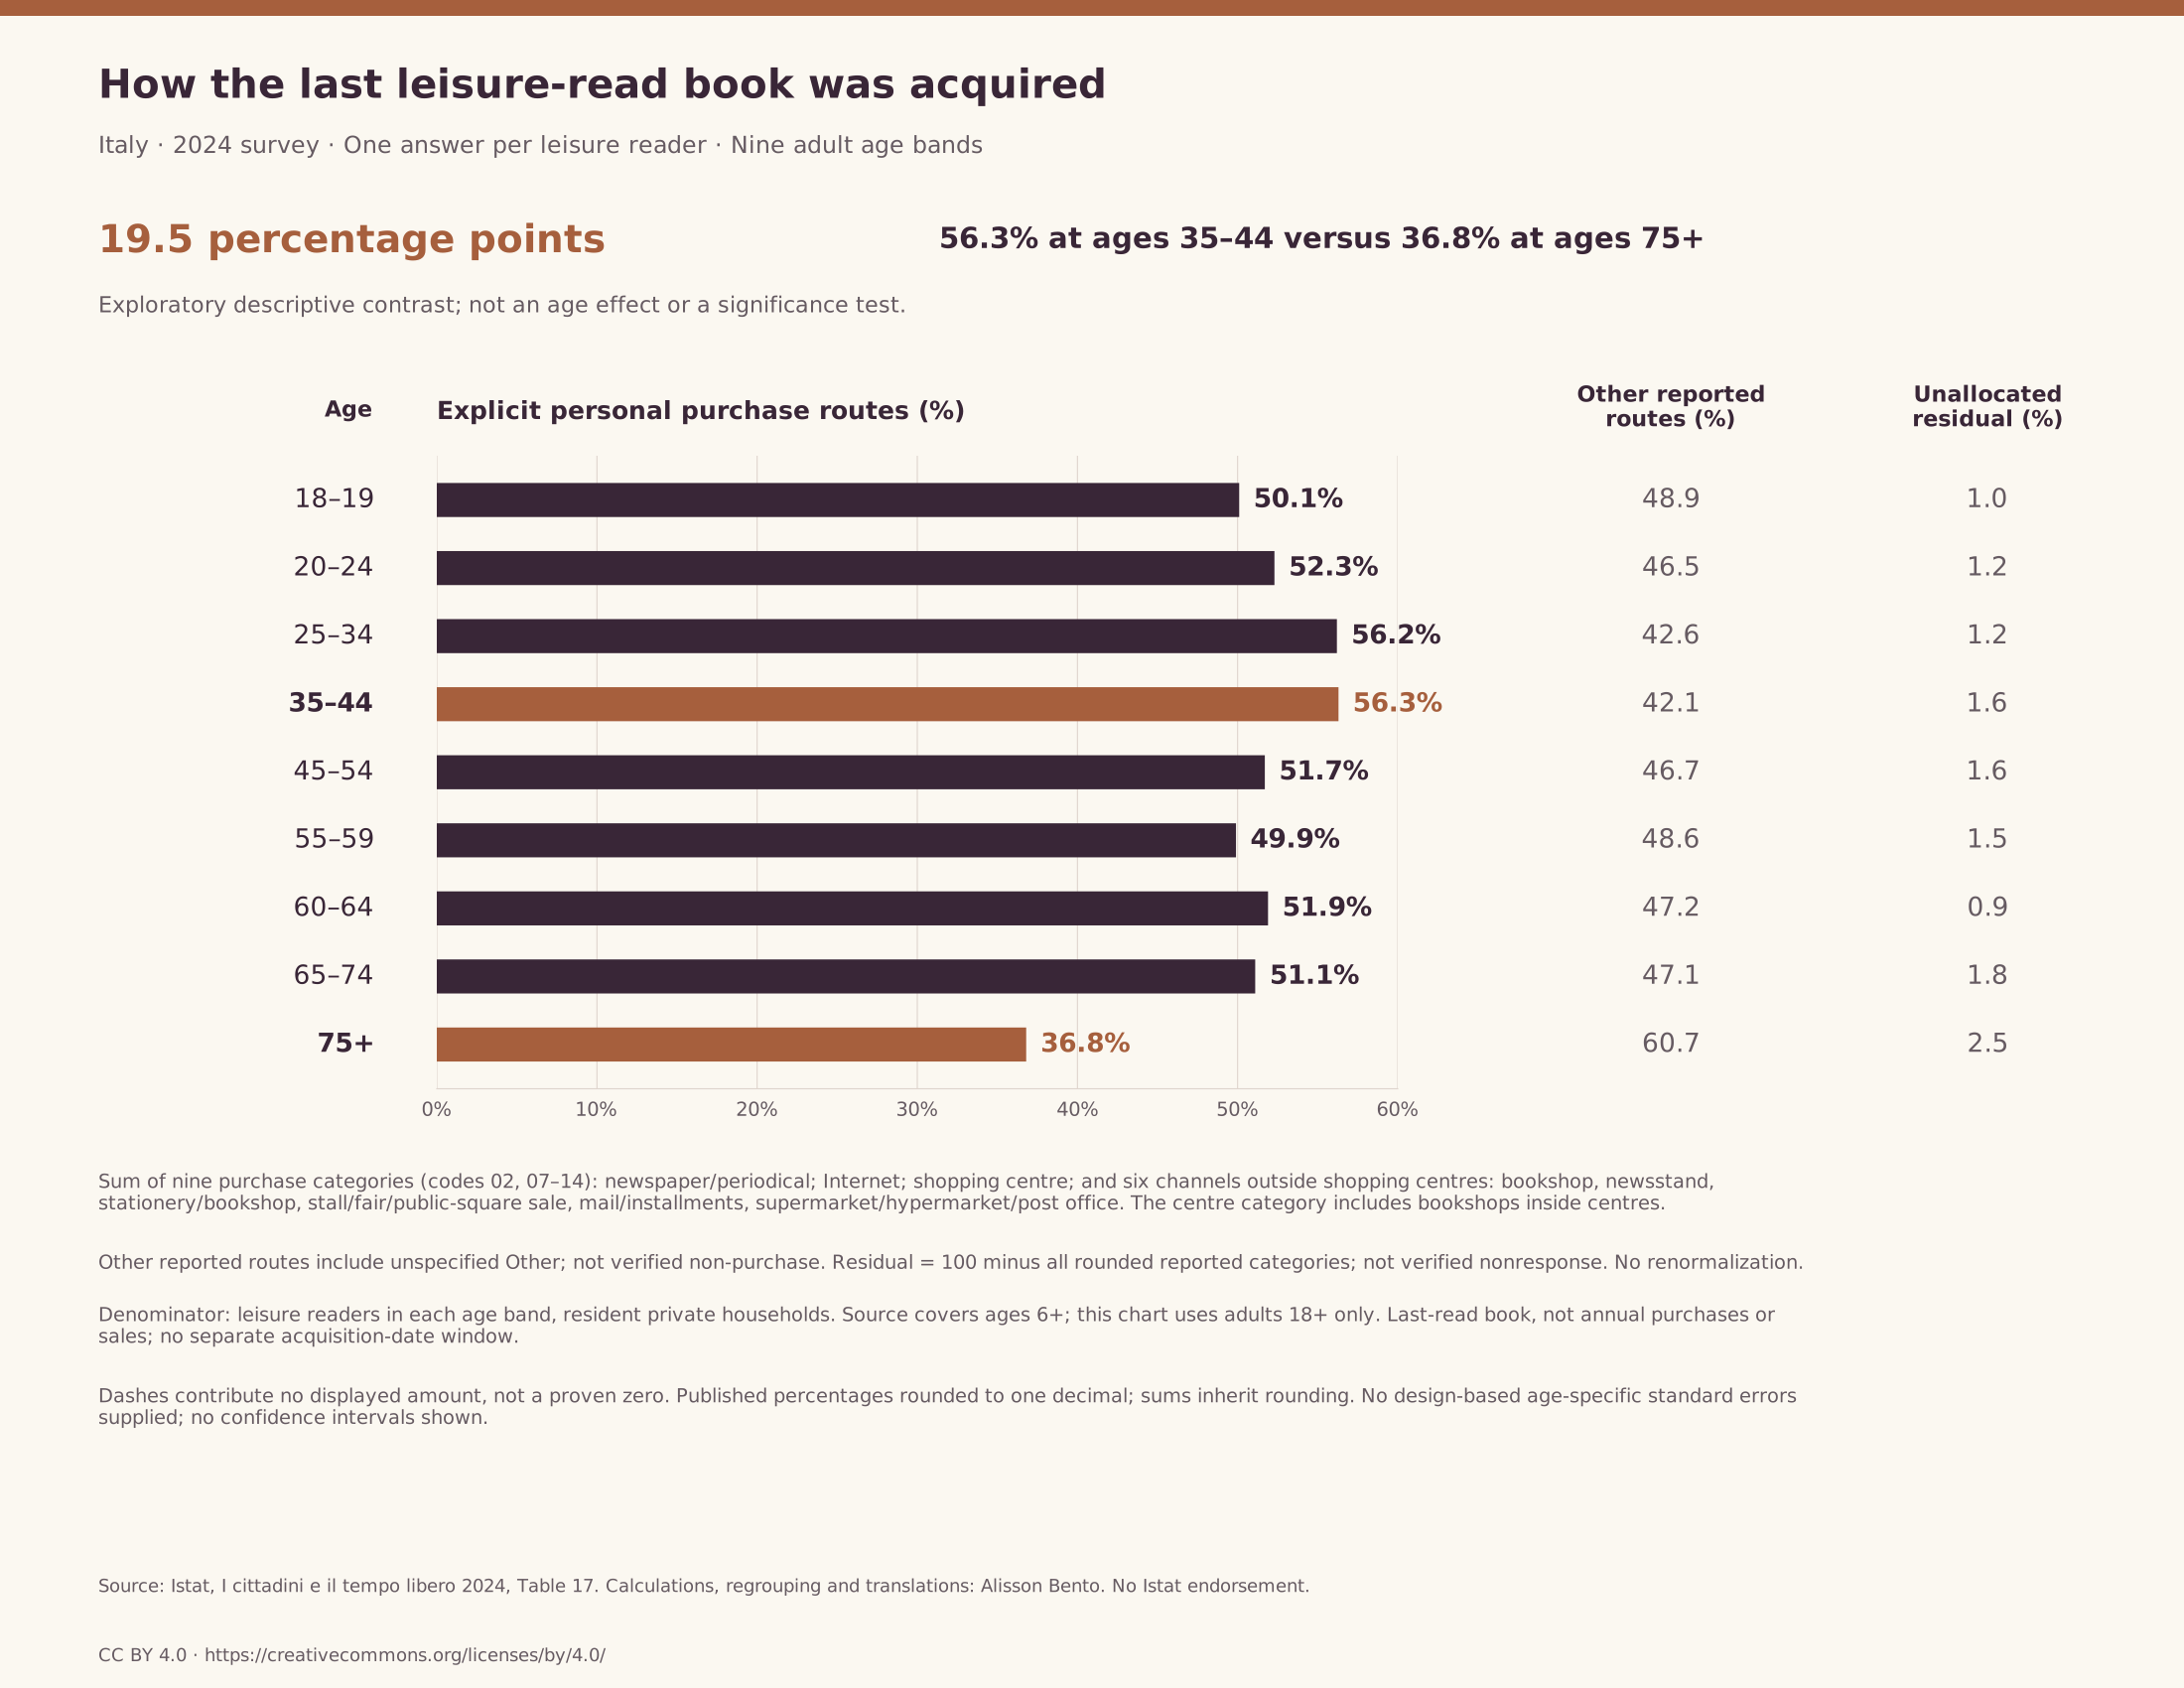
Scroll horizontally to inspect the chart. ↔
Chart and values
Scroll horizontally to see all columns.
| Age | Purchase routes (%) | Other reported routes (%) | Residual (%) |
|---|---|---|---|
| 18 - 19 | 50.1 | 48.9 | 1.0 |
| 20 - 24 | 52.3 | 46.5 | 1.2 |
| 25 - 34 | 56.2 | 42.6 | 1.2 |
| 35 - 44 | 56.3 | 42.1 | 1.6 |
| 45 - 54 | 51.7 | 46.7 | 1.6 |
| 55 - 59 | 49.9 | 48.6 | 1.5 |
| 60 - 64 | 51.9 | 47.2 | 0.9 |
| 65 - 74 | 51.1 | 47.1 | 1.8 |
| 75 and over | 36.8 | 60.7 | 2.5 |
Other reported routes include unspecified Other; not verified nonpurchase. Residual is 100 minus all rounded categories, not verified nonresponse.
Data & downloads
Scroll horizontally to see all columns.
| Reported route | Ages 35–44 (%) | Ages 75+ (%) |
|---|---|---|
| Already at home | 13.5 | 20.5 |
| Bought with periodical/newspaper | 1.3 | 2.5 |
| Borrowed from friend/relative | 5.9 | 8.7 |
| Borrowed from library | 3.7 | 7.4 |
| Gift | 12.8 | 20.9 |
| Downloaded free from Internet | 2.9 | 0.8 |
| Bought on Internet | 18.9 | 4.5 |
| Bought within shopping centre | 10.7 | 7.3 |
| Bought in bookshop (outside centres) | 20.9 | 14.7 |
| Bought at newsstand (outside centres) | 0.6 | 3.2 |
| Bought at stationery/bookshop (outside centres) | 0.5 | 0.9 |
| Bought at stall/fair/public square (outside centres) | 2.0 | 2.6 |
| Bought by mail/installments (outside centres) | 0.1 | 0.1 |
| Bought at supermarket/hypermarket/post office (outside centres) | 1.3 | 1.0 |
| Other (unspecified) | 3.3 | 2.4 |
| Unallocated residual (derived) | 1.6 | 2.5 |
Percent of leisure readers in each group. Single answer; codes 09–14 outside shopping centres. Residual is derived, not an official response category.
Scroll horizontally to see all columns.
| Age | Purchase routes (%) | Other reported routes (%) | Residual (%) |
|---|---|---|---|
| 18 - 19 | 50.1 | 48.9 | 1.0 |
| 20 - 24 | 52.3 | 46.5 | 1.2 |
| 25 - 34 | 56.2 | 42.6 | 1.2 |
| 35 - 44 | 56.3 | 42.1 | 1.6 |
| 45 - 54 | 51.7 | 46.7 | 1.6 |
| 55 - 59 | 49.9 | 48.6 | 1.5 |
| 60 - 64 | 51.9 | 47.2 | 0.9 |
| 65 - 74 | 51.1 | 47.1 | 1.8 |
| 75 and over | 36.8 | 60.7 | 2.5 |
Other reported routes include unspecified Other; not verified nonpurchase. Residual is 100 minus all rounded categories, not verified nonresponse.
Evidence & method
How we calculated it
- Secondary descriptive analysis of Istat 2024 Table 17; Table 17 segue count context; Q19.11 one response. Fieldwork May–September 2024; accessed October 30, 2026.
- Adult primary bands are 18+; complete input retains source ages 6+, sexes and total. No unweighted adult average.
- Nine purchase categories summed; alternative routes and unallocated residual separate. Highlight is exploratory, selected after inspection.
- Source workbook cell values were checked against the downloadable inputs; the downloadable standard-library script reproduces the sums.
What the data cannot tell us
- Last-read-book snapshot, not annual acquisition volume, sales, affordability, discovery or publisher demand.
- Other is unspecified; already-at-home may have previous purchase history. Free Internet downloads do not identify piracy.
- Unallocated residual is not verified item nonresponse; all rounding and source dashes retained.
- No item/age design variance or covariance supplied; no confidence intervals, significance or causal aging claims.
Original sources
- Istat 2024 reading release
Istat 2024 reading release: Reference year 2024; release 3 December 2025; leisure readers aged 6+.
Accessed October 30, 2026
- Istat statistical workbook
Istat statistical workbook: Table 17 percentages; Table 17 segue counts in thousands; Table 1 eligibility context.
Accessed October 30, 2026
- Istat methodology
Istat methodology: Resident private households; May–September 2024 fieldwork; design, weighting and approximate count precision.
Accessed October 30, 2026
- Istat glossary
Istat glossary: Leisure-reader definition, including relevant online reading/commenting; print, digital and audio formats.
Accessed October 30, 2026
- Istat questionnaire B, 2024
Istat questionnaire B, 2024: Printed pp. 23–25; Q19.11 one answer; codes 09–14 outside shopping centres. Q19.12 is separate discovery.
Accessed October 30, 2026
- Istat legal and reuse terms
Istat legal and reuse terms: Default CC BY 4.0, attribution, licence link and change disclosure; logo/third-party exclusions.
Accessed October 30, 2026
Cite & reuse this study
Alisson Bento. Italy’s last leisure-read book: acquisition routes differ across adult age groups. Secondary analysis of Istat, I cittadini e il tempo libero, reference year 2024, Table 17. Sources accessed October 30, 2026. https://alissonbento.com/research/italy-last-book-acquisition-age-2024/
Source: Istat, I cittadini e il tempo libero 2024, Table 17; source data CC BY 4.0, https://creativecommons.org/licenses/by/4.0/. Calculations and English explanation: Alisson Bento. Selection, regrouping and translation are modifications; no Istat endorsement or logo rights implied.
Corrections or editorial questions