
A question about concentrating reading, not counting holidays
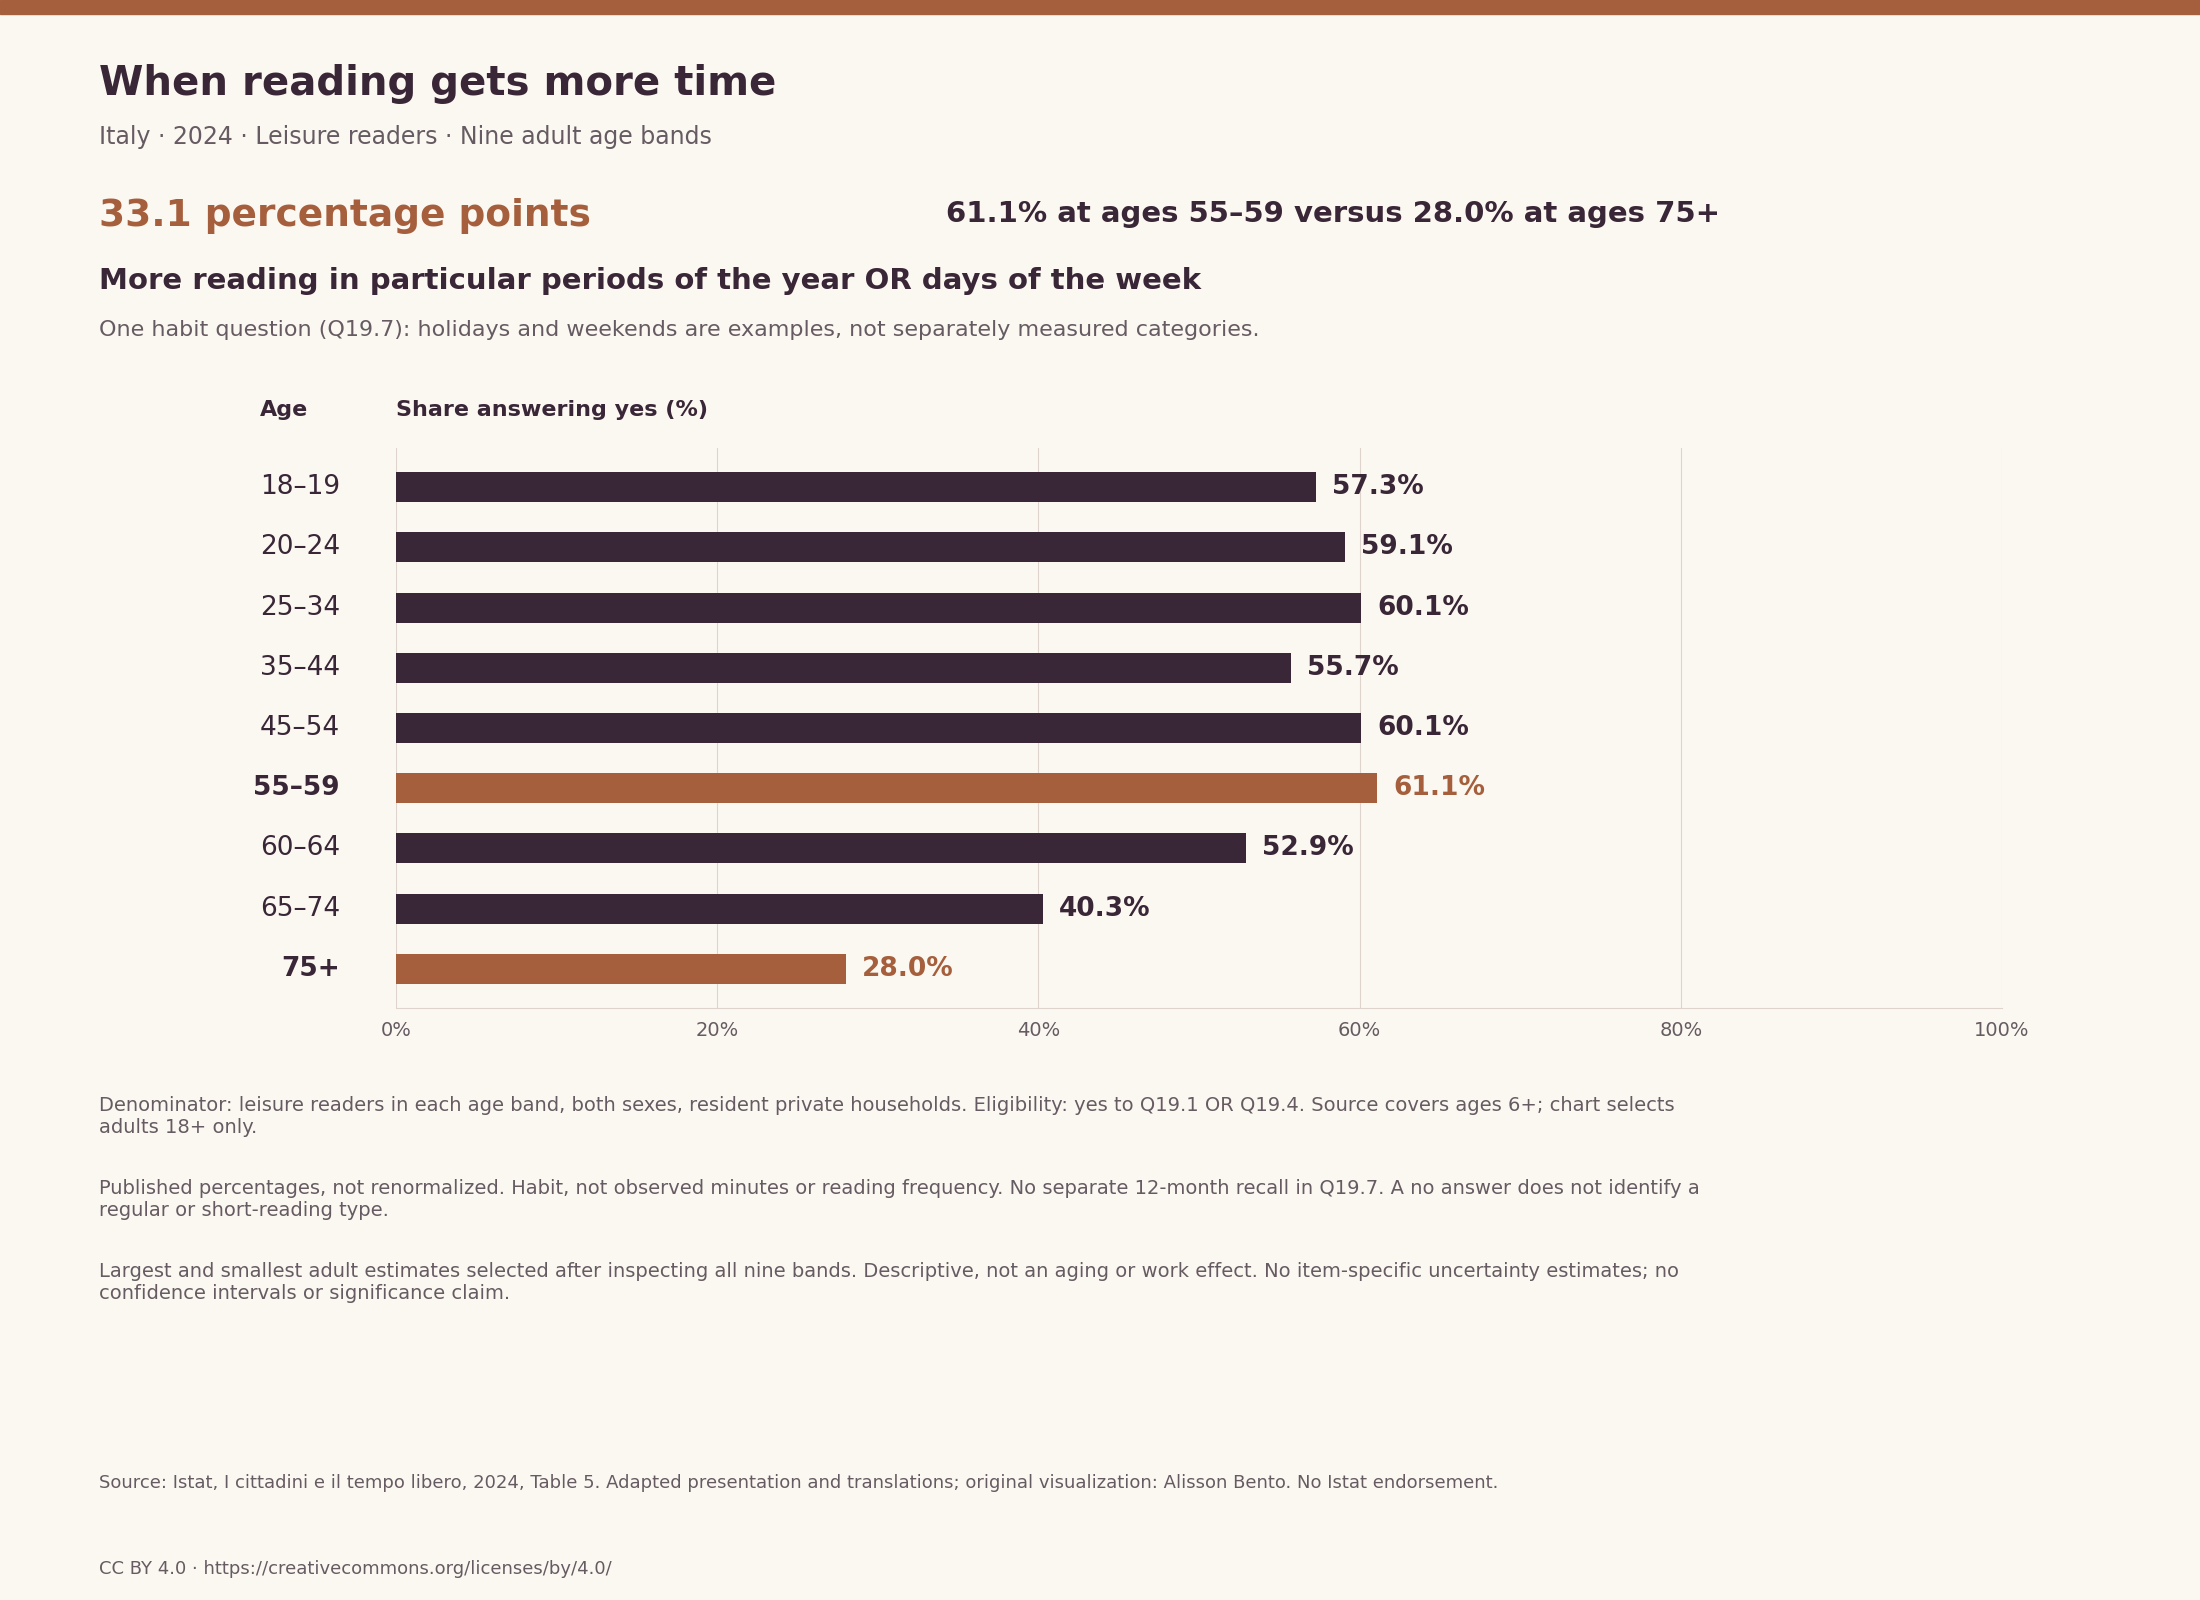
Among leisure readers aged 55–59 in Italy, 61.1% reported a habit of devoting more reading time to particular periods of the year or days of the week. Among leisure readers aged 75 or older, 28.0% reported that habit. The difference between these published estimates is 33.1 percentage points. These are the largest and smallest estimates across the nine adult age bands examined here, selected after inspecting the complete age profile. They describe responses to a survey question, not a measured effect of age or a statistically tested difference.
The distinction between concentrating reading and simply reading often matters. Someone can read every day and still devote more time to it on weekends. Another person can read infrequently without identifying any particular period when reading increases. Istat’s question does not put those people into opposite categories of everyday and holiday readers. It asks whether respondents recognize a particular kind of variation in their own reading habits. The resulting percentages are about that reported variation, not about the number of books completed during a holiday.
This analysis therefore keeps one question at its centre: how does the reported habit of giving reading more time in particular periods or days differ across published adult age groups? The answer comes from Table 5 of Istat’s 2024 survey, I cittadini e il tempo libero. All nine adult age bands are shown, including both reported responses and the unallocated arithmetic residual. Frequency and duration appear only as separate supporting dimensions; they are not combined into invented individual reader types.
What the question actually includes
Question 19.7 asks whether the respondent habitually devotes more time to reading books for reasons not strictly connected with school or professional activity in some periods of the year, with leave and holidays as examples, or on some days of the week, with weekends as an example. The two answers are no and yes. This is a single binary item, not a checklist in which respondents separately select holidays, weekends, seasons or particular weekdays. The word “or” is essential to understanding what a yes response can mean.
Consequently, none of the percentages in this article is a holiday-reading percentage. A respondent who reads more on weekends can answer yes without reading more on holiday. The reverse is also possible. The question does not tell us which context the respondent had in mind, how frequently that context occurred, or how much additional time it involved. Nor does it ask whether reading takes place exclusively in those periods. Replacing its wording with “holiday dependent” would introduce a mechanism and a restriction that the instrument does not measure.
The question concerns a habit and does not attach a separate explicit twelve-month reference period to that habit. The preceding reader-screen question does use the previous twelve months. Keeping those features separate avoids turning a general report about routines into a count of events during a precisely measured year. The published reference year is 2024, with survey fieldwork between May and September. The official release appeared on 3 December 2025. These dates describe the origin of the evidence, not reading behaviour in 2026.
Who is included in the denominator
The percentages describe leisure readers within each age group, with the sexes combined. They do not describe everyone of that age living in Italy. The source glossary and the questionnaire together define the reader population more precisely than the everyday expression “people who read books” might suggest. Books can be printed, electronic, available online or audiobooks. The relevant activity is reading for reasons not strictly school-related or professional, rather than all reading undertaken for any purpose.
The questionnaire has two routes into this population. Question 19.1 asks about reading books in the preceding twelve months for the specified non-school and non-professional reasons. Question 19.4 asks about reading and commenting on books together with other users through online applications. The routing instruction sends people who answer no to both questions onward to question 19.14. People answering yes to either continue through the questions on frequency, duration and contextual concentration. Eligibility therefore follows an OR rule, not a requirement to answer yes to both items.
This matters when describing the results. The population cannot be reduced to a count of respondents reporting at least one conventional book while ignoring the online-app route. Equally, the table is not an estimate of the percentage of all adults who read or who increase reading in particular contexts. The underlying survey covers residents of private households and excludes people living in collective institutions. Its published Table 5 begins at age six; this article selects the nine bands beginning at age eighteen. No overall source total covering ages six and over is relabelled as an adult total.
The full adult age profile
The yes estimates for the first three adult bands are 57.3% at ages 18–19, 59.1% at ages 20–24 and 60.1% at ages 25–34. Their corresponding no estimates are 41.6%, 40.2% and 39.3%. Subtracting both responses from 100 leaves arithmetic residuals of 1.1, 0.7 and 0.6 percentage points. These residuals remain visible rather than being redistributed between yes and no. Each percentage uses the leisure readers in its own age band as the denominator.
At ages 35–44, the yes estimate is 55.7%, with 43.3% answering no and a 1.0-point residual. At ages 45–54, the corresponding values are 60.1%, 39.0% and 0.9 points. At ages 55–59, they are 61.1%, 37.5% and 1.4 points. The movement from 25–34 through 35–44 and then to 45–54 shows why a simple steadily rising or falling account would be inaccurate. Adjacent published age groups do not form an uninterrupted gradient across adulthood.
The final three bands have yes estimates of 52.9% at ages 60–64, 40.3% at ages 65–74 and 28.0% at ages 75 and over. No estimates are 45.8%, 58.5% and 70.8%, with residuals of 1.3, 1.2 and 1.2 points. The first seven adult bands therefore have published yes estimates above half, whereas the final two are below half. This is a description of the displayed point estimates, not a confidence statement about population thresholds. Reporting every band also prevents the largest contrast from standing in for the entire age pattern.
What the 33.1-point contrast does and does not show
The highlighted contrast subtracts the 75-and-over estimate of 28.0% from the 55–59 estimate of 61.1%, giving 33.1 percentage points. It is a difference between two shares with different group-specific denominators. It is not a 33.1% increase, a difference in minutes, or a statement that one group reads 33.1% more books. The calculation is deliberately simple so that its meaning can be traced directly to the two published cells, Table 5 U49 and U52.
The contrast was selected after inspection of all nine adult bands. It should therefore be understood as an exploratory description of the largest observed separation, not as a preregistered test. The surrounding values are part of the result: 60.1% appears in both the 25–34 and 45–54 bands, while 55.7% appears at 35–44. The 55–59 estimate is the largest published adult value, but the rounded table does not establish that this group is statistically distinguishable from every other group with a nearby estimate.
Age groups observed in the same survey are also not the same people followed through time. The comparison cannot show what happens when an individual grows older, retires, changes jobs or gains more free time. Differences in household circumstances, health, education, reading preferences and other characteristics could coexist with the displayed age pattern, but this table does not isolate their contributions. Describing the older group as less dependent on holidays or the younger group as constrained by employment would therefore go beyond the measurement. The supported conclusion is narrower: reported contextual concentration differs across the published age profiles.
Why “no” does not mean a regular reading schedule
A no answer to question 19.7 means that the respondent did not report the habit described in that question. It does not positively identify a fixed timetable, an equal number of reading minutes every day, or a preference for brief reading. The question does not offer “regular reader” as an alternative response. An individual who changes reading time unpredictably could answer no because those changes are not attached to recognizable periods or days. The table cannot distinguish that possibility from a genuinely stable routine.
This limitation also applies to yes responses. They do not mean that someone reads only on special occasions. Daily readers can increase their reading on particular days and still answer yes. The two concepts concern different dimensions: reading frequency describes how often an activity occurs, whereas contextual concentration concerns whether more time is habitually assigned to certain temporal settings. Treating them as mutually exclusive would erase combinations that the questionnaire itself allows.
The table publishes frequency and contextual concentration beside one another, but it does not cross-tabulate them. Their proximity on a spreadsheet is not evidence that the same people supply particular combinations of answers. We cannot count daily readers who also concentrate their reading, or identify occasional readers whose time is stable, from these margins. This is why the article does not label groups as “holiday readers,” “short regular readers” or any comparable individual type. Such labels would require information linking responses within respondents, not merely separate percentages for the same age group.
Frequency and reading-day duration are supporting measures
The separate frequency question supplies a useful illustration without resolving that missing joint information. Among leisure readers aged 55–59, 18.4% report reading every day; among those aged 75 and over, 29.9% do so. These values sit alongside contextual-concentration estimates of 61.1% and 28.0%, respectively. The directions differ across these two age groups, but the table does not tell us how many people belong to both the daily-reading and contextual-concentration categories. The comparison is between marginal profiles, not matched individual behaviours.
Question 19.6 asks about average time devoted to reading on the days when the respondent reads. Its duration measure is therefore conditional on a reading day. It is not an average across all calendar days, not an observed time-use diary total, and not the length of an individual reading session. For the same two age groups, 13.4% and 10.4% report less than half an hour on reading days. These percentages cannot be multiplied by the daily-reading percentages to estimate a joint share: that would introduce an unsupported assumption about the relationship between the answers.
The source also offers a response indicating that the amount of time often changes. That is a substantive answer, not a missing value. Several fixed-duration answers are aggregated in the published table, including a three-hours-or-more category, while the questionnaire uses its own interval wording. The accompanying extraction preserves the published labels rather than silently redefining endpoints. These details matter because a seemingly simple description of “short reading” can otherwise confuse duration, frequency and regularity. None of those measures provides a holiday-specific breakdown of question 19.7.
Rounding, unallocated responses and survey uncertainty
The reported percentages have one-decimal precision. Subtracting published yes and no shares from 100 produces an unallocated residual, not a directly observed response category. The residual may reflect responses not allocated to the displayed categories as well as rounding. It should not be described as an exact item-nonresponse rate without further documentation. Renormalizing yes and no to sum to 100 would change the published denominators and conceal this distinction. Here both original responses and the derived residual are retained.
The complete source extraction preserves symbolic cells as symbols rather than replacing them with zero. A dash is not treated as an exact measured zero, nor is it assigned a suppression meaning that has not been established for that cell. The primary adult contextual-concentration cells are numeric. The broader audit extract includes other question blocks and source populations, where symbolic values and rounding differences remain relevant. One adult book-count block has a residual of minus 0.1 percentage point, illustrating why arithmetic remainders should not automatically be interpreted as people with missing answers.
Istat’s methodological note discusses sampling error and provides approximate relative-error tables for estimated counts of households and persons, with examples of confidence-interval construction. It would be incorrect to say the source provides no uncertainty guidance at all. Those general count tables, however, do not supply the item-specific ratio variance and cross-group covariance needed here to establish confidence intervals for these conditional percentages or their differences. Counts in the companion table are estimated thousands of people, not subgroup respondent sample sizes. This analysis therefore reports neither confidence intervals nor significance tests, and does not infer exact population rankings from rounded estimates.
Keeping the adult focus and the analytical question intact
The source offers additional breakdowns, but their presence does not automatically justify widening the argument. Table 7, for example, reports occupational and activity-status groups using a population aged fifteen and over. Those rows cannot be presented as comparisons restricted to adults aged eighteen and over. Employment totals also coexist with occupational subgroups nested within them, so adding every displayed row would double count. The public adult analysis uses the age bands from Table 5 rather than treating this different occupational universe as interchangeable.
Nor is an unweighted average of the nine age percentages an estimate for all adult leisure readers. The age bands differ in width and population size, and each percentage has its own reader denominator. Averaging the percentages equally would give an arbitrary equal weight to groups that are not equally numerous. This article consequently reports individual age profiles and does not invent an adult total. The retained source references allow readers to distinguish the narrower analytical selection from the broader population covered by the original survey tables.
The question also remains distinct from an analysis of whether someone reads on an average diary day, or of the average minutes spent reading by participants and nonparticipants. Those are useful but different measurements. Here the central variable is the respondent’s reported habit of assigning more reading time to particular temporal contexts. Frequency and duration help explain the boundaries of that variable; they do not replace it. Keeping that focus makes the analysis informative without turning a new country label into a repetition of a time-use comparison.
Reproducing and using the result
The downloadable adult profile contains all nine age bands with yes, no and residual values, together with source-cell references. The supporting category extract retains the published frequency, book-count, duration and contextual-concentration categories for those adult bands. These files are derived analytical inputs, not microdata. A standard-library Python script rebuilds the adult context profile, checks the nine expected groups and reproduces the 33.1-point contrast. The source manifest identifies the official workbook, questionnaire, glossary, methodology and reuse terms, while fingerprints identify the source artifacts used in the analysis.
The calculations were checked against the workbook through an independent XML extraction, rather than relying only on a second reading of the displayed result. That check establishes agreement with the cited cells and arithmetic; it does not remove survey error or validate causal interpretations. Readers reproducing the work should retain the published response shares, avoid converting symbolic values to numerical observations, and keep derived residuals separate from official response categories. The methods file records these choices so that a different presentation can preserve the same measurement boundaries.
The source data are credited to Istat under its stated Creative Commons Attribution 4.0 terms, unless otherwise indicated. Selection of adult rows, calculations and English presentation are adaptations; no Istat endorsement is implied. The practical finding is a descriptive one: the habit of giving reading extra time in particular periods or days is reported by different shares of adult leisure readers across age groups. That pattern supports more precise questions about reading routines. It does not answer which holidays matter, which individual readers combine brief and frequent reading, or what intervention would change those habits.
When reading gets more time
Italy · 2024 · Leisure readers · Nine adult age bands. More reading in particular periods of the year OR days of the week. 61.1% at ages 55–59 versus 28.0% at ages 75+
Full chart and source

Scroll horizontally to inspect the chart. ↔
Chart and values
Scroll horizontally to see all columns.
| Age | Yes (%) | No (%) | Unallocated residual (pp) |
|---|---|---|---|
| 18–19 | 57.3 | 41.6 | 1.1 |
| 20–24 | 59.1 | 40.2 | 0.7 |
| 25–34 | 60.1 | 39.3 | 0.6 |
| 35–44 | 55.7 | 43.3 | 1.0 |
| 45–54 | 60.1 | 39.0 | 0.9 |
| 55–59 | 61.1 | 37.5 | 1.4 |
| 60–64 | 52.9 | 45.8 | 1.3 |
| 65–74 | 40.3 | 58.5 | 1.2 |
| 75+ | 28.0 | 70.8 | 1.2 |
Percent of leisure readers in each adult band, sexes combined. Residual = 100 minus published yes and no; not an exact nonresponse category. No renormalization.
Data & downloads
Scroll horizontally to see all columns.
| Age | Yes (%) | No (%) | Unallocated residual (pp) |
|---|---|---|---|
| 18–19 | 57.3 | 41.6 | 1.1 |
| 20–24 | 59.1 | 40.2 | 0.7 |
| 25–34 | 60.1 | 39.3 | 0.6 |
| 35–44 | 55.7 | 43.3 | 1.0 |
| 45–54 | 60.1 | 39.0 | 0.9 |
| 55–59 | 61.1 | 37.5 | 1.4 |
| 60–64 | 52.9 | 45.8 | 1.3 |
| 65–74 | 40.3 | 58.5 | 1.2 |
| 75+ | 28.0 | 70.8 | 1.2 |
Percent of leisure readers in each adult band, sexes combined. Residual = 100 minus published yes and no; not an exact nonresponse category. No renormalization.
Evidence & method
How we calculated it
- Secondary descriptive analysis of Istat 2024 Table 5; reader routing is Q19.1 OR Q19.4. Q19.7 asks about a habit, not a count of holidays.
- Nine adult bands, sexes combined; resident private households. Overall source 6+ and occupation 15+ universes are not adult totals.
- Published one-decimal percentages retained. Residuals are not renormalized. Maximum/minimum gap selected after inspection.
- Official workbook extraction independently checked through ZIP/XML. Public standard-library code reproduces the primary profile from derived category inputs.
What the data cannot tell us
- Single yes/no item combines periods of year OR days of week; no holiday-specific quantity or interpretation of no as a regular schedule.
- Frequency, duration and contextual concentration are separate marginals; no joint individual reader types. Duration is conditional on reading days.
- General count sampling-error guidance exists; item-specific ratio variance/covariance needed for these intervals or difference tests is not supplied. No significance claims.
- Residuals combine unallocated responses and rounding; symbolic cells preserved without imposing a zero or unverified suppression interpretation. No causal age, work, vacation, retirement or cohort effects.
Original sources
- Istat 2024 reading release
Istat 2024 reading release: Reference year 2024; release 3 December 2025; leisure readers aged 6+.
Accessed October 30, 2026
- Istat statistical workbook
Istat statistical workbook: Table 5 percentages and the continuation sheet (“tavola 5 segue”) with estimated counts in thousands; nine adult age bands selected.
Accessed October 30, 2026
- Istat methodology
Istat methodology: Resident private households; May–September 2024 fieldwork; design, weighting and approximate count precision.
Accessed October 30, 2026
- Istat glossary
Istat glossary: Leisure-reader definition, including relevant online reading/commenting; print, digital and audio formats.
Accessed October 30, 2026
- Istat questionnaire B, 2024
Istat questionnaire B, 2024: Printed pages 23–24; Q19.1 OR Q19.4 reader routing; Q19.7 single yes/no context habit; Q19.6 time on reading days.
Accessed October 30, 2026
- Istat legal and reuse terms
Istat legal and reuse terms: Default CC BY 4.0, attribution, licence link and change disclosure; logo/third-party exclusions.
Accessed October 30, 2026
Cite & reuse this study
Alisson Bento. When reading gets more time: adult age profiles in Italy, 2024. Secondary analysis of Istat, I cittadini e il tempo libero, reference year 2024, Table 5. Sources accessed 30 October 2026. https://alissonbento.com/research/italy-reading-context-age-2024/
Source: Istat, I cittadini e il tempo libero 2024, Table 5; source data CC BY 4.0, https://creativecommons.org/licenses/by/4.0/. Calculations and English explanation: Alisson Bento. Adult-row selection, extraction, calculations and translation are modifications; no Istat endorsement or logo rights implied.
Corrections or editorial questions