
A profile comparison, not a cultural league table
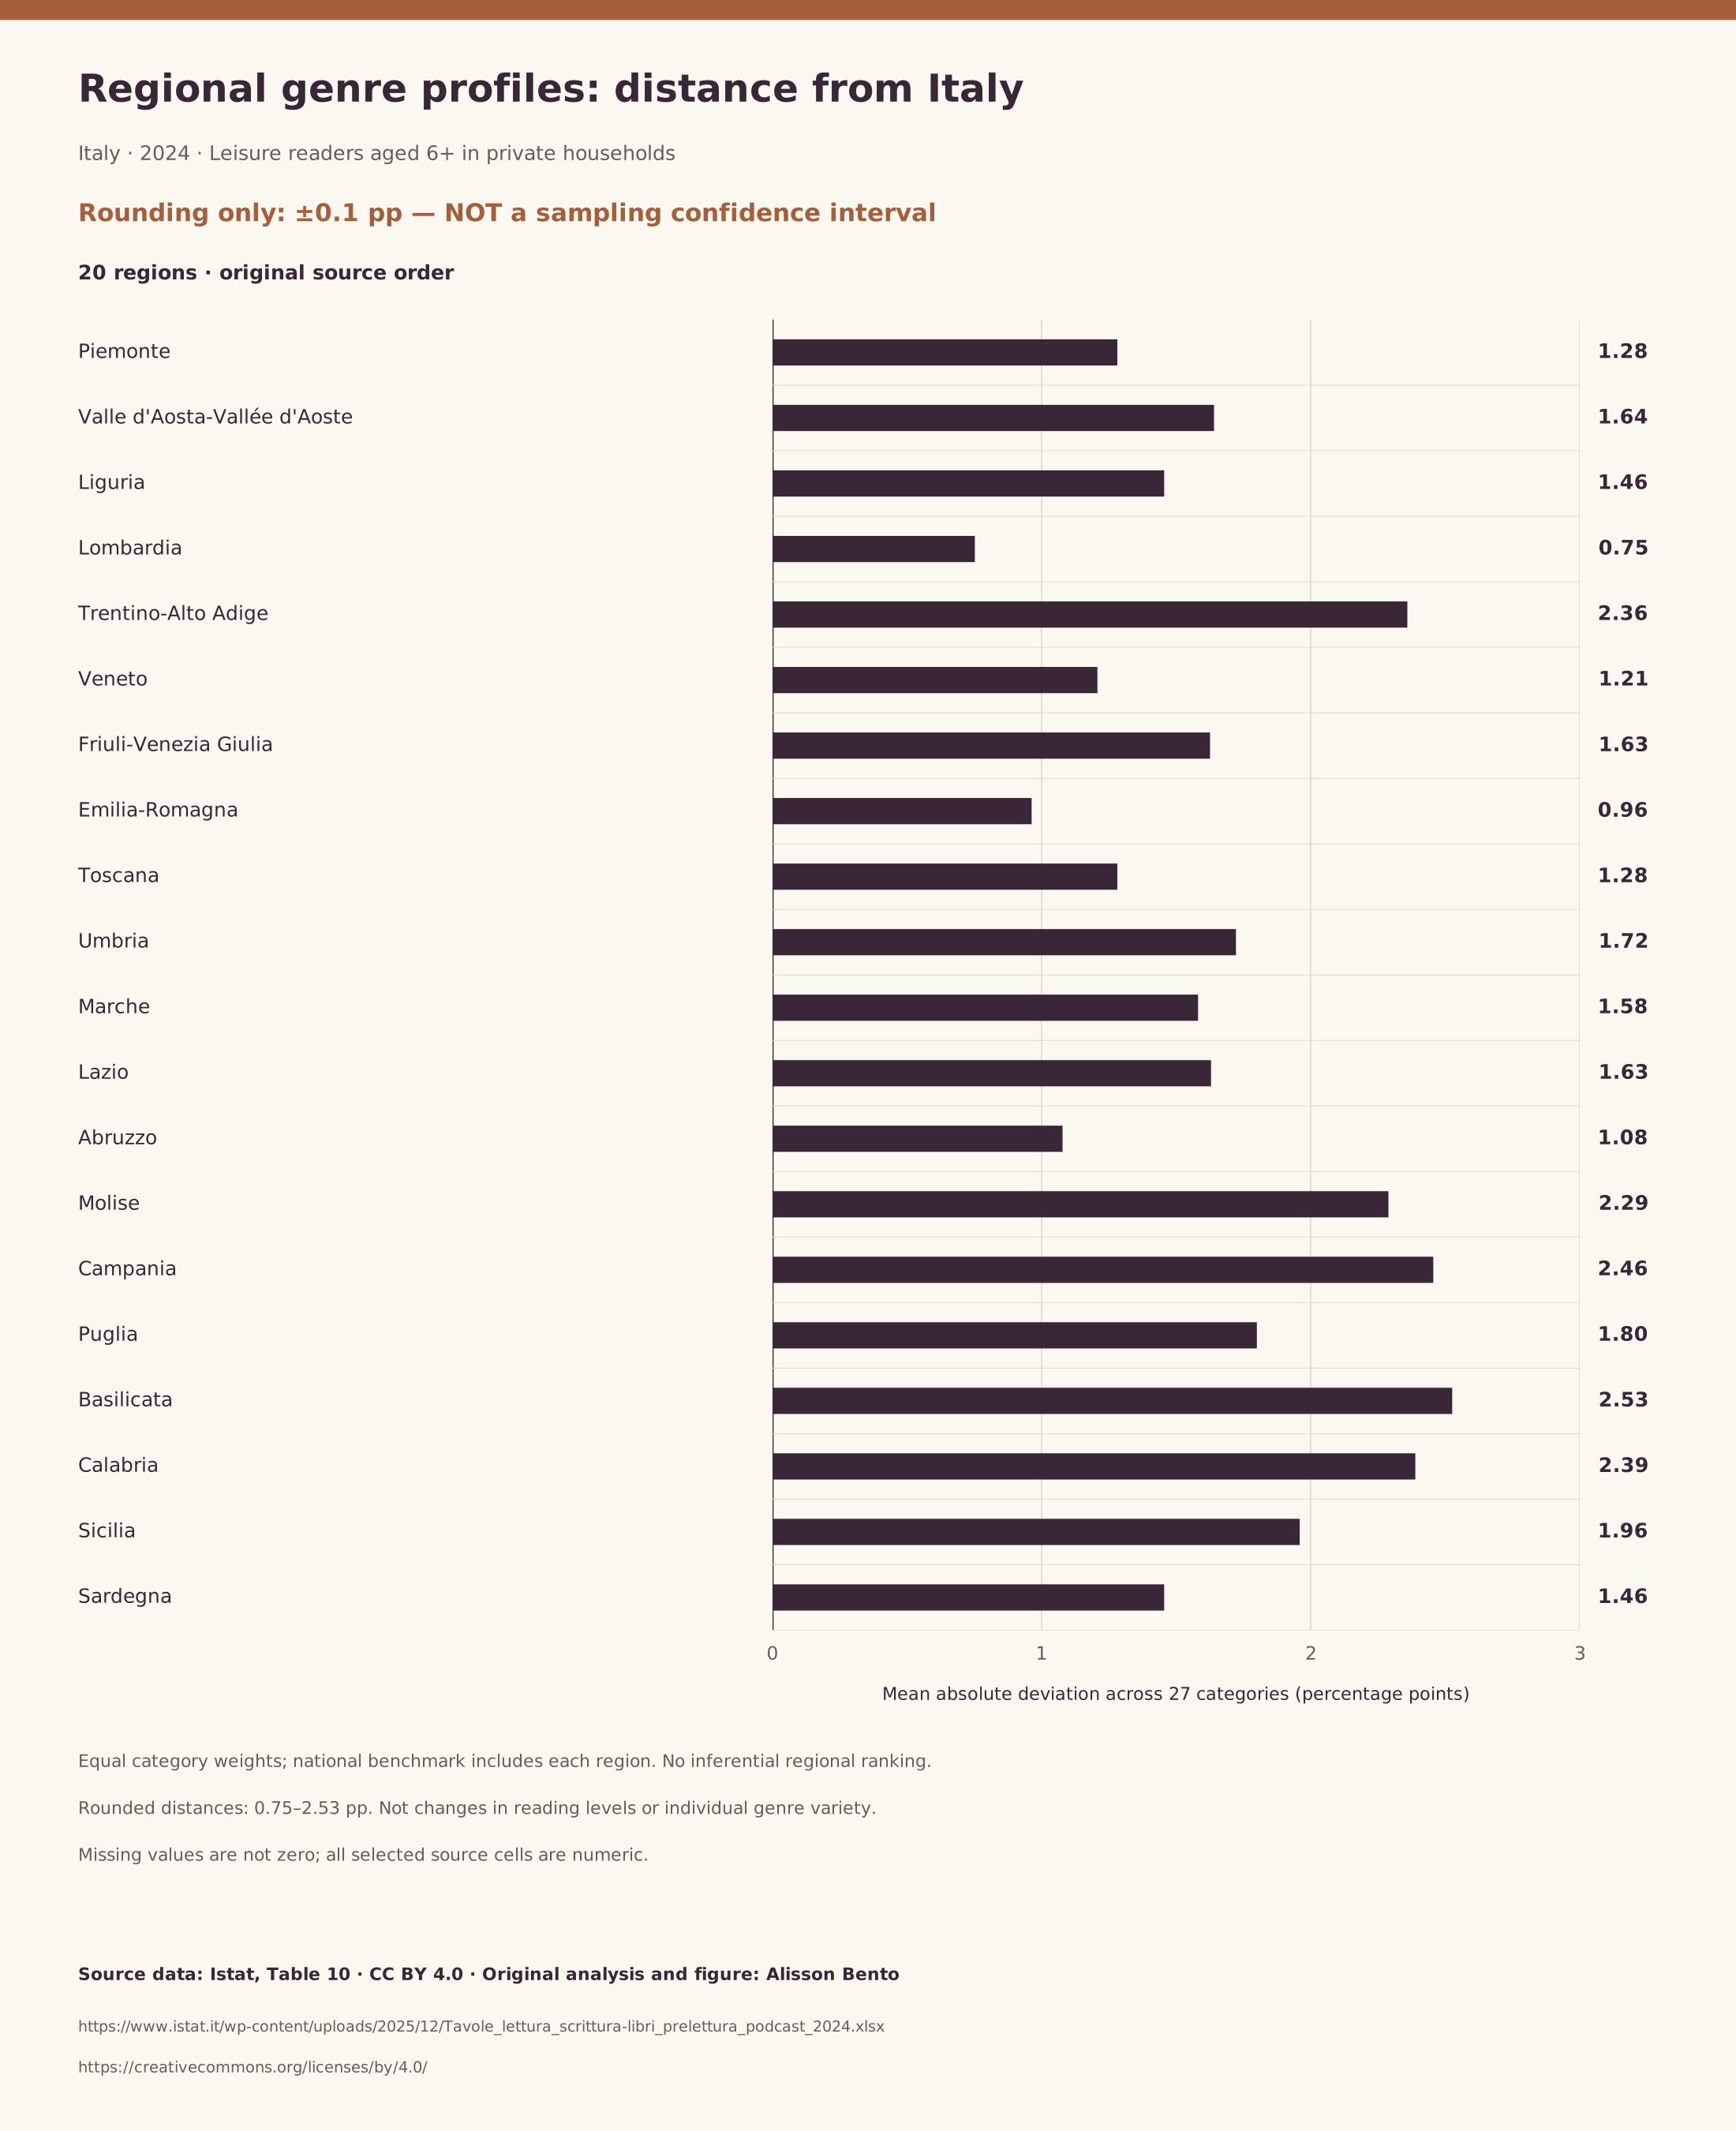
A national reading percentage can conceal several different regional patterns. Istat's 2024 survey makes it possible to compare those patterns without pretending that every reader belongs to a single genre. This study asks a narrow question: how far is each region's published collection of genre-reporting percentages from the corresponding Italian collection? It uses all 27 categories in Table 10, not a selection of fashionable genres. The answer is expressed as an average absolute difference in percentage points. Across the 20 regions, the calculated values extend from approximately 0.75 to 2.53 points. This is a description of the published estimates, not a statistically established ordering of regional populations.
The complete regional table is presented in Istat's geographic order. No region is identified as culturally better, more sophisticated, more diverse or more open. A region close to the national profile can contain very different readers; a region farther away can differ on just a few widely reported categories. The purpose of the summary is to make a large set of comparable marginal percentages readable while preserving the category-level evidence that explains it.
Who belongs in the denominator
Every percentage used in the main calculation concerns leisure readers aged six or older in the same territory, with both sexes combined. It is not a percentage of all residents. A reported value of 20 percent therefore means 20 out of every 100 people meeting the survey's leisure-reader definition in that territory, not 20 out of every 100 residents. Regions with different overall reading participation can have similar genre profiles among readers. The present comparison does not measure or explain that participation difference.
The glossary defines leisure readers through reading at least one book in the previous 12 months for reasons other than professional or school requirements and/or reading and commenting on books with other users through online applications. Books can be printed, digital or audio. The questionnaire routes respondents who qualify through either of the relevant screening questions into the reading section. Consequently, this is not a print-only audience and should not be described as a sample of book buyers. The universe also includes younger readers; the estimates cannot be relabelled adult preferences. The underlying household survey covers people resident in private households, rather than residents of collective institutions. The source methodology notes that information for children under fourteen is supplied by an adult proxy, so these categories are reported reading activity rather than independently observed choices.
What the genre questions actually ask
On printed page 24 of questionnaire B, questions 19.8 and 19.9 ask about genres read during the preceding 12 months for reasons not strictly related to school or work. Both explicitly permit multiple responses. The first list includes literary categories distinguished by author origin, romance, crime and noir, science fiction and fantasy, horror, sciences, art, religion, music and current affairs. The second extends the list to practical interests, comics and other forms. Table 10 brings these published categories together.
The wording is about reported reading, not a forced choice of a favourite genre. A respondent can contribute to several percentages, and the categories need not be mutually exclusive descriptions of books. Nor does selecting a category reveal how many books were read within it or how much reading time it received. One book and many books can both produce a positive genre response. The study therefore compares reported category prevalence, not market share, sales volume, time allocation or intensity of commitment. Recalling reading across a year also differs from recording it in a diary; the published estimates inherit the limitations of respondent reporting.
All 27 categories, with their boundaries intact
The analysis retains all 27 columns from the published table, including Other. The first two categories cover novels, stories, poetry and theatre by Italian and foreign authors respectively. They are not merely novels, and foreign authors are not equivalent to foreign-language reading: translated books can belong to that category. Science fiction and fantasy remain a combined item, as do crime and noir. Comics include manga and graphic novels. These combinations cannot be divided using the published marginal percentages.
Romance novels translate the source category Romanzi rosa. Nothing in this item separately measures dark romance, and the estimate must not be presented as evidence about that narrower label. Picture books, books for children and young people, and gamebooks also remain in the vector even if a particular editorial discussion focuses on adult commercial fiction. Removing them would change the question and the denominator of the category average. Other is an imperfect but real part of the published classification; excluding it because its content is unspecified would selectively redefine the profile. Original Italian labels, English explanations and source-cell addresses accompany every category in the downloadable data.
A transparent distance in percentage points
For each category, the calculation subtracts the published Italian percentage from the published regional percentage, takes the absolute value, adds all 27 absolute differences and divides by 27. In notation, D(r) equals the sum over categories of absolute regional-minus-national percentage differences, divided by 27. A value of 1.5 points means that the region's published category percentages differ from Italy's by 1.5 percentage points on average across this fixed list. It does not mean that 1.5 percent of readers have unusual tastes or that the region is 1.5 percent less similar in any universal sense.
Each category receives the same numerical weight. This is a deliberate measurement choice, not a claim that all categories have equal cultural importance. A five-point difference contributes the same amount whether it occurs in a widely reported literary category or a less common practical category. Broad and narrow labels coexist in the questionnaire, so the result depends on its classification. The arithmetic is transparent and reproducible, but the distance is not independent of how genres were grouped. It should be used with the full profile, not as a substitute for it.
Reading the results without turning them into ranks
The region-level results range from 0.751852 to 2.525926 percentage points when calculated from the published one-decimal inputs. For communication, two decimal places are enough; extra digits in the downloadable calculation support reproducibility rather than statistical precision. Lombardia's published profile yields about 0.75 points, Piemonte's 1.28, Lazio's 1.63 and Basilicata's 2.53. These examples illustrate the numerical scale. They do not establish that the corresponding population profiles differ by those exact amounts, and they are not a recommendation to order regions by taste.
Several distances are close together. Piemonte and Toscana produce the same distance from the rounded inputs, as do Liguria and Sardegna, despite having different category vectors. Equal summaries do not imply identical profiles. Friuli-Venezia Giulia and Lazio have almost identical average deviations, but even the small distinction between their calculated values should not be promoted as a substantive finding. The table preserves every region and avoids rank numbers. This makes the summary useful for inspection while resisting the false precision that a league table would invite.
Why the category-level differences still matter
The signed differences provide information that the distance deliberately discards. Piemonte reports 41.5 percent for the foreign-author literary category against 37.0 percent nationally, a positive 4.5-point difference. In the same region, science fiction and fantasy is 18.3 percent against 21.1 percent, a negative 2.8-point difference. Both contribute positively to the absolute-distance calculation. A single signed average would allow opposite directions to cancel and would answer a different question.
Basilicata provides another transparent arithmetic example. Its foreign-author literary percentage is 26.8 against Italy's 37.0, while travel guides are 9.6 against 18.4. These are differences of minus 10.2 and minus 8.8 points. They help explain why its overall distance is larger than some other published distances, but they are not tests of exceptionalism. The examples were chosen to explain the calculation after inspecting the complete table, not through a preregistered hypothesis test. Every other category remains available, including those whose differences are small or point in the opposite direction. Interpretation should follow that complete evidence rather than a selective list of contrasts.
Why percentages are not normalized into a pie
Because the genre questions allow multiple responses, their percentages are not slices of a mutually exclusive distribution. Dividing each percentage by the sum of all percentages would change its meaning from the share of readers reporting that category to the share of accumulated category reports allocated to it. Those two quantities answer different questions. The latter would also make one category's normalized value change when another category changes, even if its own reader prevalence stays constant. This analysis does not make that transformation.
It consequently does not calculate a probability-distribution distance, entropy score or diversity index from the genre percentages. The reported mean absolute deviation is simply a distance between prevalence vectors measured in the same units. It accommodates overlap without inventing an exclusive partition. Neither the sum of the percentages nor their shape identifies how categories are combined within individual readers. Even a region with a broad-looking profile might consist of several groups with narrow, different interests. Individual reading breadth requires joint responses or appropriate microdata, not regional marginals alone.
The national benchmark includes each region
Italy's row is used directly as the benchmark. It is not reconstructed by averaging the 20 regional percentages, because that would give every region equal influence regardless of the number and survey weight of its eligible readers. The official national estimate reflects the survey's estimation procedure. The regional and national percentages also refer to overlapping people: each region contributes to the Italian total. This comparison is therefore against the national profile as published, not against an independent control group or the rest of Italy with that region removed.
This overlap matters for both meaning and uncertainty. The summary describes proximity to a national mixture that includes the region itself. It cannot be treated as a clean measure of separation from all other regions. A leave-one-region-out benchmark would require compatible weighted totals and careful treatment of rounding; it is not silently inferred here. Likewise, a test of a region-national difference would need their covariance. Treating their errors as independent would ignore the shared respondents. Keeping the official benchmark offers a clear, consistent descriptive comparison, provided that its inclusive nature remains explicit.
Geography is retained without double counting
The main comparison consists of Italy's 20 regions. Table 10 additionally reports Bolzano–Bozen and Trento beneath Trentino-Alto Adige. These province-level rows are preserved as supplemental information, not counted as two extra regions and not added to their parent region. Geographic divisions and municipality-type rows are also retained in the downloadable extraction. The resulting file contains 34 territorial profiles, including the national row, each with the same 27 published categories. This is an audit-friendly preservation of the table rather than an expansion of the regional estimand.
Readers should not average all 34 distances or treat them as independent geographic observations. The groups overlap or classify people along different territorial dimensions. A geographic division contains regions; a municipality type can occur across regions; the national total contains them all. The main table therefore separates the 20 regional results from supplemental outputs. Keeping source order also makes omissions easier to notice. No smaller region is dropped for producing an inconvenient value, and no province is promoted to regional status because its profile makes a more dramatic comparison.
Rounding bounds are not confidence intervals
The percentages are published to one decimal place. Under ordinary nearest-tenth rounding, each underlying published estimate can differ from its displayed value by at most 0.05 percentage points. A regional-minus-national difference can therefore move by at most 0.10 points from rounding alone. Taking absolute values and averaging cannot increase that worst-case bound: the distance can move by at most 0.10 points. The downloadable file reports that conservative rounding-only envelope, with its lower end floored at zero. Italy compared with itself remains exactly zero because both sides are the same values.
This envelope says nothing about the difference between a sample estimate and the population quantity. Istat supplies survey-design and general precision information, but this analysis has no complete variance-covariance matrix for the genre prevalences and their regional-national contrasts. The nonlinear absolute-value summary would require appropriate uncertainty propagation. The full responding sample was about 16,950 households and nearly 38,000 individuals; those are not the sample sizes for each regional leisure-reader category. No confidence interval, significance claim or robust regional ranking is manufactured from those totals. Sampling uncertainty can be materially larger than rounding uncertainty.
What can explain a profile, and what cannot be established here
The tables show unadjusted regional reader profiles. Regions can differ in the age, education and other characteristics of their eligible readers, as well as in many unmeasured circumstances. A difference in a genre percentage is not automatically a territorial effect. Tables 9, 11 and 12 offer other demographic views of genres, but they do not provide the joint regional-by-demographic detail needed to standardize this comparison. In particular, Table 11 starts at age 15 and Table 12 at age 25. Mixing those percentages with Table 10's age-six-plus values would introduce incompatible universes.
Nor does one cross-section establish change over time. Fieldwork took place between May and September 2024, and the genre questions refer to the preceding 12 months. These are not observations of current 2026 tastes. Nothing in this design isolates advertising, book availability, migration, income or local cultural institutions as causes. Such explanations might motivate a separate study, but they are not findings of this one. The contribution here is a precisely bounded comparison of reported genre prevalence, distinct from how readers discover books, acquire copies or allocate reading across contexts.
Reproducibility and a proportionate conclusion
The public data retain original labels, numerical inputs, signed percentage-point differences and exact workbook cells. A compact Python script using only the standard library recalculates every territorial distance from those inputs, checks the 27-category structure and verifies the arithmetic of the signed differences. Nonnumeric or missing cells are never converted to zero: the specified rule is to preserve them and withhold an incomplete distance. All categories in the selected territorial rows are numeric in this release, so the main profiles are complete. Source URLs and cryptographic fingerprints identify the official documents used.
The calculations and English explanation are by Alisson Bento. Source data are credited to Istat's I cittadini e il tempo libero survey, reference year 2024, Table 10, under the stated Creative Commons Attribution 4.0 terms. Extraction, translation and calculations are adaptations, not Istat endorsement. The defensible conclusion is modest but useful: regional genre-reporting profiles can be compared coherently without converting overlapping responses into exclusive preferences. The distance offers a readable summary, while the full category vector, denominator and uncertainty limits keep that summary from becoming an unsupported story about individual readers or regional cultural quality.
Regional genre profiles: distance from Italy
Italy · 2024 · Leisure readers aged 6+ in private households. Rounding only: ±0.1 pp — NOT a sampling confidence interval
Full chart and source
Scroll horizontally to inspect the chart. ↔
Chart and values
Scroll horizontally to see all columns.
| Region | Mean absolute deviation (pp) |
|---|---|
| Piemonte | 1.28 |
| Valle d'Aosta-Vallée d'Aoste | 1.64 |
| Liguria | 1.46 |
| Lombardia | 0.75 |
| Trentino-Alto Adige | 2.36 |
| Veneto | 1.21 |
| Friuli-Venezia Giulia | 1.63 |
| Emilia-Romagna | 0.96 |
| Toscana | 1.28 |
| Umbria | 1.72 |
| Marche | 1.58 |
| Lazio | 1.63 |
| Abruzzo | 1.08 |
| Molise | 2.29 |
| Campania | 2.46 |
| Puglia | 1.80 |
| Basilicata | 2.53 |
| Calabria | 2.39 |
| Sicilia | 1.96 |
| Sardegna | 1.46 |
Mean absolute difference across all 27 genre prevalences versus official Italy; percentage points. Two decimals are presentation precision only. No ranks; sampling uncertainty unavailable.

Italy’s reported reading genres
Italy · 2024 · Leisure readers aged 6+ in private households. Multiple responses permitted — percentages do NOT sum to 100%
Full chart and source

Scroll horizontally to inspect the chart. ↔
Chart and values
Scroll horizontally to see all columns.
| Category | Italy (%) |
|---|---|
| Novels, stories, poetry, theatre (Italian authors) | 48.1 |
| Novels, stories, poetry, theatre (foreign authors) | 37.0 |
| Romance novels | 12.5 |
| Crime and noir | 30.6 |
| Science fiction and fantasy | 21.1 |
| Horror | 6.1 |
| Social or human sciences, philosophy, politics, etc. | 22.3 |
| Natural, exact, applied sciences and technology | 8.1 |
| Art | 6.4 |
| Religion | 6.3 |
| Music | 4.2 |
| Current affairs (instant books) | 5.7 |
| Humour | 12.5 |
| Hobbies and leisure | 12.8 |
| Astrology, magic and esotericism | 3.6 |
| Computing | 4.9 |
| Travel guides | 18.4 |
| Health, pregnancy and childcare | 7.2 |
| Home (cooking, DIY, etc.) | 14.0 |
| Practical manuals | 5.5 |
| Photography and cinema | 4.3 |
| Comics (including manga and graphic novels) | 17.2 |
| Books for children and young people, fairy tales | 17.9 |
| Books about animals | 7.1 |
| Picture books | 3.6 |
| Gamebooks and escape books | 1.2 |
| Other | 4.5 |
Percent of leisure readers aged 6+, sexes combined. Multiple responses; not exclusive shares.

Data & downloads
Scroll horizontally to see all columns.
| Region | Mean absolute deviation (pp) |
|---|---|
| Piemonte | 1.28 |
| Valle d'Aosta-Vallée d'Aoste | 1.64 |
| Liguria | 1.46 |
| Lombardia | 0.75 |
| Trentino-Alto Adige | 2.36 |
| Veneto | 1.21 |
| Friuli-Venezia Giulia | 1.63 |
| Emilia-Romagna | 0.96 |
| Toscana | 1.28 |
| Umbria | 1.72 |
| Marche | 1.58 |
| Lazio | 1.63 |
| Abruzzo | 1.08 |
| Molise | 2.29 |
| Campania | 2.46 |
| Puglia | 1.80 |
| Basilicata | 2.53 |
| Calabria | 2.39 |
| Sicilia | 1.96 |
| Sardegna | 1.46 |
Mean absolute difference across all 27 genre prevalences versus official Italy; percentage points. Two decimals are presentation precision only. No ranks; sampling uncertainty unavailable.
Scroll horizontally to see all columns.
| Category | Italy (%) |
|---|---|
| Novels, stories, poetry, theatre (Italian authors) | 48.1 |
| Novels, stories, poetry, theatre (foreign authors) | 37.0 |
| Romance novels | 12.5 |
| Crime and noir | 30.6 |
| Science fiction and fantasy | 21.1 |
| Horror | 6.1 |
| Social or human sciences, philosophy, politics, etc. | 22.3 |
| Natural, exact, applied sciences and technology | 8.1 |
| Art | 6.4 |
| Religion | 6.3 |
| Music | 4.2 |
| Current affairs (instant books) | 5.7 |
| Humour | 12.5 |
| Hobbies and leisure | 12.8 |
| Astrology, magic and esotericism | 3.6 |
| Computing | 4.9 |
| Travel guides | 18.4 |
| Health, pregnancy and childcare | 7.2 |
| Home (cooking, DIY, etc.) | 14.0 |
| Practical manuals | 5.5 |
| Photography and cinema | 4.3 |
| Comics (including manga and graphic novels) | 17.2 |
| Books for children and young people, fairy tales | 17.9 |
| Books about animals | 7.1 |
| Picture books | 3.6 |
| Gamebooks and escape books | 1.2 |
| Other | 4.5 |
Percent of leisure readers aged 6+, sexes combined. Multiple responses; not exclusive shares.
Evidence & method
How we calculated it
- Secondary descriptive analysis of Istat 2024 Table 10, all 20 regions and all 27 published categories, including Other.
- For each region, average absolute regional-minus-national percentage-point difference, with equal category weights and no normalization.
- Q19.8–19.9 multiple responses; preceding 12 months; leisure readers age 6+ through Q19.1 OR Q19.4.
- Supplemental territorial rows preserved; provinces never counted as additional regions; missing values not zero.
What the data cannot tell us
- No joint individual genre responses; no individual omnivorousness or diversity inference.
- One-decimal rounding implies at most ±0.1-point rounding uncertainty in distance, not a sampling interval.
- No category variance-covariance matrix for regional-national contrasts; no ranking, significance test or causal claim.
- National benchmark includes each region; age/education reader composition is not adjusted. Romance is not dark romance.
- Information for children under 14 is reported by an adult proxy; the study does not independently observe reading choices.
Original sources
- Istat release
Istat release: Reference year 2024; released 3 December 2025.
Accessed October 30, 2026
- Istat workbook
Istat workbook: Table 10 B:AB; rows 7–28, 31–35, 38–44. Tables 9, 11, 12 inspected for universe compatibility, not pooled.
Accessed October 30, 2026
- Istat methodology
Istat methodology: May–September 2024; resident private households; survey design and weighting.
Accessed October 30, 2026
- Istat glossary
Istat glossary: Leisure-reader definition includes book reading and/or reading/commenting through online applications.
Accessed October 30, 2026
- Istat questionnaire b
Istat questionnaire b: Printed pages 23–24; reader routing Q19.1 OR Q19.4; multiple-response Q19.8–19.9, preceding 12 months.
Accessed October 30, 2026
- Istat rights
Istat rights: Default CC BY 4.0; attribution and adaptations disclosed; no logo rights or endorsement.
Accessed October 30, 2026
Cite & reuse this study
Alisson Bento. Regional genre profiles in Italy: distances from the national picture, 2024. Secondary analysis of Istat, I cittadini e il tempo libero, reference year 2024, Table 10. Sources accessed October 30, 2026. https://alissonbento.com/research/italy-regional-genre-profiles-2024/
Source: Istat, Indagine I cittadini e il tempo libero, reference year 2024, Table 10. Source data licensed under Creative Commons Attribution 4.0, https://creativecommons.org/licenses/by/4.0/. Official release: https://www.istat.it/tavole-di-dati/lettura-di-libri-e-generi-di-libri-letti-scrittura-di-libri-prelettura-dei-bambini-di-0-5-anni-ascolto-di-podcast-anno-2024/ Calculations and English explanation: Alisson Bento. Extraction, English category labels, signed differences and profile-distance calculations are adaptations. No endorsement by Istat is implied. No Istat logo is used. Third-party and logo exclusions in Istat legal terms remain applicable. Legal terms: https://www.istat.it/note-legali/
Corrections or editorial questions