
A bounded application of the published PISA 2018 tables
Reading as a hobby, talking about books, reading under obligation, reading only for needed information and dismissing reading as wasted time are different statements. A reader can recognize that distinction without assuming that every statement produces a wholly different statistical picture. This study asks a narrower empirical question: within the same published PISA 2018 table, how much does the girls-minus-boys agreement gap vary when the statement changes? It analyzes official aggregate estimates for the surveyed, PISA-eligible school population, not all residents, adults or individual questionnaire records, and does not assign anyone to a reader type.
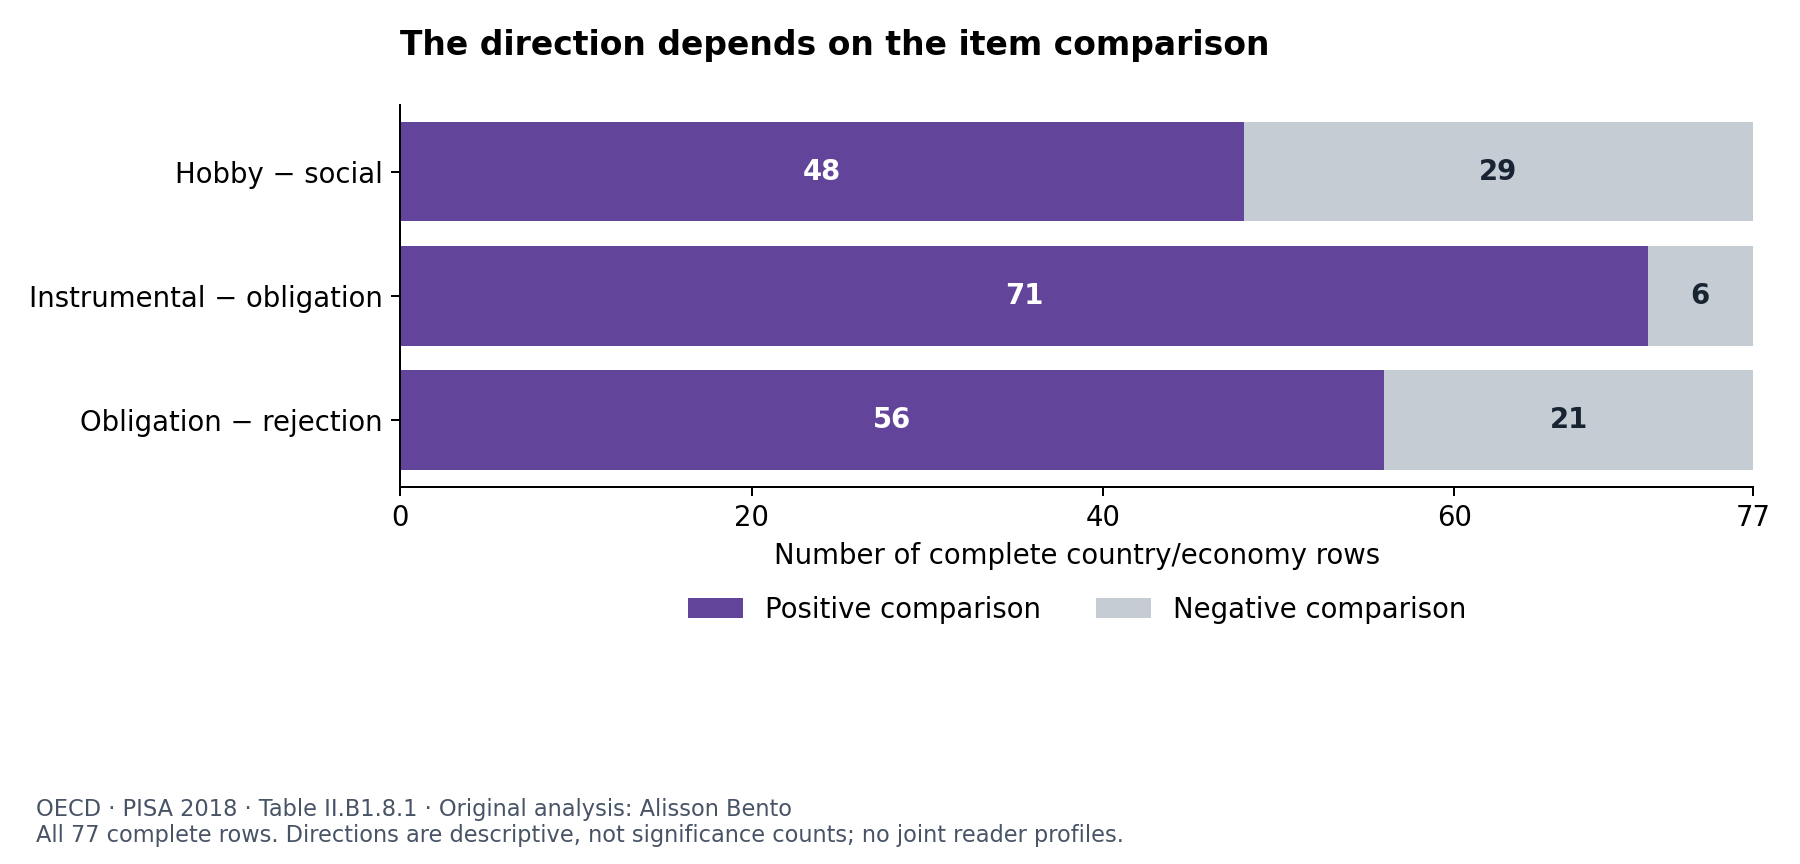
Across the 77 country and economy rows with complete data, the instrumental-versus-obligation comparison has the same descriptive direction in 71 rows. Its median difference is 2.8 percentage points. The hobby-versus-social comparison is less uniform: its difference is positive in 48 rows and negative in 29, with a median of 0.5 points. These are summaries of a finite collection of published estimates. They are not estimates for a world population, evidence of the same pattern in every school, or proof that one response causes another.
The practical result is therefore not a new ranking of readers. It is a reason to preserve the identity of the attitude item when reporting a gender gap. The same table can support a relatively small contrast on one attitude and a larger contrast on another. An overall reading-enjoyment index may serve its intended purpose, but a statement about that index does not erase the meaning of its component questions. Conversely, differences between component gaps do not invalidate the index or demonstrate separate psychological dimensions.
Source, scope and complete comparisons
The evidence is OECD's original spreadsheet for Annex B1.8 of PISA 2018 Results, Volume II, specifically Table II.B1.8.1. The complete workbook was retrieved through the official annex's StatLink, DOI 10.1787/888934038723. The secured version identifies itself as version 2, last updated on 2 December 2019. It supplies separate agreement percentages for boys and girls, their standard errors, and directly published girls-minus-boys differences with corresponding standard errors. The analysis uses those published differences, rather than reconstructing uncertainty under an assumption of independent samples.
The analysis covers five items, all designated country/economy rows and three fixed within-row comparisons, with explicit rules for missing information, signs and the technical-standard sensitivity check. It is a retrospective analysis of published estimates, rather than a blinded or prospectively registered experiment. Every eligible row and all three comparisons remain in the downloadable results. The examples in the article illustrate that complete analysis; they do not define a second selectively reported test family. Independent reproduction checks the source-cell mapping and arithmetic, but does not establish the historical timing of the original analytical choices.
There are 79 designated country/economy rows. Lebanon and North Macedonia contain the source's missing code for all five items, leaving 77 complete rows. The missing rows remain in the audit record and are not converted into zero agreement or zero difference. Three OECD-average rows are excluded from country summaries. The separately reported OECD average for 37 countries is retained only as a descriptive benchmark, not inserted as another country observation or screened alongside country contrasts.
The geographic units require care. Baku is not Azerbaijan nationally, and B-S-J-Z is not all of China. The source also lists economies separately. These rows are retained with their original labels rather than silently standardized into national populations. No overlapping geographic total is created, and no person-weighted international mean is calculated. A median across the available rows describes those rows with equal weight; it does not describe the experience of a randomly chosen student worldwide.
What the five analytical labels mean
The study uses brief original labels to keep the statistical discussion readable. “Hobby” concerns agreement that reading is a favourite pastime. “Social” concerns liking conversations about books. “Obligation” concerns reading only when required. “Instrumental” concerns reading only for needed information. “Rejection” concerns treating reading as wasted time. These labels summarize meanings for analysis; they are not replacements for the original questionnaire, official translated item names or a newly validated measurement scale. Exact wording remains available in the linked primary source.
The reported outcome is the combined percentage agreeing or strongly agreeing. It is not the percentage reading books, finishing books, buying books or reading a specified number of minutes. Nor is the absence of agreement an affirmative response to the opposite proposition. Someone who does not call reading a favourite hobby might still enjoy particular texts. Someone who does not dismiss reading as wasted time need not regard it as a favourite activity. Needed information can be valuable in its own right.
The social item also refers specifically to books, while the surrounding reading-attitude construct is broader. That difference should not disappear inside a generic label such as “motivation.” The present analysis does not try to separate wording effects from substantive differences in attitudes. Both remain possible contributors to the observed item-specific gaps. Resolving them would require evidence beyond the published marginals used here, such as a suitable measurement model and the necessary joint response information.
Literal gaps and a limited sign convention
Every literal gender gap is girls' agreement percentage minus boys' agreement percentage. A positive hobby gap means greater reported agreement among girls. A negative obligation gap means lower reported agreement among girls. Retaining those literal signs prevents an attractive but misleading presentation in which negative agreement statements are treated as though they had the same direction as positive statements.
For the three cross-item comparisons only, the analysis reverses the signs of the obligation, instrumental and rejection gaps. This makes their direction comparable with the hobby and social gaps: a positive oriented value represents higher agreement among girls on the two positive statements or lower agreement among girls on the three negative statements. It is a bookkeeping convention, not a claim that these responses have identical value or psychological meaning. The five values are never added into a new score.
The fixed comparisons are hobby minus social, instrumental minus obligation, and obligation minus rejection, using the oriented gaps. Their units are percentage points. For example, an instrumental-minus-obligation difference of 3 points means that the gender gap in instrumental-only agreement is 3 points larger in the reversed direction than the corresponding obligation-only gap. It does not mean that 3% of respondents changed attitude, or that the difference identifies an additional group of readers.
Hobby and book conversation do not give one fixed contrast
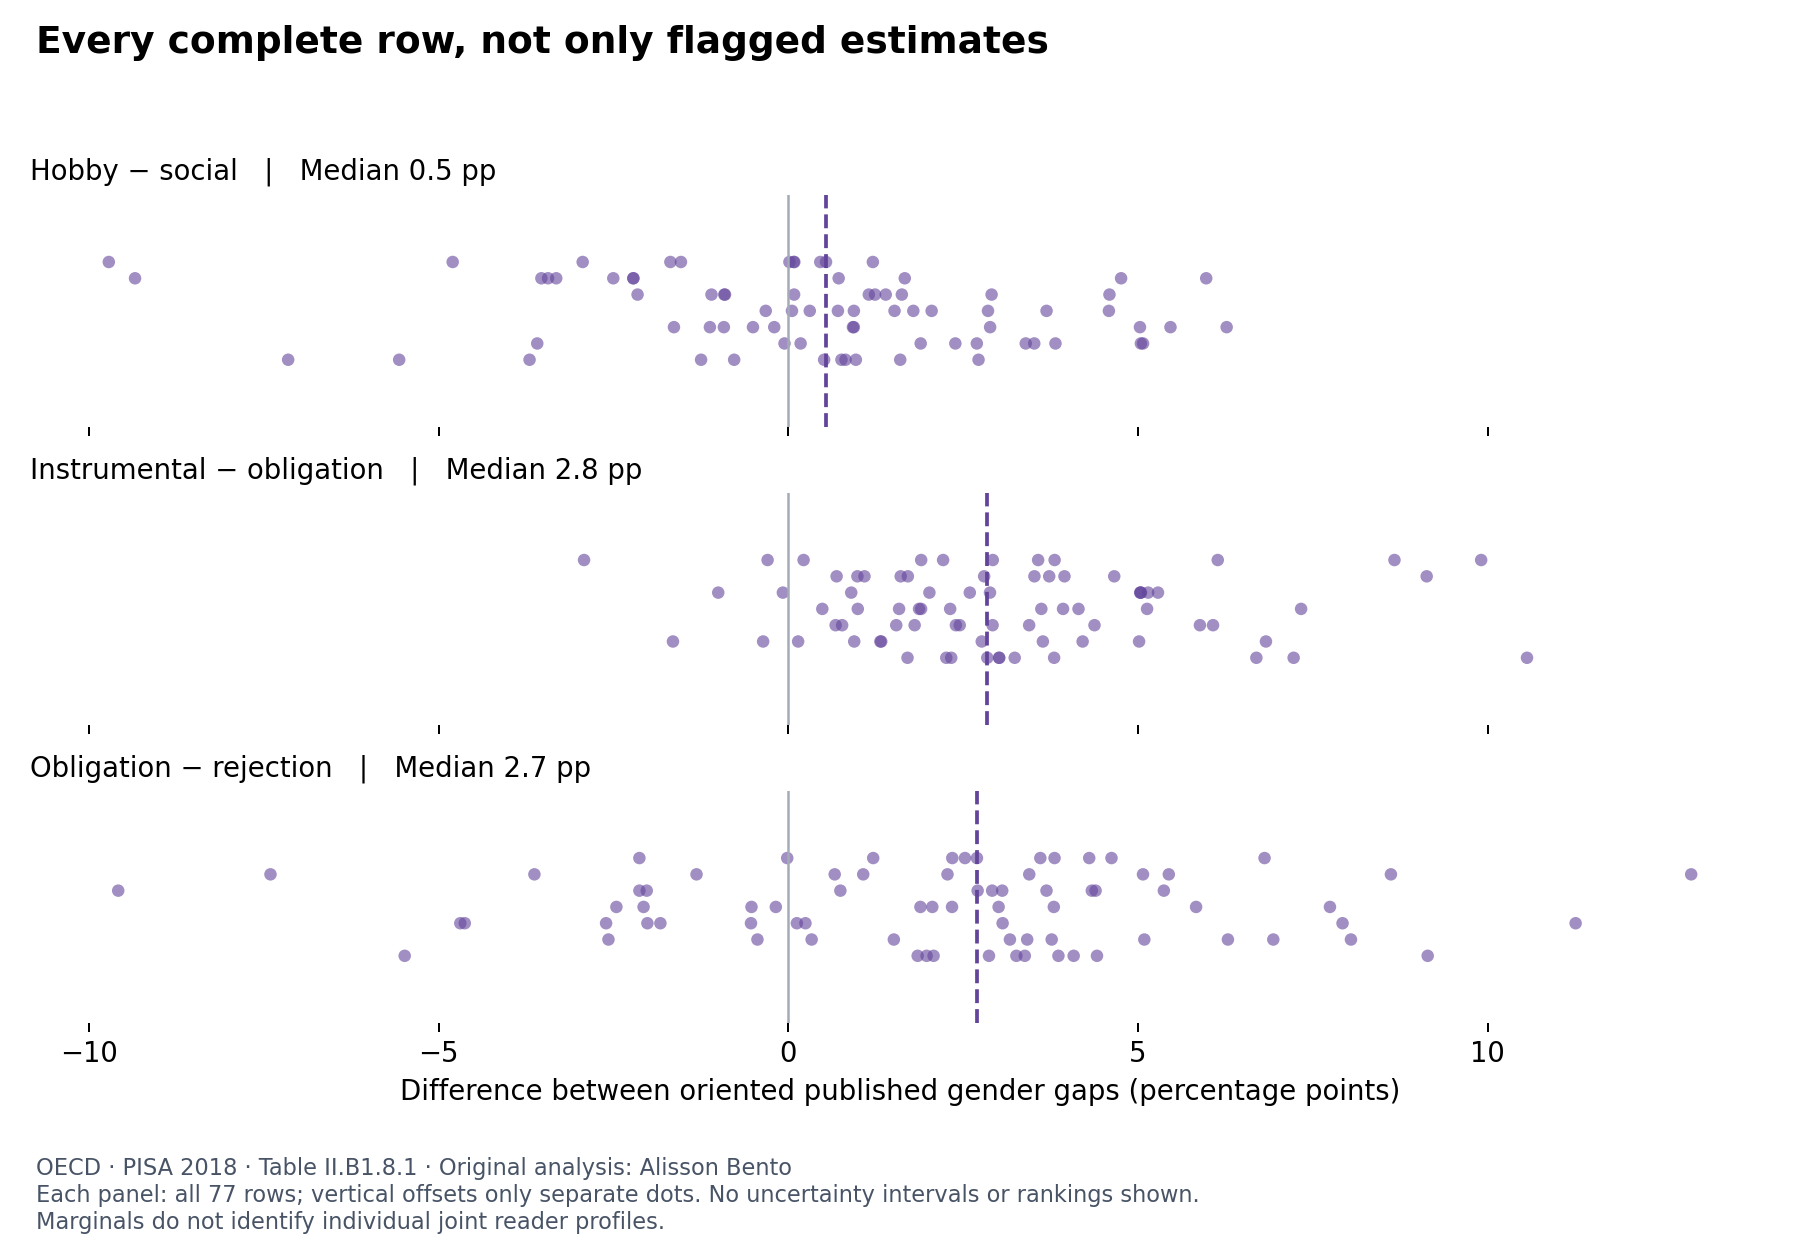
The hobby-minus-social difference is positive in 48 of the 77 complete rows and negative in 29. Its median is 0.5 percentage points, with observed values from −9.7 to 6.3 points. That mixed direction is important. A small median does not establish interchangeability: differences can run in opposite directions and partly cancel in a summary. Equally, the existence of a range does not establish that every row's difference is distinguishable from sampling variation.
Cyprus illustrates the distinction without defining the analysis. Its literal hobby gap is 7.8 points, compared with 17.5 points for the social item. Their difference is −9.7 points. Girls' agreement is higher than boys' on both items, yet the size of that contrast depends considerably on which statement is named. The finding does not show that the same girls like conversation but dislike reading, because the table does not report the joint distribution of their answers.
There is also no contradiction between higher agreement levels on an item and a smaller gender gap on it. A gap compares two groups within an item; an agreement level describes one group. Keeping both percentages in the downloadable data allows readers to inspect that distinction. Reporting only a gap would otherwise conceal whether it arises alongside relatively common or relatively uncommon agreement.
Needed information and obligation are not synonyms
The instrumental-minus-obligation difference is positive in 71 rows and negative in six. Its median is 2.8 points, with observed values from −2.9 to 10.6 points. This is a much more consistent descriptive direction than the hobby-versus-social comparison. It remains a finite pattern of estimates, not a universal law. The six rows with the opposite direction are retained rather than explained away or removed.
Brazil provides a concrete example. Boys' and girls' instrumental-only agreement is approximately 62.3% and 41.6%, yielding a literal gap of −20.7 points. Their obligation-only agreement is approximately 29.5% and 19.4%, yielding a gap of −10.1 points. After the stated sign reversal, the instrumental gap exceeds the obligation gap by 10.6 points. The two statements therefore do not provide the same numerical description of the gender contrast in this row.
These percentages must not be subtracted to estimate an “information-only but not obligation-only” population. The same people may agree with both statements, with neither, or with one. Marginal agreement percentages cannot determine those intersections. The useful conclusion is at the reporting level: a summary about reading only for information should not be paraphrased as a summary about reading only when required, even though both statements contain a restrictive purpose.
Obligation and rejection also separate
The obligation-minus-rejection difference is positive in 56 rows and negative in 21. Its median is 2.7 points, with observed values from −9.6 to 12.9 points. The direction is less uniform than the instrumental-versus-obligation contrast but more uniform than hobby versus social. These differences are descriptive comparisons among the fixed items; the counts are not treated as independent Bernoulli trials or converted into a probability that a new country will follow the same pattern.
Belarus illustrates a large observed difference. Its literal obligation gap is −25.2 points, while its rejection gap is −12.3 points. The oriented obligation gap is therefore 12.9 points larger. This does not justify calling respondents who report obligation “rejecting readers.” Reading when required and dismissing reading's value are different positions, and the table contains no evidence that they identify identical respondent groups.
The full five-item range reinforces the need to name the item. Across complete rows, the median difference between the largest and smallest oriented gap is 7.6 points; the smallest observed range is 1.3 points and the largest is 16.7 points. These ranges were fixed as descriptive summaries. They select within-row maxima and minima, so they are not accompanied by a claim that every selected spread is statistically established or that the widest spread identifies a uniquely exceptional country.
What uncertainty permits—and what it does not
The source provides the standard error of each published gender gap, but not the covariance between two different item gaps. Assuming their independence would be unjustified. The same survey respondents and design contribute to several estimates. The study therefore retains the directly published uncertainty and uses a deliberately conservative bound for the optional comparison screen: the standard error of a difference cannot exceed the sum of the two component standard errors.
Under a normal approximation, the screen uses that upper bound and a Bonferroni cutoff for all 231 eligible country comparisons. The cutoff is approximately 3.699, not 1.96. Ten comparisons exclude zero under this approximate covariance-bound screen: one hobby-versus-social comparison, three instrumental-versus-obligation comparisons and six obligation-versus-rejection comparisons. The other 221 comparisons are inconclusive under this demanding rule. They are not evidence that the items are equivalent or that the true differences are zero.
The ten flagged comparisons are Cyprus for hobby minus social; Brazil, Qatar and Turkey for instrumental minus obligation; and Albania, Belarus, Brunei Darussalam, Peru, Spain and Turkey for obligation minus rejection. This complete list avoids highlighting only attractive examples. It is an approximate screen, not exact design-based survey significance. Normal approximation, estimated standard errors and source precision all limit its interpretation. Its conservatism also means that a lack of a flag is a weak basis for asserting sameness.
Two boundaries are especially close to zero: Cyprus's upper limit is about −0.016 points, and Turkey's obligation-minus-rejection lower limit is about 0.062 points. They should not be presented as decisive discoveries on the strength of a rounded table. Computations retain the precision stored in the original workbook, which is not a guarantee of access to unrounded underlying estimates. Main percentage and percentage-point summaries use one decimal place; near-zero screen endpoints retain extra precision to preserve their sign. Machine-readable outputs preserve stored precision and the calculation rule.
A fixed technical-standard check
The source marks Hong Kong (China), the Netherlands, Portugal and the United States because their data did not meet PISA technical standards but were accepted as largely comparable. The main analysis retains them transparently. The fixed sensitivity analysis removes these four rows and retains the original full-family screening cutoff. It does not reduce the threshold after seeing the results or reinterpret the source's caution as proof that the data are unusable.
The sensitivity set has 73 complete rows. Hobby minus social is positive in 46 and negative in 27, with a median of 0.7 points. Instrumental minus obligation is positive in 67 and negative in six, with a median of 2.9 points. Obligation minus rejection is positive in 55 and negative in 18, also with a median of 2.9 points. The same ten comparisons remain flagged. This check addresses one documented source caution; it does not eliminate every possible concern about response styles, translation or cross-system comparability.
A reporting application, not a prescription for readers
A library, journalist or researcher discussing these data can improve accuracy simply by stating which attitude is being described. A hobby gap is not automatically a conversation gap. An information-only gap is not automatically an obligation gap. The data support keeping these distinctions visible in tables, captions and prose rather than converting every item into a single unqualified statement about who “likes reading.”
The results do not establish which invitation, programme or teaching practice would change any attitude. They do not support gender-specific book prescriptions, claims about reader age, conclusions about reading difficulty or causal explanations of survey differences. The analysis neither tests a literacy intervention nor links these marginals to achievement. It also does not extend the 2018 findings into a contemporary trend or connect them to website visitors or book customers.
The reproducible contribution is a bounded application of complete official aggregate evidence: source-identified items, fixed support, three transparent comparisons, explicit missing information and uncertainty that does not invent covariance. Its value lies in making an apparently simple reading-attitude statement harder to misquote. The most defensible conclusion is correspondingly specific: within this published 2018 table, the size and sometimes the ordering of item-specific gender contrasts differ, so the name and meaning of the item must travel with the number.
Source and reproducibility
Independent calculations from OECD (2019), PISA 2018 Database, Table II.B1.8.1, Annex B1.8, PISA 2018 Results, Volume II, https://doi.org/10.1787/888934038723, accessed 31 October 2026. Original data and original publication remain OECD sources; this analysis is independent and does not imply OECD endorsement. The data-only download, code and methods retain source attribution. The original source workbook is linked, not republished as a questionnaire or publication asset.
How often the fixed item comparison is positive
Count of complete source rows where the first oriented gender gap exceeds the second.
Full chart and source

Scroll horizontally to inspect the chart. ↔
Chart and values
Scroll horizontally to see all columns.
| Oriented gap comparison | Complete rows | Positive differences | Negative differences | Median difference (pp) |
|---|---|---|---|---|
| Hobby − social | 77 | 48 | 29 | 0.5 |
| Instrumental − obligation | 77 | 71 | 6 | 2.8 |
| Obligation − rejection | 77 | 56 | 21 | 2.7 |
All 77 complete country/economy rows; equal-row descriptive summaries, not population estimates or significance counts. Negative-item gaps are sign-reversed only for comparison, not combined into a new scale. Percentage-point medians use one decimal place. Independent calculations from OECD PISA 2018 Table II.B1.8.1.

Median differences between the fixed item gaps
Equal-row medians of oriented gap differences; not an international student average.
Full chart and source
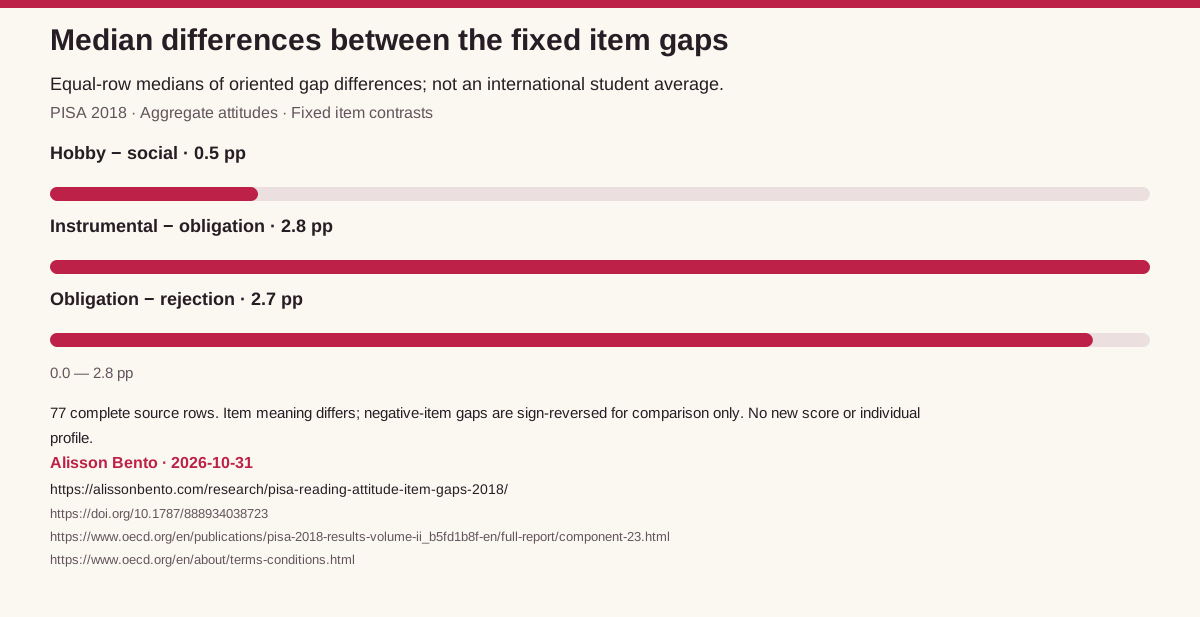
Scroll horizontally to inspect the chart. ↔
Chart and values
Scroll horizontally to see all columns.
| Oriented gap comparison | Complete rows | Positive differences | Negative differences | Median difference (pp) |
|---|---|---|---|---|
| Hobby − social | 77 | 48 | 29 | 0.5 |
| Instrumental − obligation | 77 | 71 | 6 | 2.8 |
| Obligation − rejection | 77 | 56 | 21 | 2.7 |
All 77 complete country/economy rows; equal-row descriptive summaries, not population estimates or significance counts. Negative-item gaps are sign-reversed only for comparison, not combined into a new scale. Percentage-point medians use one decimal place. Independent calculations from OECD PISA 2018 Table II.B1.8.1.
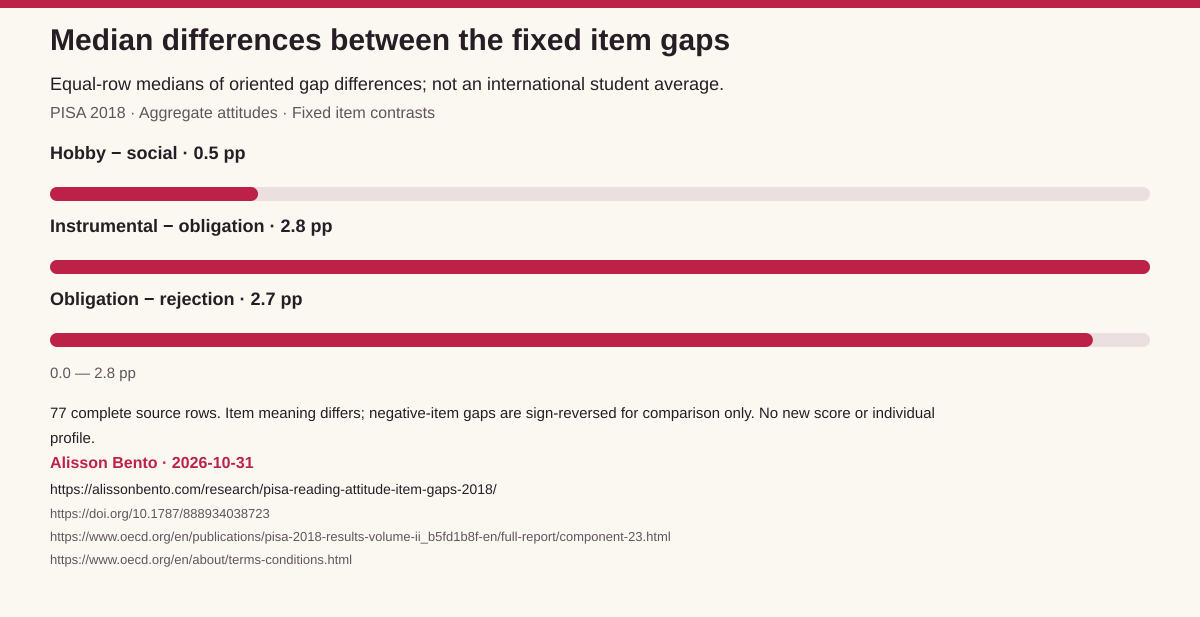
Data & downloads


Scroll horizontally to see all columns.
| Oriented gap comparison | Complete rows | Positive differences | Negative differences | Median difference (pp) |
|---|---|---|---|---|
| Hobby − social | 77 | 48 | 29 | 0.5 |
| Instrumental − obligation | 77 | 71 | 6 | 2.8 |
| Obligation − rejection | 77 | 56 | 21 | 2.7 |
All 77 complete country/economy rows; equal-row descriptive summaries, not population estimates or significance counts. Negative-item gaps are sign-reversed only for comparison, not combined into a new scale. Percentage-point medians use one decimal place. Independent calculations from OECD PISA 2018 Table II.B1.8.1.
Scroll horizontally to see all columns.
| Country/economy/source unit | Hobby − social (pp) | Instrumental − obligation (pp) | Obligation − rejection (pp) |
|---|---|---|---|
| Australia | 0.8 | 3.2 | 2.1 |
| Austria | 3.8 | 5.0 | 3.2 |
| Belgium | 0.9 | 0.8 | 0.1 |
| Canada | 2.0 | 3.6 | 2.3 |
| Chile | −1.1 | 2.0 | 4.3 |
| Colombia | 0.7 | 3.9 | 5.4 |
| Czech Republic | 0.1 | −2.9 | −0.0 |
| Denmark | −7.2 | 7.2 | 3.3 |
| Estonia | 2.7 | −1.7 | 6.3 |
| Finland | −1.1 | 1.5 | 0.2 |
| France | 0.9 | 2.3 | −0.2 |
| Germany | 1.1 | −0.1 | 4.4 |
| Greece | −9.3 | 1.0 | 8.6 |
| Hungary | 0.0 | 3.8 | 3.8 |
| Iceland | −5.6 | 3.8 | 3.4 |
| Ireland | −3.6 | 2.8 | 3.8 |
| Israel | 2.9 | 4.4 | −0.5 |
| Italy | 4.6 | 7.3 | 2.1 |
| Japan | 2.9 | 2.9 | 2.7 |
| Korea | −3.3 | 4.7 | −1.3 |
| Latvia | −1.5 | 1.9 | 3.6 |
| Lithuania | 1.0 | 2.3 | −5.5 |
| Luxembourg | 0.2 | 0.9 | 1.5 |
| Mexico | −0.9 | 1.8 | 7.9 |
| Netherlands* | 0.1 | 1.9 | −2.1 |
| New Zealand | −0.9 | 0.9 | 2.9 |
| Norway | −2.2 | 1.1 | 0.7 |
| Poland | 0.5 | 3.6 | 2.3 |
| Portugal* | −3.7 | 6.7 | 2.0 |
| Slovak Republic | 2.4 | −0.4 | 5.1 |
| Slovenia | −1.6 | 3.4 | −2.6 |
| Spain | 0.7 | 1.9 | 5.8 |
| Sweden | 1.2 | −1.0 | 3.7 |
| Switzerland | 1.7 | 2.8 | 1.1 |
| Turkey | 0.5 | 9.9 | 6.8 |
| United Kingdom | −0.8 | 2.3 | 3.9 |
| United States* | −0.1 | 1.3 | −0.4 |
| Albania | 0.9 | 2.5 | 11.3 |
| Argentina | 1.8 | 1.6 | 1.9 |
| Baku (Azerbaijan) | −0.9 | 5.3 | −2.0 |
| Belarus | −3.4 | 0.7 | 12.9 |
| Bosnia and Herzegovina | −1.7 | −0.3 | 4.3 |
| Brazil | 0.5 | 10.6 | 2.9 |
| Brunei Darussalam | 1.9 | 4.2 | 6.9 |
| B-S-J-Z (China) | −0.5 | 5.9 | 3.1 |
| Bulgaria | 3.7 | 4.1 | −0.5 |
| Costa Rica | 1.6 | 5.0 | 5.4 |
| Croatia | −2.2 | 1.6 | −3.6 |
| Cyprus | −9.7 | 0.2 | −2.1 |
| Dominican Republic | −1.2 | 2.8 | 4.4 |
| Georgia | 5.0 | 0.1 | 3.4 |
| Hong Kong (China)* | 5.0 | 0.7 | −1.8 |
| Indonesia | 2.9 | 3.9 | −2.5 |
| Jordan | 4.6 | 5.0 | −9.6 |
| Kazakhstan | −2.5 | 3.7 | 2.3 |
| Kosovo | 0.1 | 8.7 | 4.6 |
| Lebanon | m | m | m |
| Macao (China) | 2.7 | 3.0 | 1.8 |
| Malaysia | 5.1 | 3.6 | 8.0 |
| Malta | 5.5 | 2.9 | −2.0 |
| Moldova | 1.5 | 1.0 | 7.7 |
| Montenegro | −2.2 | 2.6 | 3.1 |
| Morocco | 4.8 | 1.7 | 3.4 |
| North Macedonia | m | m | m |
| Panama | 1.2 | 6.1 | 2.7 |
| Peru | 1.6 | 1.7 | 9.1 |
| Philippines | 3.4 | 6.8 | −2.6 |
| Qatar | −0.2 | 6.1 | −4.7 |
| Romania | −0.3 | 0.5 | 3.0 |
| Russia | 1.4 | 5.0 | 0.7 |
| Saudi Arabia | −3.5 | 9.1 | −7.4 |
| Serbia | −4.8 | 2.2 | 1.2 |
| Singapore | 0.8 | 3.0 | 4.1 |
| Chinese Taipei | 3.5 | 1.3 | 0.3 |
| Thailand | 6.3 | 2.4 | −4.6 |
| Ukraine | 0.3 | 5.1 | 3.8 |
| United Arab Emirates | 0.1 | 5.1 | −2.1 |
| Uruguay | 6.0 | 3.5 | 5.1 |
| Viet Nam | −2.9 | 2.9 | 2.5 |
All 79 designated source rows remain visible. Values are oriented gap differences in percentage points, rounded to one decimal; m retains the source missing code, not zero. An asterisk marks the four source technical-standard cautions. Source labels are retained; rows are not a world population or an additive geographic partition.
Evidence & method
How we calculated it
- Original aggregate OECD worksheet, version 2 dated 2 December 2019. Retrospective analysis of the complete designated 79-row support and three fixed item comparisons; no claim of blinded design or prospective registration.
- Literal gap = girls agreement minus boys agreement. For comparison only, reverse obligation/instrumental/rejection signs; no new validated scale.
- Use directly published gap SEs. Secondary screen uses covariance-bound SE sum and Bonferroni normal cutoff 3.699 across 231 comparisons.
- Keep OECD average 37 descriptive; exclude it from country summaries. Missing source rows remain missing; remove four caution rows only in fixed sensitivity.
What the data cannot tell us
- Country/economy/subnational rows are not a random sample of countries or a world population.
- Marginals do not identify joint respondent profiles or causal effects. No age prescriptions, difficulty or achievement inference.
- Cross-item covariance unavailable; approximate screen is not exact design-based significance. Near-zero Cyprus/Turkey endpoints require caution; non-exclusion does not imply equivalence.
- No trend inference beyond 2018 and no OECD endorsement. Source precision is stored precision, not asserted unrounded underlying precision.
Original sources
- OECD (2019), PISA 2018 Results Volume II, Table II.B1.8.1
OECD Table II.B1.8.1 supplies the published 2018 agreement marginals, gender gaps and directly published standard errors. Missing rows remain missing; technical-standard cautions apply to Hong Kong (China), Netherlands, Portugal and United States, and the fixed sensitivity retains 73 complete rows.
Accessed October 31, 2026
- OECD Annex table index
The official OECD annex index links DOI 10.1787/888934038723 to the original chapter workbook. The secured workbook identifies version 2, last updated 2 December 2019; retrieval in 2026 is not a new observation wave.
Accessed October 31, 2026
- OECD terms and conditions
OECD terms section 3 governs attributed data reuse, subject to additional restrictions. Written-content and special-product rights remain separate: original analysis/data-only scope, brief analytic labels, no questionnaire reproduction or official translation claim, and no endorsement.
Accessed October 31, 2026
Cite & reuse this study
Alisson Bento. Five reading attitudes, not one interchangeable gender gap. Independent analysis of OECD (2019), PISA 2018 Database, Table II.B1.8.1, Annex B1.8, PISA 2018 Results Volume II, DOI 10.1787/888934038723 (accessed 31 October 2026). https://alissonbento.com/research/pisa-reading-attitude-item-gaps-2018/
Original independent statistical analysis and attributed aggregate data only. Brief analytic labels are not official questionnaire translations. Original workbook/questionnaire prose is linked, not republished. Retain OECD attribution when reusing derived data.
Corrections or editorial questions