
Two different pictures of the same industry
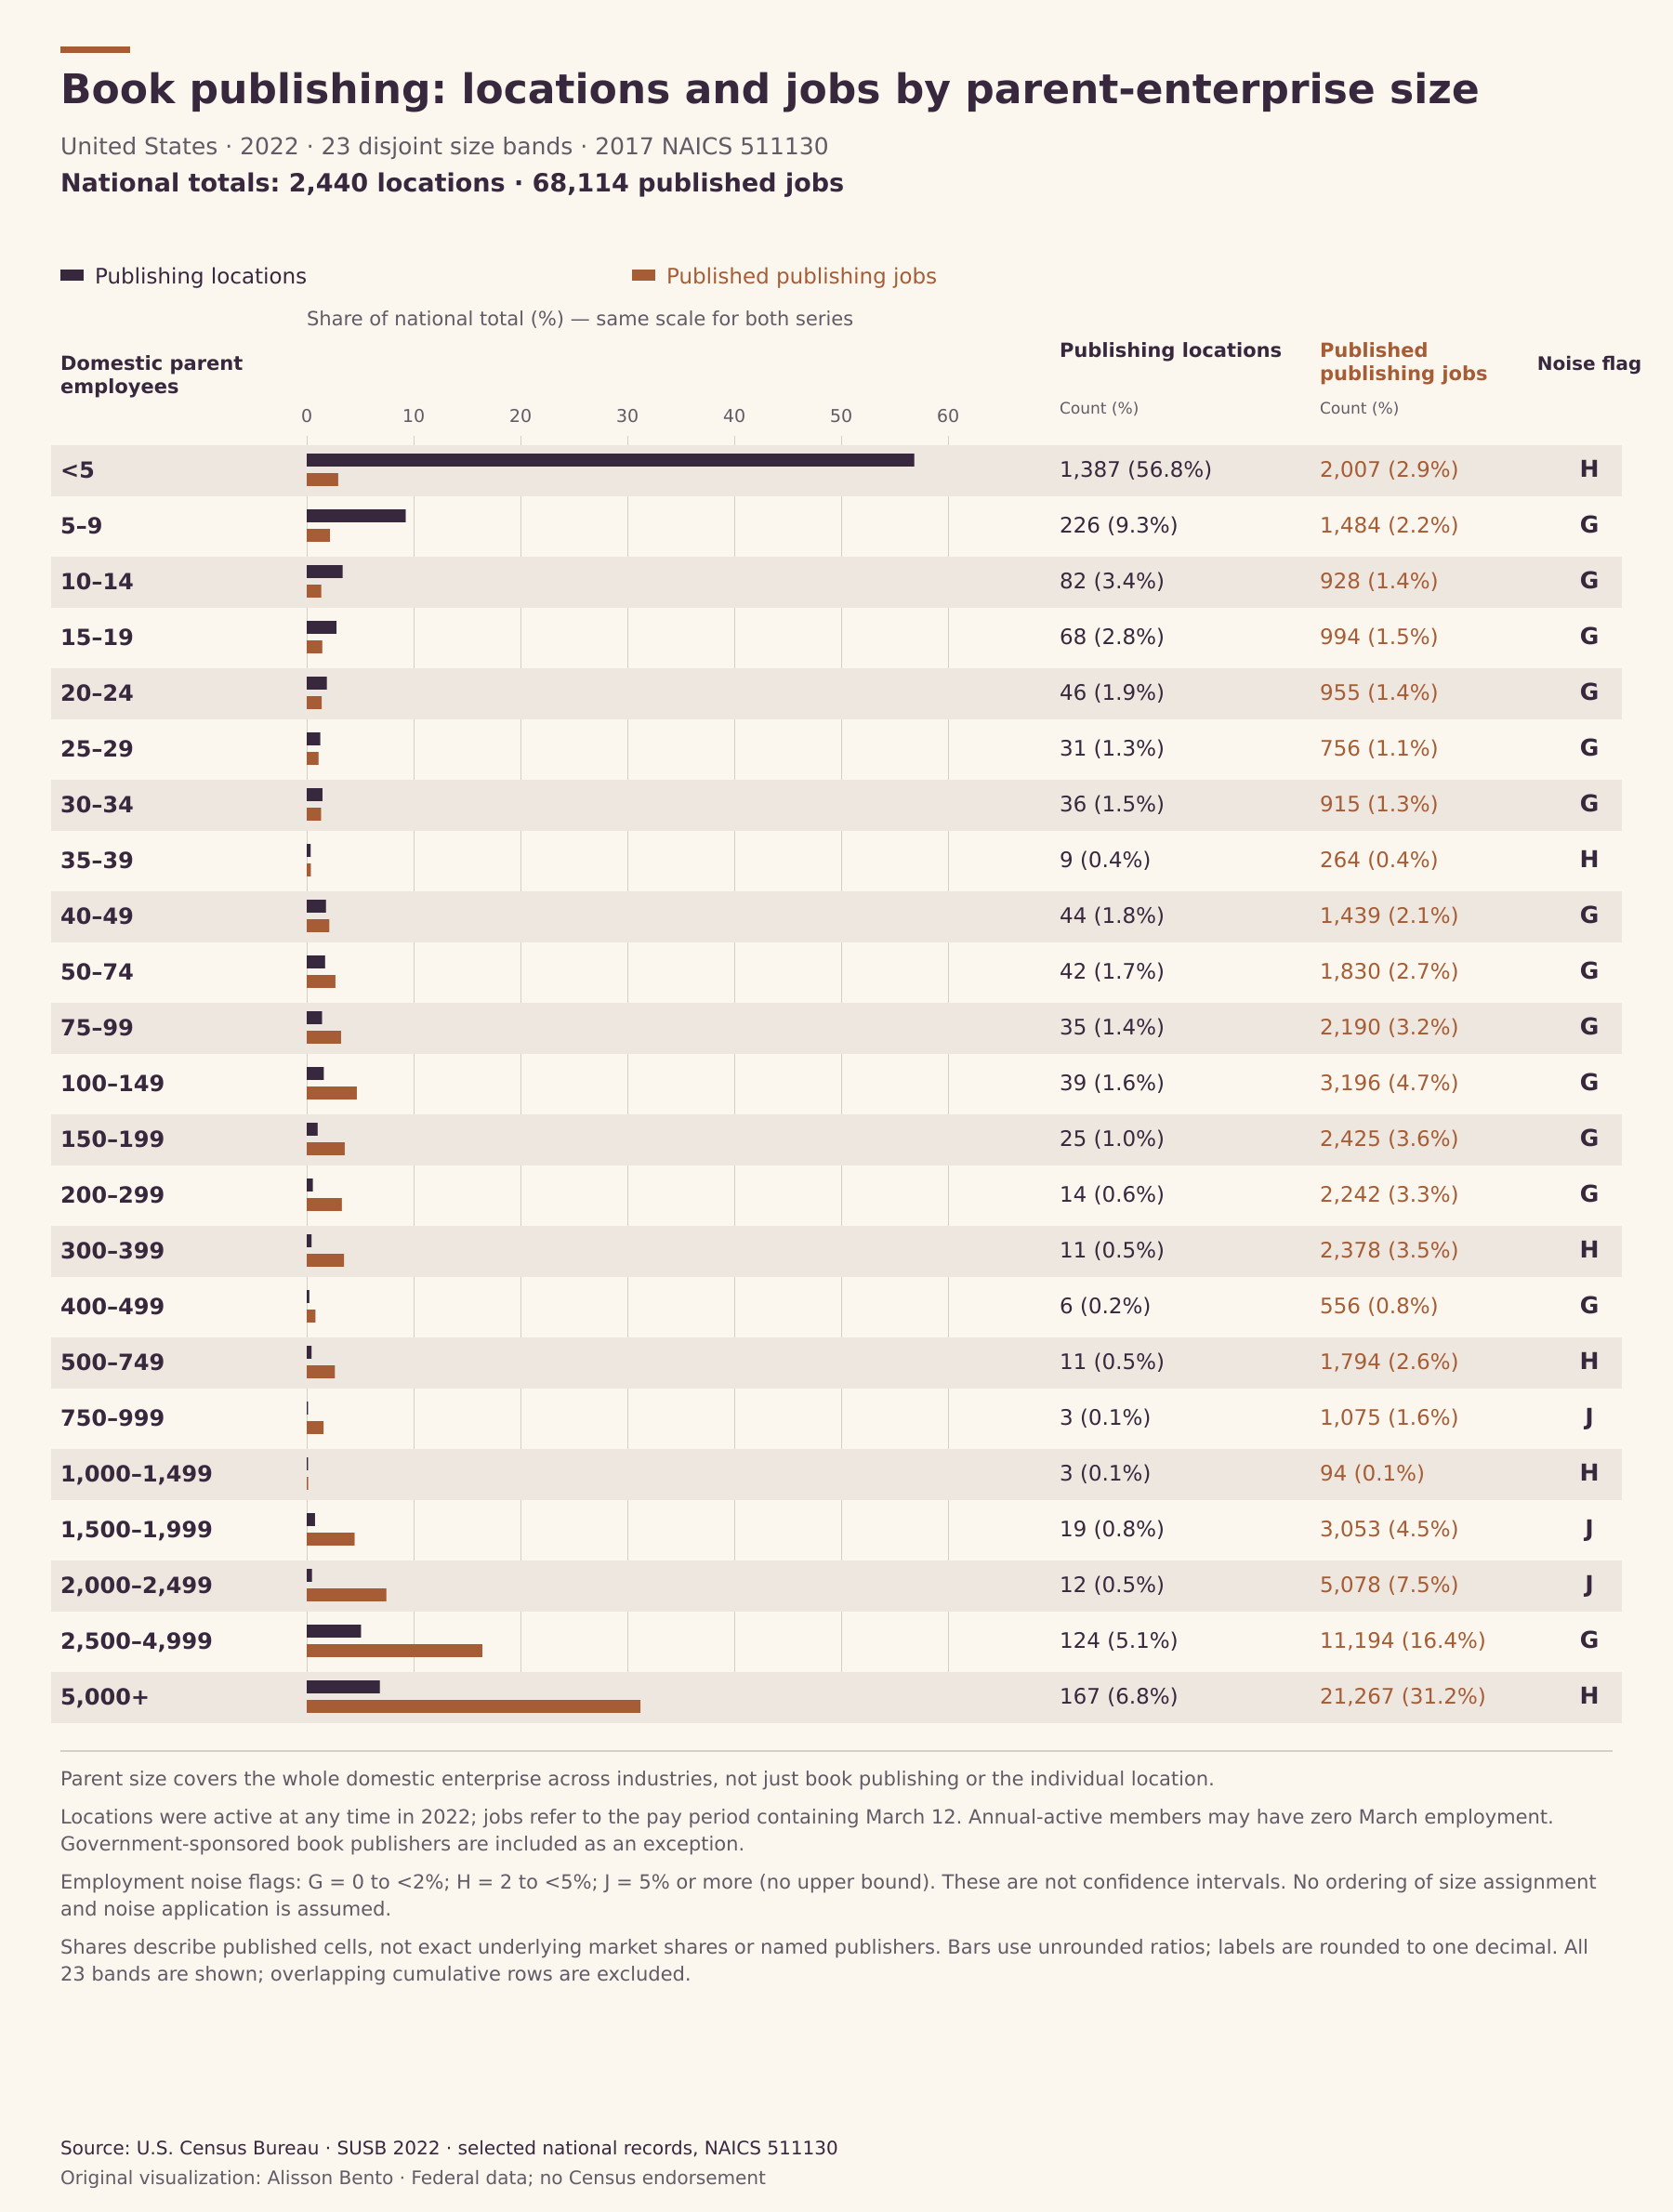
Counting workplaces and counting payroll jobs produce sharply different pictures of U.S. book publishing. In the published 2022 Statistics of U.S. Businesses data, enterprises with fewer than 20 domestic employees account for 72.3% of book-publishing establishments but 7.9% of book-publishing employment. Enterprises with at least 500 domestic employees account for 13.9% of those establishments and 63.9% of the published employment. The contrast concerns where publishing activity sits within enterprise size bands, not the market shares of particular publishers.
The denominator is 2,440 employer establishments for the location shares and 68,114 published payroll employees for the employment shares. Each percentage divides a size-band value by the corresponding national industry total. It does not divide publishing jobs by all the jobs in their parent enterprises. The employment values have been modified for disclosure protection, so these are shares of published employment, not exact shares of confidential underlying employment.
This question differs from asking whether publishing jobs have recovered over time or whether bookstores tend to occupy small workplaces. Here, a single national snapshot connects the book-publishing workplace to the employment size of its parent enterprise. An establishment can be small even when its parent organization is large. The table therefore measures an organizational structure that an establishment count alone cannot describe.
The parent includes more than the publishing operation
Census defines enterprise size using the summed employment of associated domestic establishments under common ownership or control. Those establishments can operate in different industries. A publishing location can therefore appear in a large-enterprise band even when relatively few of its parent’s employees work in book publishing. The size label is domestic enterprise employment, not worldwide headcount, employment at one location, or the size of a publishing imprint.
The source is tabulated by establishment industry. Only establishments classified as book publishers contribute their employment and locations to this analysis. Other activities inside the same enterprise determine its size category but do not become book-publishing employment simply because the enterprise owns a publishing operation. Conversely, an enterprise need not be classified primarily as a publisher to have a book-publishing establishment in this table.
This distinction prevents a misleading reading of the result as a list of large publishers and their shares. The data contain aggregate size bands, not named enterprises, ownership chains or independent-publisher classifications. They do not reveal the share of book sales, titles, profits or readership controlled by any organization. No top-company concentration ratio or market-power claim can be calculated from these bands.
Small-enterprise locations and large-enterprise employment
The fewer-than-20 group contains 1,763 publishing establishments and 5,413 published publishing employees. Its employment share is 64.3 percentage points below its establishment share. The difference says that a large share of the industry’s locations sits within very small domestic enterprises, while a much smaller share of the published payroll employment does. It does not say that each of those locations has the same staff size or publishes the same number of books.
At the broader threshold of fewer than 500 employees, the source reports 2,101 publishing locations and 24,559 published publishing employees. Those are 86.1% and 36.1% of their respective national totals. The at-least-500 group contains 339 locations and 43,555 published employees, calculated by summing seven fully published, mutually exclusive bands. Its 63.9% employment share exceeds its 13.9% location share by 50.1 percentage points.
The upper bands provide additional detail without identifying individual businesses. Enterprises with at least 2,500 domestic employees account for 291 publishing locations, or 11.9%, and 32,461 published publishing employees, or 47.7%. Within that group, the 5,000-or-more band contributes 167 locations and 21,267 published publishing employees: 6.8% and 31.2%, respectively. These are descriptions of the released table, not estimates of how much publishing would move if an enterprise changed ownership.
A year of employer locations, a March payroll snapshot
The two denominators follow different timing conventions. Establishments are locations with paid employees at some point during 2022. Employment refers to full-time and part-time employees on payroll in the pay period containing March 12, 2022. It is not an annual average, a count of full-time-equivalent positions or a count of people employed at any time during the year.
An employer can have no paid employees in that March pay period but have paid employees elsewhere in the year. Census retains such annual-active establishments, and zero-March enterprises remain part of the employer size distribution. The fewer-than-five band must not be rewritten as one to four employees. The data do not separately identify how much of that band consists of zero-March employers, and this analysis does not infer it.
The share comparison deliberately contrasts annual-active locations with March payroll employment. It should not be turned into a precise measure of year-round staffing at a typical publishing office. Nonemployer businesses are outside SUSB, and sole proprietors and partners are not included in the employee measure. Freelance work and self-publishing are consequently not comprehensively represented. These 68,114 payroll employees must not be directly compared with the BLS Industry Productivity employment series as if the two sources had the same universe and timing.
Which book publishing is included
The latest SUSB year listed in the public dataset index when checked on October 30, 2026 was 2022, released in April 2025. Despite the reference year, this release uses the 2017 North American Industry Classification System. The selected industry is 511130, Book Publishers. This analysis does not relabel it as 2022-NAICS 513130 or combine the two classifications.
In the 2017 definition, recognized book publishers carry out activities such as design, editing and marketing for producing and distributing print, electronic or audio books. Exclusively Internet publishing is classified elsewhere in that vintage. Printing books without publishing them, music publishing, and direct-sales book clubs without publishing also fall outside the selected industry. Organizations publishing for their members but primarily classified in another activity are not automatically book-publishing establishments.
SUSB covers employer businesses and excludes most government activity, but government-sponsored book publishers are an explicit exception and remain in scope. Describing these data as a census of private commercial publishers would therefore be incorrect. Workers paid through employment-service businesses may be classified in that service industry rather than book publishing. Census also notes possible establishment undercoverage among smaller multi-unit enterprises.
Published values are not unmodified headcounts
The downloaded 2022 file identifies employment as a noisy measure and retains a noise flag for every selected row. G means a cell was changed by less than 2%; H means at least 2% but less than 5%; J means at least 5%. J is open-ended. It cannot be treated as a five-percent adjustment, and none of these flags is a confidence interval or a sampling margin of error.
The national total and the published fewer-than-20 and fewer-than-500 employment aggregates have flag G. The 5,000-or-more band has flag H. Several constituent bands in the at-least-500 calculation have flag J. Their original flags remain visible in the complete table and downloads; no synthetic flag is assigned to a sum. The article reports published shares and does not claim a statistically significant difference or an exact ordering of the confidential underlying values.
Census’s current methodology page cautions that parts of its noise discussion are being reconsidered following a change in disclosure policy. The file analyzed here still explicitly supplies the historical noise flags. That policy notice is not evidence that the 2022 values were replaced. The reviewed SUSB documentation also does not establish whether enterprise-size assignment occurs before noise is applied; this analysis uses the supplied bands unchanged and does not assume a processing order from another Census programme.
A complete distribution without double-counting
The extraction retains all 23 mutually exclusive enterprise-size bands, plus the national total and two separately labeled cumulative reference rows. The fewer-than-20 and fewer-than-500 rows overlap the detailed bands and must never be added to them. Summing only the disjoint rows reproduces the published totals for establishments, employment and firms exactly in this extract. Agreement is a data-processing check, not proof that the underlying measurements are error-free.
Each employment share is the released band employment divided by the released total employment; establishment shares use the analogous establishment counts. Differences are expressed in percentage points and public percentages are rounded to one decimal. At-least-500 and at-least-2,500 results are sums of fully published disjoint rows, not residuals recovered by subtracting potentially confidential cells. The available target rows contain no suppressed employment values.
Outside this extract, unavailable or suppressed data would remain unknown. The record layout allows suppressed values to appear as zero with a flag, and the methodology page states that cells with fewer than three firms are omitted. Treating those placeholders or absences as genuine zero would be incorrect. The reproduction code checks employment flags before interpreting numbers, and the analysis supplies neither confidential-cell reconstructions nor confidence intervals.
Reading the smaller and middle bands without hiding their detail
The detailed distribution shows where the small-enterprise location share comes from. The fewer-than-five band alone contains 1,387 publishing locations, or 56.8% of the national establishment total. Its 2,007 published publishing employees represent 2.9% of national employment and carry noise flag H. The next band, five to nine domestic parent employees, contains 226 locations and 1,484 published publishing employees, with employment flag G. These are separate categories of parent size, not categories of sales or publication output. Neither category distinguishes a single-location business from every possible multi-location business within the same employment range.
The middle of the distribution also matters. In the 100–149 parent-employee band, 39 publishing locations account for 3,196 published publishing employees: 1.6% of locations and 4.7% of employment. Employment in that row has flag G. In the 300–399 band, 11 locations contribute 2,378 published employees, or 0.5% and 3.5% respectively, with flag H. Those examples illustrate why a single small-versus-large split cannot describe every part of the table. The complete display retains the intervening bands rather than selecting only the most striking differences.
At the same time, more detail does not justify treating the bars as a smooth progression. The 1,000–1,499 domestic-parent band has three publishing locations and only 94 published publishing employees, with flag H. That is not a contradiction: the enterprise threshold concerns employment across its domestic establishments, while the reported industry employment concerns only its book-publishing establishments. It would be wrong to multiply three locations by the minimum parent threshold and call the result expected publishing employment. It would also be wrong to deduce which companies or institutions occupy that band from these aggregates.
How to reproduce and interpret a share difference
The fewer-than-20 employment calculation uses 5,413 divided by 68,114, multiplied by one hundred. The corresponding location calculation uses 1,763 divided by 2,440, multiplied by one hundred. The resulting shares round to 7.9% and 72.3%. Their difference is calculated from the unrounded ratios before being displayed as a 64.3-percentage-point shortfall in published employment share. The word “percentage-point” is important: this is subtraction of two percentages, not a percentage change over time and not an estimate that employment has fallen by 64.3%.
The national employment total is the denominator for every employment band, and the national establishment total is the denominator for every location band. Changing the denominator to only the displayed large-parent groups would answer a different question. So would dividing a publishing employment numerator by a count of enterprises. Keeping denominators explicit lets readers see that each detailed series is a distribution of its own total. Rounded percentages need not add to exactly one hundred, even though the underlying disjoint counts reconcile exactly in this extract.
The published cumulative rows provide useful thresholds, but they are not additional businesses. The fewer-than-20 row already includes the fewer-than-five, five-to-nine, ten-to-fourteen and fifteen-to-nineteen bands. The fewer-than-500 row includes those same enterprises and further bands up to 400–499. Adding either cumulative row to the detailed table would count the same underlying activity again. For that reason, the chart shows only disjoint bands, while the source total and cumulative rows appear in a separate reference table. Larger-group results use documented sums of available constituent rows, not a reconstructed confidential remainder.
These arithmetic choices make the comparison auditable without expanding what the evidence can establish. A gap between employment and location shares is not an estimate of productivity, pay, profitability or editorial influence. Those outcomes have different numerators and would require additional compatible information. The shared organizational classification allows a descriptive comparison of two distributions, but it does not make establishments and employees interchangeable units. The full table, flags and reproduction code are provided so that readers can inspect that distinction rather than relying only on the headline thresholds.
What the contrast adds
The published distribution shows why the number of book-publishing workplaces is an incomplete guide to the organizational setting of publishing employment. Small domestic enterprises account for most locations, while the published payroll jobs are weighted much more heavily toward larger domestic parents. Both statements can be true because locations and employees are different units and parent enterprises can contain activities beyond publishing.
The evidence does not explain why this structure emerged, whether it is changing, or whether it helps or harms authors, workers or readers. Nor does a location’s parent size establish its editorial independence. Those questions require different evidence. The contribution here is narrower and reproducible: a national map of published book-publishing employment and employer locations across the size categories of their domestic parent enterprises.
Book publishing: locations and jobs by parent-enterprise size
United States · 2022 · 23 disjoint size bands · 2017 NAICS 511130
Full chart and source

Scroll horizontally to inspect the chart. ↔
Chart and values
Scroll horizontally to see all columns.
| Domestic parent employees | Publishing locations | Published publishing employees | Employment noise flag | Location share (%) | Published employment share (%) |
|---|---|---|---|---|---|
| <5 | 1,387 | 2,007 | H | 56.8 | 2.9 |
| 5–9 | 226 | 1,484 | G | 9.3 | 2.2 |
| 10–14 | 82 | 928 | G | 3.4 | 1.4 |
| 15–19 | 68 | 994 | G | 2.8 | 1.5 |
| 20–24 | 46 | 955 | G | 1.9 | 1.4 |
| 25–29 | 31 | 756 | G | 1.3 | 1.1 |
| 30–34 | 36 | 915 | G | 1.5 | 1.3 |
| 35–39 | 9 | 264 | H | 0.4 | 0.4 |
| 40–49 | 44 | 1,439 | G | 1.8 | 2.1 |
| 50–74 | 42 | 1,830 | G | 1.7 | 2.7 |
| 75–99 | 35 | 2,190 | G | 1.4 | 3.2 |
| 100–149 | 39 | 3,196 | G | 1.6 | 4.7 |
| 150–199 | 25 | 2,425 | G | 1.0 | 3.6 |
| 200–299 | 14 | 2,242 | G | 0.6 | 3.3 |
| 300–399 | 11 | 2,378 | H | 0.5 | 3.5 |
| 400–499 | 6 | 556 | G | 0.2 | 0.8 |
| 500–749 | 11 | 1,794 | H | 0.5 | 2.6 |
| 750–999 | 3 | 1,075 | J | 0.1 | 1.6 |
| 1,000–1,499 | 3 | 94 | H | 0.1 | 0.1 |
| 1,500–1,999 | 19 | 3,053 | J | 0.8 | 4.5 |
| 2,000–2,499 | 12 | 5,078 | J | 0.5 | 7.5 |
| 2,500–4,999 | 124 | 11,194 | G | 5.1 | 16.4 |
| 5,000+ | 167 | 21,267 | H | 6.8 | 31.2 |
No cumulative rows included. Employment flags G/H/J are disclosure-noise categories, not confidence intervals. J is open-ended.
Data & downloads
Scroll horizontally to see all columns.
| Domestic parent employees | Publishing locations | Published publishing employees | Employment noise flag | Location share (%) | Published employment share (%) |
|---|---|---|---|---|---|
| <5 | 1,387 | 2,007 | H | 56.8 | 2.9 |
| 5–9 | 226 | 1,484 | G | 9.3 | 2.2 |
| 10–14 | 82 | 928 | G | 3.4 | 1.4 |
| 15–19 | 68 | 994 | G | 2.8 | 1.5 |
| 20–24 | 46 | 955 | G | 1.9 | 1.4 |
| 25–29 | 31 | 756 | G | 1.3 | 1.1 |
| 30–34 | 36 | 915 | G | 1.5 | 1.3 |
| 35–39 | 9 | 264 | H | 0.4 | 0.4 |
| 40–49 | 44 | 1,439 | G | 1.8 | 2.1 |
| 50–74 | 42 | 1,830 | G | 1.7 | 2.7 |
| 75–99 | 35 | 2,190 | G | 1.4 | 3.2 |
| 100–149 | 39 | 3,196 | G | 1.6 | 4.7 |
| 150–199 | 25 | 2,425 | G | 1.0 | 3.6 |
| 200–299 | 14 | 2,242 | G | 0.6 | 3.3 |
| 300–399 | 11 | 2,378 | H | 0.5 | 3.5 |
| 400–499 | 6 | 556 | G | 0.2 | 0.8 |
| 500–749 | 11 | 1,794 | H | 0.5 | 2.6 |
| 750–999 | 3 | 1,075 | J | 0.1 | 1.6 |
| 1,000–1,499 | 3 | 94 | H | 0.1 | 0.1 |
| 1,500–1,999 | 19 | 3,053 | J | 0.8 | 4.5 |
| 2,000–2,499 | 12 | 5,078 | J | 0.5 | 7.5 |
| 2,500–4,999 | 124 | 11,194 | G | 5.1 | 16.4 |
| 5,000+ | 167 | 21,267 | H | 6.8 | 31.2 |
No cumulative rows included. Employment flags G/H/J are disclosure-noise categories, not confidence intervals. J is open-ended.
Scroll horizontally to see all columns.
| Domestic parent employees | Publishing locations | Published publishing employees | Employment noise flag | Location share (%) | Published employment share (%) |
|---|---|---|---|---|---|
| Total | 2,440 | 68,114 | G | 100.0 | 100.0 |
| <20 | 1,763 | 5,413 | G | 72.3 | 7.9 |
| <500 | 2,101 | 24,559 | G | 86.1 | 36.1 |
Reference rows overlap detailed bands. Do not add them to the distribution.
Evidence & method
How we calculated it
- National 2022 SUSB detailed enterprise employment file; STATE=00, 2017 NAICS=511130.
- Share = published band value / compatible published national total × 100. Public percentages rounded to one decimal; gaps in percentage points.
- All 23 disjoint bands retained. Total and nested <20/<500 aggregates kept separate. Larger cumulative groups sum fully published disjoint rows only.
- Flag-first employment parsing; suppressed/absent cells remain unknown. No reconstruction or confidence intervals.
- The supplied enterprise bands are unchanged. Reviewed SUSB documentation does not establish size-assignment ordering relative to noise.
What the data cannot tell us
- Payroll employment is for the March 12 pay period; locations are annual-active employers and may include zero-March employment.
- Whole domestic parent size includes other industries. Not worldwide parent employment, establishment size, independent status, market share, sales or named-company concentration.
- 2017 NAICS excludes exclusively Internet book publishing. Nonemployers excluded; government-sponsored publishers included. Leased-worker classification and multi-unit undercoverage can matter.
- Employment contains disclosure noise; J has no finite upper bound. No inference of exact latent dominance, significance or causality.
- Not directly comparable as the same employment universe with the BLS Industry Productivity series.
Original sources
- Current SUSB datasets index
Current SUSB datasets index: Current index lists 2022.
Accessed October 30, 2026
- 2022 SUSB release
2022 SUSB release: April 2025 release; 2017 NAICS; MSA-only erratum.
Accessed October 30, 2026
- 2022 detailed enterprise employment file
2022 detailed enterprise employment file: Filter STATE 00 and NAICS 511130; retain employment flags.
Accessed October 30, 2026
- SUSB record layout
SUSB record layout: Counts, noisy employment, G/H/J and suppression definitions.
Accessed October 30, 2026
- SUSB glossary
SUSB glossary: Domestic enterprise, establishment, industry-specific firm and March payroll definitions.
Accessed October 30, 2026
- SUSB methodology
SUSB methodology: Universe, government-book-publisher exception, undercoverage, current noise-policy caveat and nonsampling errors.
Accessed October 30, 2026
- 2017 NAICS manual
2017 NAICS manual: Printed page 412: 511130 definition and cross-references; exclusive Internet publishing excluded.
Accessed October 30, 2026
- U.S. Copyright Office
U.S. Copyright Office: Federal government works and facts public-domain basis; no licence invented.
Accessed October 30, 2026
Cite & reuse this study
Alisson Bento. Book-publishing workplaces and jobs: two views of parent-enterprise size. Secondary analysis of U.S. Census Bureau, Statistics of U.S. Businesses, 2022, 2017 NAICS 511130. Accessed October 30, 2026. https://alissonbento.com/research/us-book-publishing-parent-enterprise-size-2022/
Source: U.S. Census Bureau, Statistics of U.S. Businesses, 2022. Federal aggregate data. Selection, calculations and presentation by Alisson Bento. No agency endorsement, logo use or invented licence.
Corrections or editorial questions