
What changed beneath the unchanged headline
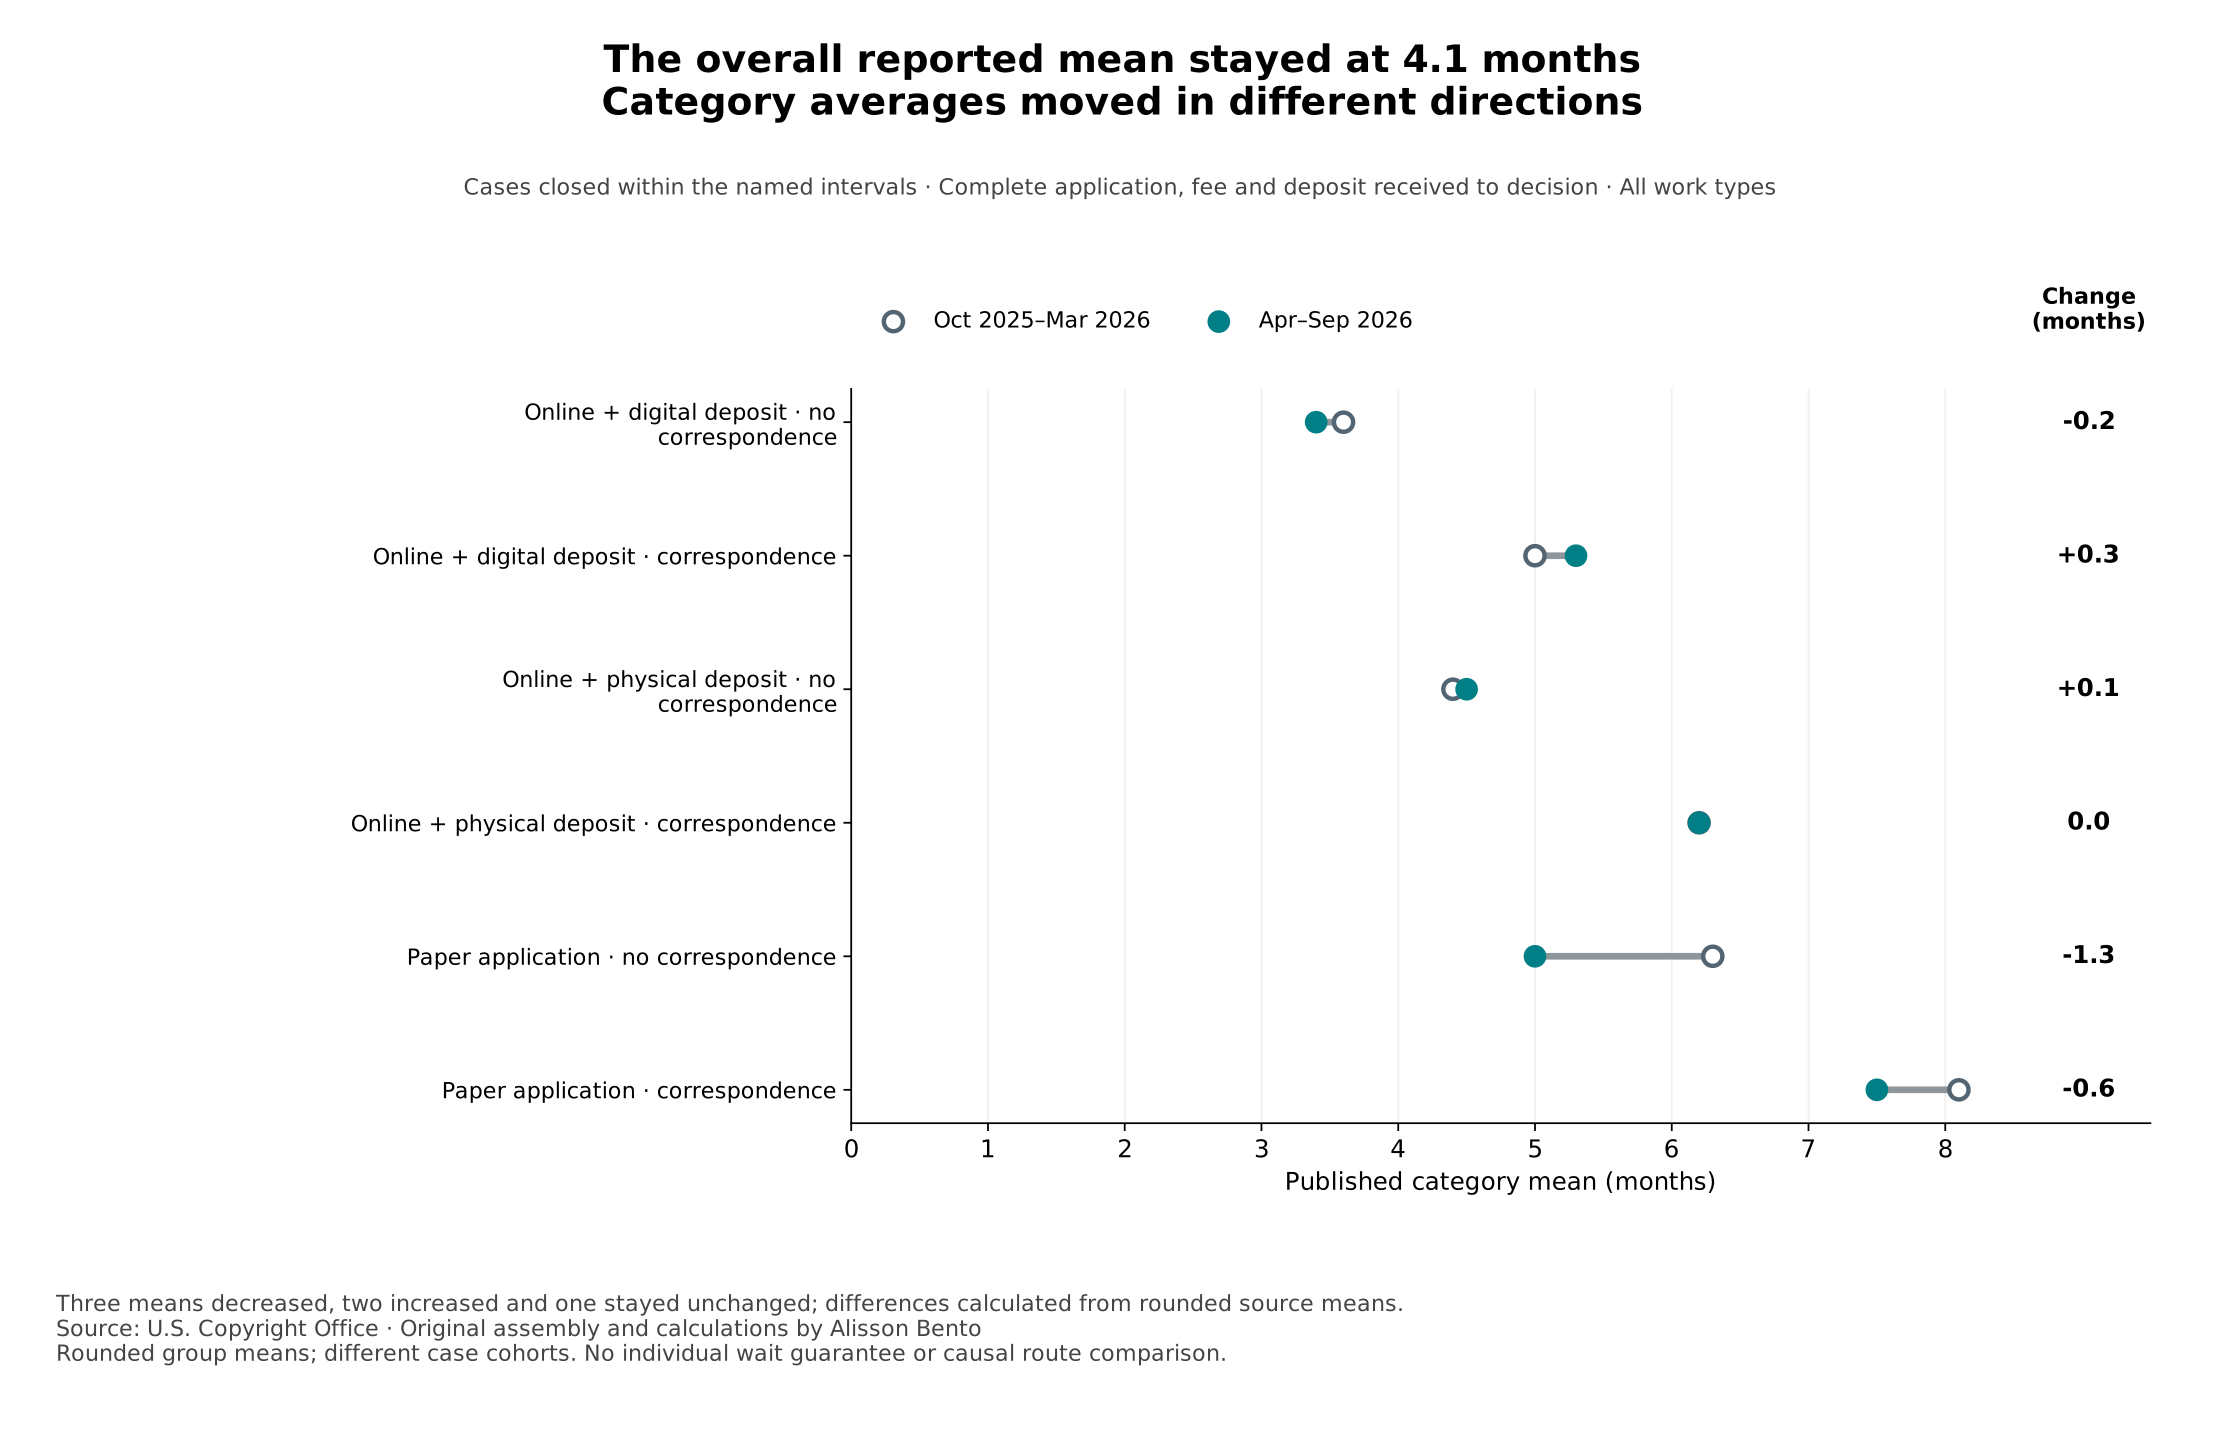
In the latest comparison, the mean for electronic applications with digital deposits and no correspondence declined from 3.6 to 3.4 months. The corresponding category requiring correspondence increased from 5.0 to 5.3 months. Among online applications with physical deposits, the mean without correspondence increased from 4.4 to 4.5 months, while the mean with correspondence remained at 6.2 months.
Paper applications moved in the other direction. Their no-correspondence average declined from 6.3 to 5.0 months, a reduction of 1.3 months. Their correspondence average declined from 8.1 to 7.5 months, a reduction of 0.6 months. These are differences between published, rounded group means. They do not establish that an applicant who changed routes would obtain the same reduction.
The practical finding is divergence. An unchanged reported, rounded overall mean can coexist with improvement in some administrative groups and deterioration in others. It would therefore be misleading to describe the most recent release simply as showing that processing was unchanged for authors. It would also be misleading to substitute the largest improvement for the experience of all applicants. The six comparisons answer a narrower, more useful question: which published groups moved, and by how much?
A longer view, without crossing a change in measurement
The first comparable report in our panel covers October 1, 2022 to March 31, 2023. Comparing that interval with April 1 to September 30, 2026 produces another mixed picture. Four category means were higher at the end and two were lower. The wholly electronic no-correspondence mean increased by 2.2 months, from 1.2 to 3.4. The electronic correspondence mean increased by 2.0 months, from 3.3 to 5.3.
For online applications with a physical deposit, the no-correspondence mean increased by 1.8 months, from 2.7 to 4.5. The correspondence mean declined by 0.4 months, from 6.6 to 6.2. Paper applications without correspondence increased by 0.7 months, while paper applications with correspondence declined by 0.7 months. The first and last intervals were selected by the compatible reporting window, not by searching for the most dramatic pair of values.
These endpoint differences are not a claim that each series moved smoothly. The intervening reports matter. Electronic cases without correspondence, for example, have published means of 1.2, 1.4, 1.2, 1.2, 1.5, 1.9, 3.6 and 3.4 months across the eight intervals. The sequence shows periods of stability, an increase and a later partial decline. Reporting only its first and final values would conceal that shape.
The overall published, rounded means were 2.1, 2.2, 2.1, 1.9, 2.1, 2.5, 4.1 and 4.1 months. We retain these as the Office's own aggregate figures; we do not recreate them by averaging the six categories. Each category can represent a different number of cases. Giving the six means equal weight would answer an artificial question about six equally weighted groups, rather than reproduce the Office's average across claims.
Why “online” needs a more precise description
The reports distinguish an online application with an uploaded digital deposit from an online application with a mailed physical deposit. Calling both simply “online registration” removes a distinction that appears throughout the source tables. Our panel keeps the two routes separate, using the official descriptions as the basis for its labels.
For cases without correspondence, the physical-deposit online mean exceeded the digital-deposit online mean in all eight intervals. The differences ranged from 0.5 to 1.8 months. The latest difference was 1.1 months. Among cases with correspondence, the corresponding differences ranged from 0.7 to 3.4 months, ending at 0.9 months. These are within-period comparisons, so they do not depend on treating different years as interchangeable.
The comparison is relevant when someone is interpreting a general statement about online turnaround. It is not an instruction to upload a digital copy when a physical deposit is required. The appropriate submission depends on the applicable requirements and the particular work. The official source itself cautions that submitting the wrong type of deposit can introduce problems. A planning document should identify the applicable route before attaching a historical average to it.
Nor does the gap measure postal transit time. The clock in the selected reports begins once the Office has received the appropriate application, correct fee and deposit. A difference between the routes can reflect differences in the cases, processing arrangements and other circumstances. The panel cannot divide that difference into transportation, examination, queueing or applicant-response components. Treating the whole difference as time spent in the mail would misdescribe what is measured.
Correspondence is a descriptive category, not a controlled treatment
The reports separate cases that required communication with applicants from those that did not. The mean for the correspondence category was higher within each route in every selected interval. For wholly electronic cases, the published difference ranged from 1.4 to 2.3 months. For online applications with physical deposits, it ranged from 1.7 to 3.9 months. For paper applications, it ranged from 1.8 to 5.1 months.
This consistent ordering is useful context, but the size of each difference must not be read as the time that would necessarily be saved by avoiding an email. Applicants were not randomly assigned to correspondence. Cases requiring clarification may differ in complexity or completeness. Correspondence can also involve the time needed to receive and assess a response. The aggregate reports do not isolate these mechanisms.
For an editorial workflow, a reasonable use is to recognize correspondence as a timing-relevant classification and to maintain a reliable process for noticing official messages. An unreasonable use would be to deduct a published group difference from an individual application's expected wait. The first is an operational lesson from the classification; the second is an unsupported prediction about a specific case.
The categories also should not become judgments about applicants. The data do not establish that every correspondence case resulted from avoidable error, or that a no-correspondence case was uncomplicated in every respect. Keeping the neutral source labels prevents a timing analysis from turning into a claim about diligence, competence or the quality of the submitted work.
A narrower spread does not mean everyone became faster
The difference between the largest and smallest of the six category means was 7.0 months in the first selected interval and 4.1 months in the last. This is a reduction of 2.9 months in the spread of category averages. It is not the range of individual waiting times, and it is not a measure of how predictable an applicant's outcome became.
The distinction matters because the narrowing accompanied movement at both ends. The lowest category mean rose from 1.2 to 3.4 months; the highest declined from 8.2 to 7.5. A smaller distance between group averages therefore does not, by itself, demonstrate a system-wide improvement. Some categories could become slower while others became faster, bringing the averages closer together.
The full panel also guards against portraying the narrowing as perfectly continuous. Its spreads were 7.0, 7.8, 7.4, 6.8, 5.3, 4.8, 4.5 and 4.1 months. The first transition widened the spread. Subsequent selected intervals narrowed it. These calculations summarize the published categories without suggesting that the reports reveal every part of the underlying distribution.
The clock change that limits the historical comparison
The Office's archive reaches farther back than our analytical panel. We inspected and preserved 18 linked reports. Four earlier reports use a different set of categories. Another six contain the six familiar categories but describe a different starting point for measurement. They are retained in the source audit and excluded from our comparative results.
The October 2022–March 2023 report explicitly explains the change. Earlier measurement began when a record was created in the electronic system. For online applications that could occur when the application and payment arrived, before the deposit. For mailed applications it was when information was transcribed into the system. The revised method begins when the required application, fee and deposit have all arrived, and ends with the registration decision.
This is more than a wording preference. Moving the starting point can change a measured duration even if the underlying sequence of events has not changed. A graph drawn across the boundary without explanation could make an administrative measurement change look like a performance improvement. We therefore begin with the first report explicitly using the revised clock and require the same definition in every selected report. The independent source check confirmed that definition across the eight selected documents.
The historical audit remains useful to someone who wants to extend the series later. It records why particular reports were excluded, rather than silently discarding inconvenient years. Anyone constructing a longer comparison would need a defensible bridge between the measurement systems. The sources collected here do not provide that bridge, and this study does not invent one.
Event dates and report dates must also stay separate
Two of the archived PDFs discuss the lapse in appropriations from October 1 through November 12, 2025. The notice attached to the April–September 2025 report concerns an event after that report's case-closure interval and describes expected subsequent effects. It must not be used to explain the figures for cases already closed before October began.
The following October 2025–March 2026 report covers an interval containing the lapse. Its notice provides relevant administrative context. Even there, the table alone cannot estimate the precise contribution of the interruption to each category mean. This study retains the notice and its dates without attributing a specified number of months to it. The latest April–September 2026 PDF contains no corresponding notice.
This separation is especially important for archived publications that can carry notices added after the statistical period. The period printed above a table describes the cases summarized; it does not necessarily date every sentence appearing elsewhere in the document. Our data package records the statistical interval and the context note separately so that later readers can inspect that distinction.
How an author or editor can use the panel
The panel is a reference for historical context, not a countdown. A practical use begins by identifying the route that actually applies to the work and whether the available information concerns a case requiring correspondence. The next step is to look at that category across several recent intervals, rather than selecting whichever single average best fits an intended launch schedule.
For example, an editor preparing an internal status note could distinguish the date of submission, the date complete materials were received if known, any correspondence, and the historical reporting period used for context. Those are separate facts. Combining them into a statement such as “the certificate will arrive in 4.1 months” would add a certainty that the sources do not supply.
The reports concern closed cases, not necessarily successful registrations, issued certificates or a cohort of newly filed applications. A case completed in a reporting interval may have been submitted much earlier. Consequently, the eight intervals are not eight groups of authors who all started the process together. They provide repeated administrative snapshots under a common clock, rather than a longitudinal follow-up of the same people.
No literary-work breakdown is available in these tables. The panel cannot establish that novelists, translators, audiobook producers or children's-book publishers experience the reported overall means. Such users can still benefit from a better reading of the official administrative categories, provided that the broad scope is stated. Legal deadlines and the choice of registration procedure require the relevant official guidance and case-specific judgment, rather than a timing average.
Sources, calculation and reproducibility
The downloadable panel contains one row for each of the 48 route-and-correspondence cells. Each row retains the exact interval, mean in months, literal range wording, source URL, PDF page and SHA-256 fingerprint. A separate period file preserves the eight official aggregate means and the context notes. The source manifest identifies the complete 18-report audit and the eight documents used analytically.
The calculation is deliberately transparent. Endpoint changes subtract the earlier published mean from the later one. Correspondence differences subtract the no-correspondence mean from the correspondence mean within the same route and interval. Online-route differences compare physical and digital deposits within the same correspondence category. The spread subtracts the smallest of the six category means from the largest. An offline script reproduces these results from the frozen numeric panel without a network connection.
All means are published to one decimal place. The calculated differences inherit that rounding, and small differences should not be interpreted with greater precision than the inputs support. The source ranges are retained as printed; they are not percentiles, confidence intervals or probabilities of completion by a deadline. The reports supply rounded administrative summaries, not a sample design or underlying case-level information supporting inferential uncertainty estimates. We therefore report no sampling confidence intervals, statistical significance or deadline-success probabilities.
An initially considered case-mix decomposition was abandoned. The percentages are labelled in terms of applications while timing figures refer to cases closed, and an identical denominator was not explicitly established. Reporting a weighted decomposition as an empirical explanation would therefore exceed the verified source basis. The useful result survives without it: one overall average can conceal different movements across clearly described administrative groups, and a careful comparison must also respect the date on which the measurement clock changed.
Six categories across eight comparable reporting intervals
Closed cases, all work types. Eight intervals use the complete-materials-to-decision clock. Published rounded group means; no individual waiting-time distribution or causal route effects.
Full chart and source

Scroll horizontally to inspect the chart. ↔
Chart and values
Scroll horizontally to see all columns.
| Case-closure interval | Online + digital deposit; no correspondence | Online + digital deposit; correspondence | Online + physical deposit; no correspondence | Online + physical deposit; correspondence | Paper application; no correspondence | Paper application; correspondence | Official overall mean |
|---|---|---|---|---|---|---|---|
| October 1, 2022 – March 31, 2023 | 1.2 | 3.3 | 2.7 | 6.6 | 4.3 | 8.2 | 2.1 |
| April 1, 2023 – September 30, 2023 | 1.4 | 3.5 | 2.9 | 5.4 | 4.1 | 9.2 | 2.2 |
| October 1, 2023 – March 31, 2024 | 1.2 | 3.5 | 3.0 | 5.6 | 4.1 | 8.6 | 2.1 |
| April 1, 2024 – September 30, 2024 | 1.2 | 2.9 | 2.6 | 6.3 | 4.1 | 8.0 | 1.9 |
| October 1, 2024 – March 31, 2025 | 1.5 | 3.3 | 2.7 | 5.0 | 3.8 | 6.8 | 2.1 |
| April 1, 2025 – September 30, 2025 | 1.9 | 3.7 | 2.4 | 4.4 | 4.2 | 6.7 | 2.5 |
| October 1, 2025 – March 31, 2026 | 3.6 | 5.0 | 4.4 | 6.2 | 6.3 | 8.1 | 4.1 |
| April 1, 2026 – September 30, 2026 | 3.4 | 5.3 | 4.5 | 6.2 | 5.0 | 7.5 | 4.1 |
Each row describes cases closed in the exact interval, all work types; one-decimal administrative means. Six categories are not equally weighted applicants. Source clock unchanged within this panel. Digital and physical deposits here both accompany online applications; paper application is a separate filing route.

Latest category changes beneath the unchanged rounded overall mean
October 2025–March 2026 versus April–September 2026 closed cases. Different case cohorts, same complete-materials-to-decision clock. Changes calculated from rounded group means.
Full chart and source
Scroll horizontally to inspect the chart. ↔
Chart and values
Scroll horizontally to see all columns.
| Category | October 2025–March 2026 | April–September 2026 | Difference, months |
|---|---|---|---|
| Online + digital deposit; no correspondence | 3.6 | 3.4 | −0.2 |
| Online + digital deposit; with correspondence | 5.0 | 5.3 | +0.3 |
| Online + physical deposit; no correspondence | 4.4 | 4.5 | +0.1 |
| Online + physical deposit; with correspondence | 6.2 | 6.2 | 0.0 |
| Paper application; no correspondence | 6.3 | 5.0 | −1.3 |
| Paper application; with correspondence | 8.1 | 7.5 | −0.6 |
Calculated changes from rounded source means; three decreases, two increases and one unchanged. Different completed-case cohorts, not route effects.

Data & downloads
Scroll horizontally to see all columns.
| Case-closure interval | Online + digital deposit; no correspondence | Online + digital deposit; correspondence | Online + physical deposit; no correspondence | Online + physical deposit; correspondence | Paper application; no correspondence | Paper application; correspondence | Official overall mean |
|---|---|---|---|---|---|---|---|
| October 1, 2022 – March 31, 2023 | 1.2 | 3.3 | 2.7 | 6.6 | 4.3 | 8.2 | 2.1 |
| April 1, 2023 – September 30, 2023 | 1.4 | 3.5 | 2.9 | 5.4 | 4.1 | 9.2 | 2.2 |
| October 1, 2023 – March 31, 2024 | 1.2 | 3.5 | 3.0 | 5.6 | 4.1 | 8.6 | 2.1 |
| April 1, 2024 – September 30, 2024 | 1.2 | 2.9 | 2.6 | 6.3 | 4.1 | 8.0 | 1.9 |
| October 1, 2024 – March 31, 2025 | 1.5 | 3.3 | 2.7 | 5.0 | 3.8 | 6.8 | 2.1 |
| April 1, 2025 – September 30, 2025 | 1.9 | 3.7 | 2.4 | 4.4 | 4.2 | 6.7 | 2.5 |
| October 1, 2025 – March 31, 2026 | 3.6 | 5.0 | 4.4 | 6.2 | 6.3 | 8.1 | 4.1 |
| April 1, 2026 – September 30, 2026 | 3.4 | 5.3 | 4.5 | 6.2 | 5.0 | 7.5 | 4.1 |
Each row describes cases closed in the exact interval, all work types; one-decimal administrative means. Six categories are not equally weighted applicants. Source clock unchanged within this panel. Digital and physical deposits here both accompany online applications; paper application is a separate filing route.
Scroll horizontally to see all columns.
| Category | October 2025–March 2026 | April–September 2026 | Difference, months |
|---|---|---|---|
| Online + digital deposit; no correspondence | 3.6 | 3.4 | −0.2 |
| Online + digital deposit; with correspondence | 5.0 | 5.3 | +0.3 |
| Online + physical deposit; no correspondence | 4.4 | 4.5 | +0.1 |
| Online + physical deposit; with correspondence | 6.2 | 6.2 | 0.0 |
| Paper application; no correspondence | 6.3 | 5.0 | −1.3 |
| Paper application; with correspondence | 8.1 | 7.5 | −0.6 |
Calculated changes from rounded source means; three decreases, two increases and one unchanged. Different completed-case cohorts, not route effects.
Evidence & method
How we calculated it
- Audit all 18 officially linked reports and preserve exact PDF fingerprints. Select the eight terminal intervals with identical six-category definitions and complete-materials-to-decision timing clock.
- Transcribe 48 published one-decimal category means and literal ranges, eight overall reported means and exact case-closure intervals; independently re-extract from PDFs and verify all arithmetic.
- Compute descriptive within-period category differences, fixed latest-versus-previous and latest-versus-first comparisons, and spread of six cell averages. Do not calculate case-mix attribution or causal effects.
- Reproduce from the frozen CSV using the included offline Python standard-library script. Preserve the source clock-change footnote and distinguish notice event dates from case-closure dates.
What the data cannot tell us
- The reports summarize closed cases, not a cohort of newly submitted applications, granted registrations or certificate-delivery dates.
- All work types are pooled; no novelist, translator, book publisher or literary-work-specific result is available.
- Case populations and complexity differ; correspondence is not randomly assigned and deposit rules constrain routes. No causal route advice or individual forecast.
- Published means are rounded; source ranges are not confidence intervals or deadline probabilities. No inferential uncertainty estimates are supported.
- Application shares and closed-case timing do not explicitly establish identical denominators; no empirical or conditional case-mix decomposition is presented.
Original sources
- U.S. Copyright Office registration processing: October 1, 2022 – March 31, 2023
Closed cases October 1, 2022 – March 31, 2023. Six route/correspondence means on page 1; complete-materials-to-decision clock on page 2. Page 2 footnote 1 explicitly introduces the changed timing clock; all earlier intervals are excluded from comparisons. First period under revised clock; earlier periods excluded.
Accessed October 31, 2026
- U.S. Copyright Office registration processing: April 1, 2023 – September 30, 2023
Closed cases April 1, 2023 – September 30, 2023. Six route/correspondence means on page 1; complete-materials-to-decision clock on page 2.
Accessed October 31, 2026
- U.S. Copyright Office registration processing: October 1, 2023 – March 31, 2024
Closed cases October 1, 2023 – March 31, 2024. Six route/correspondence means on page 1; complete-materials-to-decision clock on page 2.
Accessed October 31, 2026
- U.S. Copyright Office registration processing: April 1, 2024 – September 30, 2024
Closed cases April 1, 2024 – September 30, 2024. Six route/correspondence means on page 1; complete-materials-to-decision clock on page 2.
Accessed October 31, 2026
- U.S. Copyright Office registration processing: October 1, 2024 – March 31, 2025
Closed cases October 1, 2024 – March 31, 2025. Six route/correspondence means on page 1; complete-materials-to-decision clock on page 2.
Accessed October 31, 2026
- U.S. Copyright Office registration processing: April 1, 2025 – September 30, 2025
Closed cases April 1, 2025 – September 30, 2025. Six route/correspondence means on page 1; complete-materials-to-decision clock on page 2. Notice event: October 1–November 12, 2025 appropriations lapse; claims received but not processed. This event is after the reported closed-case interval; source notice is prospective, not a cause of this interval’s values.
Accessed October 31, 2026
- U.S. Copyright Office registration processing: October 1, 2025 – March 31, 2026
Closed cases October 1, 2025 – March 31, 2026. Six route/correspondence means on page 1; complete-materials-to-decision clock on page 2. Notice event: October 1–November 12, 2025 appropriations lapse; claims received but not processed. Event occurs within reported interval; source contextual notice, not a quantified causal estimate.
Accessed October 31, 2026
- U.S. Copyright Office registration processing: April 1, 2026 – September 30, 2026
Closed cases April 1, 2026 – September 30, 2026. Six route/correspondence means on page 1; complete-materials-to-decision clock on page 2. Mutable current-report URL frozen to SHA-256 635931b5b89978dcf160df6a6891d41cf1fc1968da6b59706c57de99a879afd6; current page may later show another period.
Accessed October 31, 2026
Cite & reuse this study
Alisson Bento. 2026. The same copyright-processing average can hide different waits. Original source assembly and calculations from eight U.S. Copyright Office reporting intervals, October 2022–September 2026. https://alissonbento.com/research/us-copyright-processing-route-cohorts-2022-2026/
Original analysis, accessible tables and derived numeric files may be reused with attribution to Alisson Bento and the U.S. Copyright Office primary sources. Source PDFs, agency seals and applicant records are not redistributed; no agency endorsement is implied.
Corrections or editorial questions