
A reading day can contain more than reading
A person can read in the morning and watch a film in the evening. A headline that places reading beside television or games does not tell us whether those activities belonged to different people or occurred on the same day. This analysis addresses that missing piece. Using the American Time Use Survey, it measures how often personal-interest reading, television or movies, and games or computer leisure appear somewhere within one reported diary day.
The main 2025 estimate is that 73.95% of weighted reading diary days also contain television or movies, with a 95% sampling interval of 70.95–76.94%. This concerns the US civilian noninstitutionalized population aged 15 and over, including 15–17-year-olds. Same-day presence does not mean simultaneous activity. The federal shutdown left diary dates from 30 September through 11 November 2025 unobserved; possible resulting bias is not included in that sampling interval.
The useful question is therefore how the selected activities coexist within a reported day, with the denominator stated explicitly. The existing Reading Days study at /research/us-reading-days-2015-2025/ addresses reading participation and reported episodes. This article supplies a different view: combinations of activities and conditional overlap. It does not present the earlier reading-participation headline as a new discovery or explain why reading participation changed.
Start with what the percentage is a percentage of
There are two important ways to count a combination. One starts with every diary day in the declared population and asks which activities appear. The other starts only with days containing personal-interest reading and asks whether another selected activity appears too. These denominators answer different questions. A large overlap among reading days can coexist with a much smaller share of all days containing the same combination.
For 2025, 80.78% of weighted reading diary days include either television or movies, games or computer leisure, or both; the sampling interval is 77.73–83.83%. In contrast, reading without either selected other category accounts for 3.10% of all weighted diary days, with an interval of 2.57–3.63%. Neither figure describes an annual share of Americans who identify as readers. Both inherit the unquantified shutdown-related uncertainty beyond their sampling intervals, and neither implies that activities happened simultaneously.
The word either includes days containing both other categories. Television and games/computer percentages consequently cannot be added to obtain the either-category estimate. The analysis counts their union directly, so a day containing all three activities contributes once to that conditional numerator. Keeping that distinction visible is more informative than treating reading, television and games as competing boxes into which every person must fit.
What reading, television and games mean here
Personal-interest reading uses the ATUS activity code 120312. It is broader than reading novels or printed books. The category cannot identify a title, genre or author, and a positive duration does not establish that a book was completed. It also does not provide a complete inventory of audiobook listening or reading undertaken while another activity was reported as primary. The unit remains the coded activity on the recorded day.
Television and movies combine codes 120303 and 120304, including religious television as specified in the ATUS user guide’s example. Separately coded cinema attendance is excluded. Games and computer leisure combine codes 120307 and 120308. This broader grouping includes board games, card games and non-game computer leisure. Calling it video gaming would incorrectly narrow the source definition; calling it all screen time would incorrectly widen it.
Those boundaries also rule out a simple division between books and screens. Reading need not be print, games need not involve a screen, and the selected categories do not capture all smartphone or social-media use. The labels are useful because they identify reproducible source codes, rather than because they form a complete theory of media consumption. Each category is counted as present only when the sum of its primary-activity minutes is positive.
How to read the eight combinations
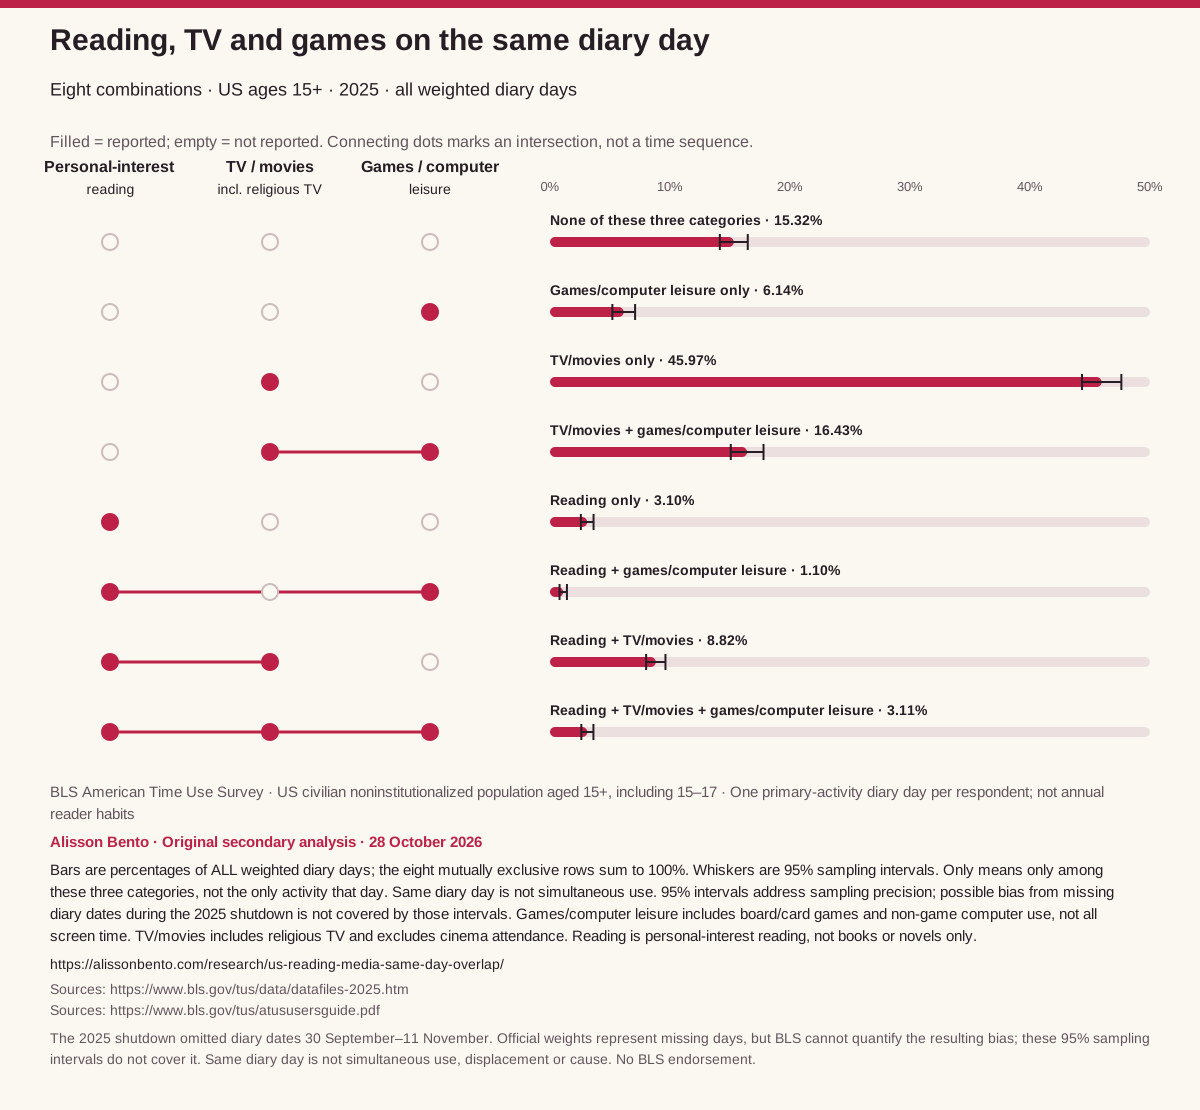
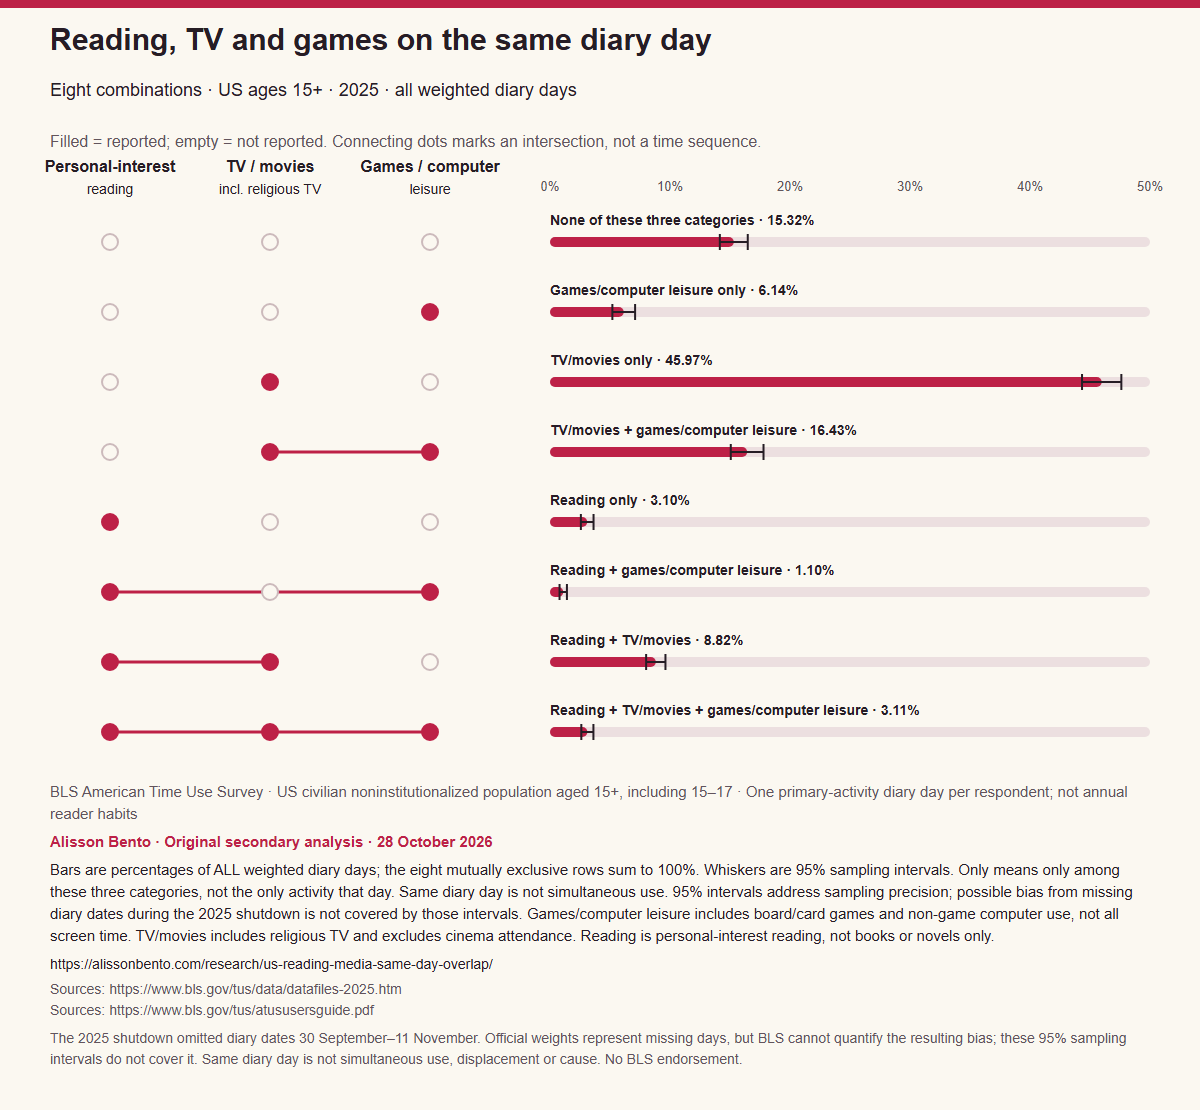
With three categories, there are eight possible combinations: none, each category alone, each pair, and all three. Within a declared population and year, those states are mutually exclusive and exhaustive. Every diary goes into exactly one state. Their weighted shares therefore sum to 100%, apart from display rounding. The first figure uses a membership matrix alongside bars so that the categories included in each state can be seen directly.
A filled circle means that category was reported as a primary activity somewhere in the diary; an empty circle means it was not. Connecting filled circles identifies a set of categories. It does not trace the order of activities, indicate how long they lasted, or show one activity leading to another. The horizontal bar measures the state’s share of all weighted diary days, and the whisker shows its sampling uncertainty.
Reading only is shorthand for reading without the two selected other categories. It does not describe a day spent entirely reading: the diary still includes sleep, work, care or other activities. None means none of these three coded categories, rather than no leisure, no media, or no reading as a secondary activity. These qualifications travel with the 2025 figure, together with the warning that shutdown-related missing dates create uncertainty beyond the plotted sampling intervals.
Reading-day overlap uses a smaller respondent base
The 2025 sample contains 6,146 respondents, each contributing one diary. Of these, 1,227 have personal-interest reading recorded, and 962 have both reading and television or movies. The weighted television overlap estimate of 73.95% uses the reading-day denominator. Its sampling interval is 70.95–76.94%, but does not cover possible shutdown-related bias. The raw counts disclose the available sample; dividing 962 by 1,227 does not reproduce the weighted result.
Changing the direction of a conditional question changes its denominator. Television among reading days and reading among television days refer to the same joint event but divide by different groups of diaries. The download therefore keeps separate rows for each direction and names the denominator. A statement about the first should never be copied into a headline about the second. Neither direction measures a person’s likelihood of becoming a reader over a year.
One diary day also cannot establish a permanent reader segment. A respondent whose recorded day contains no reading may read on other days, and someone who reads on the recorded day need not do so daily. The analysis describes weighted diary-day patterns across the population. It does not classify loyal readers, occasional readers, customers or fans, and it cannot infer which books or services those people would choose.
What differs between the two endpoints
In 2015, television or movies occur on 80.03% of weighted personal-interest reading diary days; either selected other category occurs on 85.33%. The 2025-minus-2015 differences are −6.09 percentage points for television and −4.55 points for either category. Their sampling intervals are −9.65 to −2.53 and −8.03 to −1.06 points. The comparison involves independent annual samples, and the 2025 shutdown remains an additional source of possible bias beyond these intervals.
Games or computer leisure have conditional estimates of 24.74% in 2015 and 26.14% in 2025. The full-precision difference rounds to +1.39 percentage points, with an interval from −2.83 to +5.62. That interval does not establish an increase. Subtracting the already rounded endpoint percentages can give a slightly different displayed result, which is why the difference table uses the original numerical estimates before rounding.
These are two endpoints, not a continuous annual trajectory and not repeated observations of the same individuals. A difference cannot tell us which respondents changed activities or why. It also does not explain the broader reading-participation findings addressed in the existing study. The complete tables retain the other estimates and uncertainty, including results whose intervals cross zero, so the account does not depend on selecting only apparently clear differences.
Age and day-of-week tables provide context
The main population starts at age 15, so it should not be relabelled adults only. A separate analysis restricted to ages 18 and over gives a 2025 either-category overlap estimate of 81.46% among reading days, with a sampling interval of 78.58–84.33%. This sensitivity uses its own denominator; it does not replace the main estimate. The interval still does not account for possible bias from the missing shutdown dates.
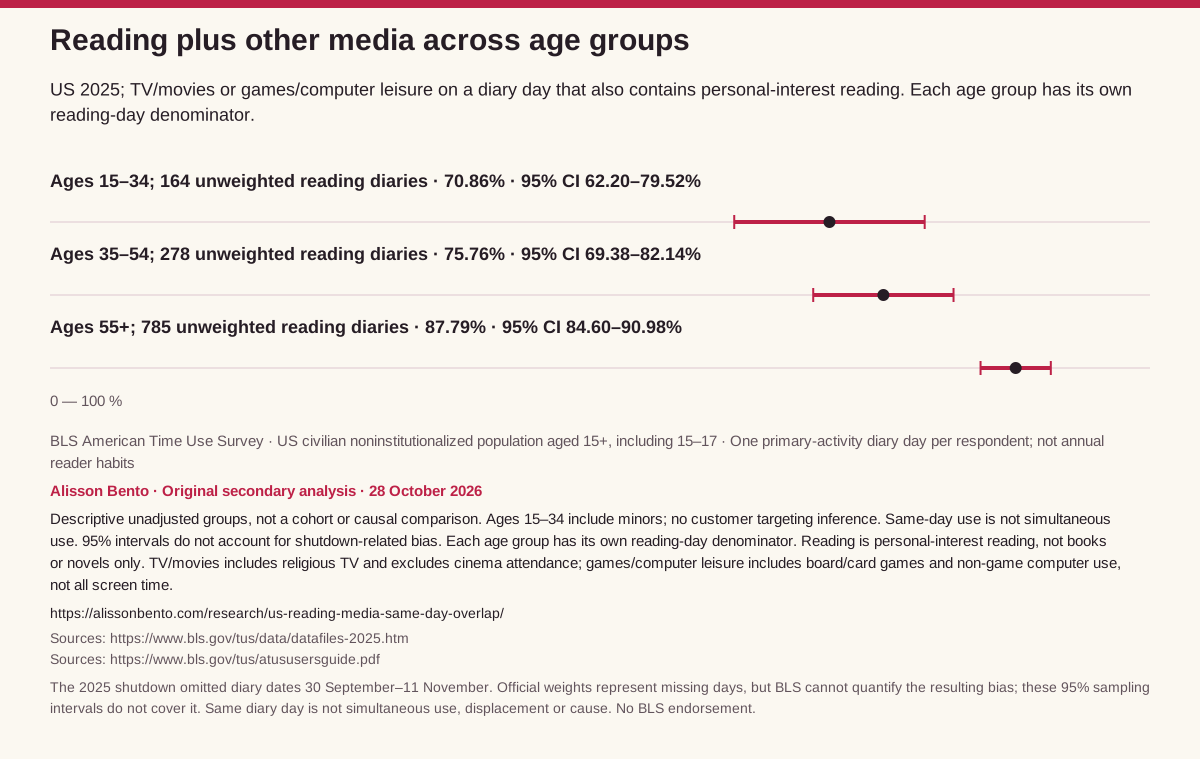
The age figure reports the same conditional question within three broad bands. For 2025, the estimates are 70.86% at ages 15–34, 75.76% at ages 35–54 and 87.79% at ages 55 and over. Their respective reading-day samples contain 164, 278 and 785 respondents, and their sampling intervals are 62.20–79.52%, 69.38–82.14% and 84.60–90.98%. These intervals describe sampling precision, not shutdown-related bias. The youngest band includes minors.
These are unadjusted descriptions, not evidence that ageing causes a particular media pattern. The people in the two years are not a cohort followed through time. The seven reporting domains also overlap: the adult sensitivity and weekday/weekend groups share people with age groups and the main population. The day tables distinguish Monday–Friday from Saturday–Sunday within the reported 04:00-to-04:00 diary. They do not compare a particular person’s workdays with their weekends or prescribe a better reading routine.
Presence and duration answer different questions
An activity can be present in a diary for a short or a long period. The overlap measures treat either as positive presence because their question concerns membership in a daily combination. They do not measure how attention is divided, whether reading is uninterrupted, or whether television is background noise. A bar representing a combination’s share of days is therefore not a bar representing the time spent on that combination.
The duration tables provide separate contextual measures: mean minutes across all diary days in a declared population and mean minutes among days containing the category. The first includes days with zero recorded time in that category; the second conditions on positive participation. A reader should check that denominator before comparing a duration with an overlap percentage. The tables retain both measures without turning duration into this article’s main contribution or replacing the earlier participation-and-episode study.
Primary-activity recording also sets an important boundary. If someone reads or listens while reporting another activity as primary, the relevant reading may not appear in the selected category. The analysis does not fill in that unobserved activity or infer simultaneous attention from the existence of two categories somewhere in a day. A reliable account of multitasking, comprehension or complete audiobook listening would need measurements designed for those questions.
What the 2025 shutdown changes about interpretation
No diary dates from 30 September through 11 November 2025 are present in the source sample. BLS’s official weights represent the missing days using the available observations, but the agency cannot quantify the resulting effect on the estimates. Weighting does not turn the absent diaries into observed days. The potential bias therefore remains an uncertainty alongside the sampling intervals rather than being absorbed into their numerical width.
This matters when comparing the endpoints or sharing a single 2025 result. A confidence interval calculated from the available sample describes precision under the stated survey calculation. It is not a complete bound on every source of error. The missing-date limitation does not justify inventing a correction in either direction, and it does not justify declaring the estimates useless. It tells the reader that their interpretation has an additional, unquantified qualification.
Nonresponse, recall and activity classification add other limits. Code labels can remain stable while examples or reporting behaviour change, including examples relating to digital reading and audiobooks. None of those issues can be resolved by renaming the broad categories as books, screens or video games. For a faithful reuse, retain the source definitions, the diary-day scope and the explicit shutdown warning beside any 2025 claim or graphic.
How the combinations and uncertainty were calculated
The analysis uses the official ATUS Activity, Activity Summary and replicate-weight files for 2015 and 2025, with annual lexicons and the September 2026 user guide. The plan and its weekday/weekend addendum were recorded before these new estimates were computed. Each respondent’s records are joined by the unique TUCASEID, and the summed activity duration is checked against a complete 1,440-minute diary.
The 2015 input contains 10,905 respondents and 214,429 activity records; the 2025 input contains 6,146 respondents and 114,151 activities. Selected category durations calculated from the activity records independently match the official summary columns. Those checks protect against mismatched people, missing diary time or inconsistent category construction before any overlap is interpreted. Public outputs contain aggregate counts and estimates, not individual identifiers or respondent-level records.
Full-sample estimates use TUFINLWGT. Each estimate is recalculated with 160 replicate weights, FINLWGT001 through FINLWGT160. For a conditional percentage, its denominator is recalculated within every replicate as well. The variance is four divided by 160 times the sum of squared differences between each replicate estimate and the full-weight estimate. Sampling intervals use the estimate plus or minus 1.96 standard errors; endpoint-difference variances add the two annual variances under the independent-sample assumption.
Use the evidence without turning it into a contest
A useful first check when reading a media headline is whether it describes all diary days or only days containing one activity. Then check the category codes, age range and time unit. Those questions can expose a denominator switch without requiring the reader to reproduce the statistical code. They also help distinguish the observation that activities coexist from an assertion that one competes with or protects another.
The six downloadable aggregate tables contain 399 rows: 112 joint-state estimates, 70 conditional overlaps, 84 duration measures and 56, 35 and 42 corresponding endpoint differences. The broad domains are retained as supporting descriptions within one study. Joint cells with fewer than 30 unweighted events carry an exploratory low-base flag created for this analysis. It is not a BLS suppression rule, and an unflagged cell is not a guarantee against bias.
Bone and colleagues’ 2025 iScience paper, DOI 10.1016/j.isci.2025.113288, already studies US reading participation through 2023 and discusses media displacement as an untested explanation. This article credits that research and the wider media-use literature. Its contribution is an original secondary analysis of joint diary-day membership with explicit denominators and uncertainty. It is not a new respondent survey, a peer-reviewed article or an officially endorsed BLS finding.
A takeaway with the denominator attached
In the 2025 American Time Use Survey, a weighted 73.95% of personal-interest reading diary days also contained television or movies, and 80.78% contained television/movies or games/computer leisure. The population is US civilians outside institutions aged 15 and over, and the unweighted reading-day base is 1,227 respondents. The respective 95% sampling intervals are 70.95–76.94% and 77.73–83.83%. Same-day presence is not simultaneous use or evidence of displacement. Missing diary dates during the 2025 federal shutdown create possible bias that these intervals do not cover.
When quoting the finding, retain the broad games/computer-leisure definition, including board and card games and non-game computer use. Do not add overlapping category percentages or replace reading days with annual readers. For a personal reading plan, the study supplies context about observed combinations, not an optimal schedule. For reporting or research, it supplies auditable aggregate evidence that can be checked against the source definitions and reused with its qualifications intact.
Reading, TV and games on the same diary day
US ages 15+, 2025; shares of all weighted diary days. Reading, TV/movies and games/computer leisure are coded as separate categories.
Full chart and source
Scroll horizontally to inspect the chart. ↔
Chart and values
Scroll horizontally to see all columns.
| Survey year | Declared population or diary-day group | Combination code | Selected-category combination | Unweighted diary count in denominator | Unweighted diaries in combination | Unit | Weighted estimate | Replicate-weight standard error | Lower 95% sampling limit | Upper 95% sampling limit | Editorial flag: fewer than 30 unweighted events |
|---|---|---|---|---|---|---|---|---|---|---|---|
| 2015 | All ages 15 and over | 0 | None of these three categories | 10905 | 1328 | Percent of all weighted diary days in the declared population | 12.5820310792 | 0.4246397735 | 11.7497371232 | 13.4143250352 | No editorial low-event flag |
| 2015 | All ages 15 and over | 1 | Games/computer leisure only | 10905 | 335 | Percent of all weighted diary days in the declared population | 3.3492201665 | 0.2176867172 | 2.9225542009 | 3.7758861321 | No editorial low-event flag |
| 2015 | All ages 15 and over | 2 | TV/movies only | 10905 | 5413 | Percent of all weighted diary days in the declared population | 49.2535928730 | 0.5874412862 | 48.1022079521 | 50.4049777939 | No editorial low-event flag |
| 2015 | All ages 15 and over | 3 | TV/movies + games/computer leisure | 10905 | 1344 | Percent of all weighted diary days in the declared population | 13.6976456180 | 0.4539893180 | 12.8078265547 | 14.5874646813 | No editorial low-event flag |
| 2015 | All ages 15 and over | 4 | Reading only | 10905 | 353 | Percent of all weighted diary days in the declared population | 3.0981566416 | 0.1935939881 | 2.7187124249 | 3.4776008583 | No editorial low-event flag |
| 2015 | All ages 15 and over | 5 | Reading + games/computer leisure | 10905 | 126 | Percent of all weighted diary days in the declared population | 1.1180610728 | 0.1274498283 | 0.8682594093 | 1.3678627362 | No editorial low-event flag |
| 2015 | All ages 15 and over | 6 | Reading + TV/movies | 10905 | 1528 | Percent of all weighted diary days in the declared population | 12.7940374460 | 0.3715143528 | 12.0658693145 | 13.5222055774 | No editorial low-event flag |
| 2015 | All ages 15 and over | 7 | Reading + TV/movies + games/computer leisure | 10905 | 478 | Percent of all weighted diary days in the declared population | 4.1072551029 | 0.2478525846 | 3.6214640370 | 4.5930461688 | No editorial low-event flag |
| 2015 | Ages 18 and over — adult sensitivity | 0 | None of these three categories | 10549 | 1279 | Percent of all weighted diary days in the declared population | 12.4853374804 | 0.4321642324 | 11.6382955850 | 13.3323793758 | No editorial low-event flag |
| 2015 | Ages 18 and over — adult sensitivity | 1 | Games/computer leisure only | 10549 | 293 | Percent of all weighted diary days in the declared population | 2.8158260253 | 0.1971436553 | 2.4294244608 | 3.2022275897 | No editorial low-event flag |
| 2015 | Ages 18 and over — adult sensitivity | 2 | TV/movies only | 10549 | 5282 | Percent of all weighted diary days in the declared population | 50.0246173279 | 0.6143056508 | 48.8205782524 | 51.2286564034 | No editorial low-event flag |
| 2015 | Ages 18 and over — adult sensitivity | 3 | TV/movies + games/computer leisure | 10549 | 1244 | Percent of all weighted diary days in the declared population | 12.9143446261 | 0.4349671198 | 12.0618090713 | 13.7668801810 | No editorial low-event flag |
| 2015 | Ages 18 and over — adult sensitivity | 4 | Reading only | 10549 | 350 | Percent of all weighted diary days in the declared population | 3.2043795159 | 0.2006715157 | 2.8110633451 | 3.5976956867 | No editorial low-event flag |
| 2015 | Ages 18 and over — adult sensitivity | 5 | Reading + games/computer leisure | 10549 | 121 | Percent of all weighted diary days in the declared population | 1.1170119869 | 0.1295635080 | 0.8630675112 | 1.3709564625 | No editorial low-event flag |
| 2015 | Ages 18 and over — adult sensitivity | 6 | Reading + TV/movies | 10549 | 1513 | Percent of all weighted diary days in the declared population | 13.2493155027 | 0.3830343024 | 12.4985682700 | 14.0000627354 | No editorial low-event flag |
| 2015 | Ages 18 and over — adult sensitivity | 7 | Reading + TV/movies + games/computer leisure | 10549 | 467 | Percent of all weighted diary days in the declared population | 4.1891675348 | 0.2583664172 | 3.6827693572 | 4.6955657125 | No editorial low-event flag |
| 2015 | Ages 15–34, including 15–17 | 0 | None of these three categories | 2662 | 433 | Percent of all weighted diary days in the declared population | 16.2352799126 | 0.9592635592 | 14.3551233366 | 18.1154364887 | No editorial low-event flag |
| 2015 | Ages 15–34, including 15–17 | 1 | Games/computer leisure only | 2662 | 136 | Percent of all weighted diary days in the declared population | 5.5383955606 | 0.5163789781 | 4.5262927636 | 6.5504983576 | No editorial low-event flag |
| 2015 | Ages 15–34, including 15–17 | 2 | TV/movies only | 2662 | 1347 | Percent of all weighted diary days in the declared population | 47.9409607406 | 1.1696607653 | 45.6484256406 | 50.2334958406 | No editorial low-event flag |
| 2015 | Ages 15–34, including 15–17 | 3 | TV/movies + games/computer leisure | 2662 | 456 | Percent of all weighted diary days in the declared population | 18.7051214983 | 0.9585858046 | 16.8262933213 | 20.5839496753 | No editorial low-event flag |
| 2015 | Ages 15–34, including 15–17 | 4 | Reading only | 2662 | 48 | Percent of all weighted diary days in the declared population | 2.1836772426 | 0.3976056505 | 1.4043701676 | 2.9629843175 | No editorial low-event flag |
| 2015 | Ages 15–34, including 15–17 | 5 | Reading + games/computer leisure | 2662 | 27 | Percent of all weighted diary days in the declared population | 1.1111566873 | 0.2624004258 | 0.5968518526 | 1.6254615219 | Yes — editorial flag, not BLS suppression |
| 2015 | Ages 15–34, including 15–17 | 6 | Reading + TV/movies | 2662 | 153 | Percent of all weighted diary days in the declared population | 5.6446611011 | 0.5608100594 | 4.5454733847 | 6.7438488175 | No editorial low-event flag |
| 2015 | Ages 15–34, including 15–17 | 7 | Reading + TV/movies + games/computer leisure | 2662 | 62 | Percent of all weighted diary days in the declared population | 2.6407472570 | 0.4154693436 | 1.8264273435 | 3.4550671705 | No editorial low-event flag |
| 2015 | Ages 35–54 | 0 | None of these three categories | 3907 | 588 | Percent of all weighted diary days in the declared population | 15.3603341173 | 0.7041374093 | 13.9802247951 | 16.7404434394 | No editorial low-event flag |
| 2015 | Ages 35–54 | 1 | Games/computer leisure only | 3907 | 136 | Percent of all weighted diary days in the declared population | 3.1224121409 | 0.2965176058 | 2.5412376336 | 3.7035866483 | No editorial low-event flag |
| 2015 | Ages 35–54 | 2 | TV/movies only | 3907 | 2053 | Percent of all weighted diary days in the declared population | 53.6458595656 | 0.9530850609 | 51.7778128462 | 55.5139062850 | No editorial low-event flag |
| 2015 | Ages 35–54 | 3 | TV/movies + games/computer leisure | 3907 | 449 | Percent of all weighted diary days in the declared population | 11.3869856751 | 0.6311298555 | 10.1499711584 | 12.6240001918 | No editorial low-event flag |
| 2015 | Ages 35–54 | 4 | Reading only | 3907 | 143 | Percent of all weighted diary days in the declared population | 3.7608864495 | 0.4060990504 | 2.9649323107 | 4.5568405883 | No editorial low-event flag |
| 2015 | Ages 35–54 | 5 | Reading + games/computer leisure | 3907 | 37 | Percent of all weighted diary days in the declared population | 0.7789059850 | 0.1641437976 | 0.4571841418 | 1.1006278283 | No editorial low-event flag |
| 2015 | Ages 35–54 | 6 | Reading + TV/movies | 3907 | 395 | Percent of all weighted diary days in the declared population | 9.7529285076 | 0.5827771464 | 8.6106853006 | 10.8951717145 | No editorial low-event flag |
| 2015 | Ages 35–54 | 7 | Reading + TV/movies + games/computer leisure | 3907 | 106 | Percent of all weighted diary days in the declared population | 2.1916875590 | 0.2549241515 | 1.6920362220 | 2.6913388959 | No editorial low-event flag |
| 2015 | Ages 55 and over | 0 | None of these three categories | 4336 | 307 | Percent of all weighted diary days in the declared population | 6.3664534788 | 0.3949854380 | 5.5922820204 | 7.1406249372 | No editorial low-event flag |
| 2015 | Ages 55 and over | 1 | Games/computer leisure only | 4336 | 63 | Percent of all weighted diary days in the declared population | 1.4127798295 | 0.2298327652 | 0.9623076096 | 1.8632520493 | No editorial low-event flag |
| 2015 | Ages 55 and over | 2 | TV/movies only | 4336 | 2013 | Percent of all weighted diary days in the declared population | 46.3912724498 | 0.8219576158 | 44.7802355228 | 48.0023093767 | No editorial low-event flag |
| 2015 | Ages 55 and over | 3 | TV/movies + games/computer leisure | 4336 | 439 | Percent of all weighted diary days in the declared population | 10.9621020542 | 0.5720352899 | 9.8409128860 | 12.0832912225 | No editorial low-event flag |
| 2015 | Ages 55 and over | 4 | Reading only | 4336 | 162 | Percent of all weighted diary days in the declared population | 3.3701502080 | 0.3308517516 | 2.7216807749 | 4.0186196412 | No editorial low-event flag |
| 2015 | Ages 55 and over | 5 | Reading + games/computer leisure | 4336 | 62 | Percent of all weighted diary days in the declared population | 1.4454445166 | 0.2407551642 | 0.9735643947 | 1.9173246384 | No editorial low-event flag |
| 2015 | Ages 55 and over | 6 | Reading + TV/movies | 4336 | 980 | Percent of all weighted diary days in the declared population | 22.6929480790 | 0.6782087642 | 21.3636589011 | 24.0222372569 | No editorial low-event flag |
| 2015 | Ages 55 and over | 7 | Reading + TV/movies + games/computer leisure | 4336 | 310 | Percent of all weighted diary days in the declared population | 7.3588493842 | 0.5551661450 | 6.2707237401 | 8.4469750283 | No editorial low-event flag |
| 2015 | Monday–Friday diary days, ages 15 and over | 0 | None of these three categories | 5475 | 694 | Percent of all weighted diary days in the declared population | 12.8497158379 | 0.5624638842 | 11.7472866250 | 13.9521450509 | No editorial low-event flag |
| 2015 | Monday–Friday diary days, ages 15 and over | 1 | Games/computer leisure only | 5475 | 169 | Percent of all weighted diary days in the declared population | 3.2059317844 | 0.2715083661 | 2.6737753869 | 3.7380881819 | No editorial low-event flag |
| 2015 | Monday–Friday diary days, ages 15 and over | 2 | TV/movies only | 5475 | 2710 | Percent of all weighted diary days in the declared population | 49.1985383765 | 0.7401419238 | 47.7478602058 | 50.6492165472 | No editorial low-event flag |
| 2015 | Monday–Friday diary days, ages 15 and over | 3 | TV/movies + games/computer leisure | 5475 | 651 | Percent of all weighted diary days in the declared population | 13.4198847501 | 0.5966066876 | 12.2505356424 | 14.5892338578 | No editorial low-event flag |
| 2015 | Monday–Friday diary days, ages 15 and over | 4 | Reading only | 5475 | 198 | Percent of all weighted diary days in the declared population | 3.3436241004 | 0.2574242015 | 2.8390726655 | 3.8481755353 | No editorial low-event flag |
| 2015 | Monday–Friday diary days, ages 15 and over | 5 | Reading + games/computer leisure | 5475 | 62 | Percent of all weighted diary days in the declared population | 1.1417625018 | 0.1644878715 | 0.8193662738 | 1.4641587299 | No editorial low-event flag |
| 2015 | Monday–Friday diary days, ages 15 and over | 6 | Reading + TV/movies | 5475 | 757 | Percent of all weighted diary days in the declared population | 12.6756872449 | 0.4655493820 | 11.7632104562 | 13.5881640335 | No editorial low-event flag |
| 2015 | Monday–Friday diary days, ages 15 and over | 7 | Reading + TV/movies + games/computer leisure | 5475 | 234 | Percent of all weighted diary days in the declared population | 4.1648554040 | 0.3126475405 | 3.5520662245 | 4.7776445834 | No editorial low-event flag |
| 2015 | Saturday–Sunday diary days, ages 15 and over | 0 | None of these three categories | 5430 | 634 | Percent of all weighted diary days in the declared population | 11.9102231191 | 0.5360594847 | 10.8595465290 | 12.9608997091 | No editorial low-event flag |
| 2015 | Saturday–Sunday diary days, ages 15 and over | 1 | Games/computer leisure only | 5430 | 166 | Percent of all weighted diary days in the declared population | 3.7088307628 | 0.3350009878 | 3.0522288267 | 4.3654326988 | No editorial low-event flag |
| 2015 | Saturday–Sunday diary days, ages 15 and over | 2 | TV/movies only | 5430 | 2703 | Percent of all weighted diary days in the declared population | 49.3917630445 | 0.8338506878 | 47.7574156963 | 51.0261103927 | No editorial low-event flag |
| 2015 | Saturday–Sunday diary days, ages 15 and over | 3 | TV/movies + games/computer leisure | 5430 | 693 | Percent of all weighted diary days in the declared population | 14.3947415713 | 0.5950788136 | 13.2283870966 | 15.5610960461 | No editorial low-event flag |
| 2015 | Saturday–Sunday diary days, ages 15 and over | 4 | Reading only | 5430 | 155 | Percent of all weighted diary days in the declared population | 2.4821073994 | 0.2016560406 | 2.0868615598 | 2.8773532390 | No editorial low-event flag |
| 2015 | Saturday–Sunday diary days, ages 15 and over | 5 | Reading + games/computer leisure | 5430 | 64 | Percent of all weighted diary days in the declared population | 1.0585776386 | 0.1761815328 | 0.7132618343 | 1.4038934429 | No editorial low-event flag |
| 2015 | Saturday–Sunday diary days, ages 15 and over | 6 | Reading + TV/movies | 5430 | 771 | Percent of all weighted diary days in the declared population | 13.0910607339 | 0.4617684495 | 12.1859945728 | 13.9961268950 | No editorial low-event flag |
| 2015 | Saturday–Sunday diary days, ages 15 and over | 7 | Reading + TV/movies + games/computer leisure | 5430 | 244 | Percent of all weighted diary days in the declared population | 3.9626957305 | 0.3480776783 | 3.2804634809 | 4.6449279800 | No editorial low-event flag |
| 2025 | All ages 15 and over | 0 | None of these three categories | 6146 | 803 | Percent of all weighted diary days in the declared population | 15.3165722725 | 0.5937928444 | 14.1527382974 | 16.4804062475 | No editorial low-event flag |
| 2025 | All ages 15 and over | 1 | Games/computer leisure only | 6146 | 256 | Percent of all weighted diary days in the declared population | 6.1449618378 | 0.4832641088 | 5.1977641845 | 7.0921594912 | No editorial low-event flag |
| 2025 | All ages 15 and over | 2 | TV/movies only | 6146 | 2953 | Percent of all weighted diary days in the declared population | 45.9745305349 | 0.8357130432 | 44.3365329703 | 47.6125280994 | No editorial low-event flag |
| 2025 | All ages 15 and over | 3 | TV/movies + games/computer leisure | 6146 | 907 | Percent of all weighted diary days in the declared population | 16.4292420542 | 0.6960456634 | 15.0649925538 | 17.7934915545 | No editorial low-event flag |
| 2025 | All ages 15 and over | 4 | Reading only | 6146 | 189 | Percent of all weighted diary days in the declared population | 3.1009107206 | 0.2694750620 | 2.5727395991 | 3.6290818421 | No editorial low-event flag |
| 2025 | All ages 15 and over | 5 | Reading + games/computer leisure | 6146 | 76 | Percent of all weighted diary days in the declared population | 1.1029796099 | 0.1569803849 | 0.7952980555 | 1.4106611644 | No editorial low-event flag |
| 2025 | All ages 15 and over | 6 | Reading + TV/movies | 6146 | 719 | Percent of all weighted diary days in the declared population | 8.8164165338 | 0.4108199560 | 8.0112094202 | 9.6216236475 | No editorial low-event flag |
| 2025 | All ages 15 and over | 7 | Reading + TV/movies + games/computer leisure | 6146 | 243 | Percent of all weighted diary days in the declared population | 3.1143864363 | 0.2572838386 | 2.6101101126 | 3.6186627601 | No editorial low-event flag |
| 2025 | Ages 18 and over — adult sensitivity | 0 | None of these three categories | 6028 | 782 | Percent of all weighted diary days in the declared population | 15.3925974151 | 0.6002362021 | 14.2161344590 | 16.5690603711 | No editorial low-event flag |
| 2025 | Ages 18 and over — adult sensitivity | 1 | Games/computer leisure only | 6028 | 232 | Percent of all weighted diary days in the declared population | 5.2207468752 | 0.4159964708 | 4.4053937924 | 6.0360999580 | No editorial low-event flag |
| 2025 | Ages 18 and over — adult sensitivity | 2 | TV/movies only | 6028 | 2924 | Percent of all weighted diary days in the declared population | 47.1335190967 | 0.8368671284 | 45.4932595250 | 48.7737786684 | No editorial low-event flag |
| 2025 | Ages 18 and over — adult sensitivity | 3 | TV/movies + games/computer leisure | 6028 | 878 | Percent of all weighted diary days in the declared population | 15.8584546125 | 0.6682765259 | 14.5486326218 | 17.1682766033 | No editorial low-event flag |
| 2025 | Ages 18 and over — adult sensitivity | 4 | Reading only | 6028 | 185 | Percent of all weighted diary days in the declared population | 3.0398542834 | 0.2518230260 | 2.5462811523 | 3.5334274144 | No editorial low-event flag |
| 2025 | Ages 18 and over — adult sensitivity | 5 | Reading + games/computer leisure | 6028 | 73 | Percent of all weighted diary days in the declared population | 1.0577085070 | 0.1504903150 | 0.7627474896 | 1.3526695245 | No editorial low-event flag |
| 2025 | Ages 18 and over — adult sensitivity | 6 | Reading + TV/movies | 6028 | 714 | Percent of all weighted diary days in the declared population | 9.1469337544 | 0.4299590358 | 8.3042140442 | 9.9896534646 | No editorial low-event flag |
| 2025 | Ages 18 and over — adult sensitivity | 7 | Reading + TV/movies + games/computer leisure | 6028 | 240 | Percent of all weighted diary days in the declared population | 3.1501854557 | 0.2597184045 | 2.6411373830 | 3.6592335285 | No editorial low-event flag |
| 2025 | Ages 15–34, including 15–17 | 0 | None of these three categories | 1217 | 224 | Percent of all weighted diary days in the declared population | 18.6905839829 | 1.3475007019 | 16.0494826071 | 21.3316853587 | No editorial low-event flag |
| 2025 | Ages 15–34, including 15–17 | 1 | Games/computer leisure only | 1217 | 128 | Percent of all weighted diary days in the declared population | 13.0138061015 | 1.3691798693 | 10.3302135576 | 15.6973986454 | No editorial low-event flag |
| 2025 | Ages 15–34, including 15–17 | 2 | TV/movies only | 1217 | 461 | Percent of all weighted diary days in the declared population | 35.1303469971 | 1.5935153172 | 32.0070569754 | 38.2536370188 | No editorial low-event flag |
| 2025 | Ages 15–34, including 15–17 | 3 | TV/movies + games/computer leisure | 1217 | 240 | Percent of all weighted diary days in the declared population | 21.8289485788 | 1.5756123265 | 18.7407484188 | 24.9171487388 | No editorial low-event flag |
| 2025 | Ages 15–34, including 15–17 | 4 | Reading only | 1217 | 45 | Percent of all weighted diary days in the declared population | 3.3033448168 | 0.5511026295 | 2.2231836629 | 4.3835059706 | No editorial low-event flag |
| 2025 | Ages 15–34, including 15–17 | 5 | Reading + games/computer leisure | 1217 | 18 | Percent of all weighted diary days in the declared population | 1.3711581035 | 0.3497432967 | 0.6856612420 | 2.0566549650 | Yes — editorial flag, not BLS suppression |
| 2025 | Ages 15–34, including 15–17 | 6 | Reading + TV/movies | 1217 | 71 | Percent of all weighted diary days in the declared population | 4.7849983291 | 0.7400350980 | 3.3345295370 | 6.2354671212 | No editorial low-event flag |
| 2025 | Ages 15–34, including 15–17 | 7 | Reading + TV/movies + games/computer leisure | 1217 | 30 | Percent of all weighted diary days in the declared population | 1.8768130904 | 0.3748191188 | 1.1421676176 | 2.6114585632 | No editorial low-event flag |
| 2025 | Ages 35–54 | 0 | None of these three categories | 1820 | 331 | Percent of all weighted diary days in the declared population | 19.7828751856 | 1.1625178784 | 17.5043401439 | 22.0614102274 | No editorial low-event flag |
| 2025 | Ages 35–54 | 1 | Games/computer leisure only | 1820 | 72 | Percent of all weighted diary days in the declared population | 4.3231959210 | 0.6229837963 | 3.1021476804 | 5.5442441617 | No editorial low-event flag |
| 2025 | Ages 35–54 | 2 | TV/movies only | 1820 | 868 | Percent of all weighted diary days in the declared population | 46.6370646528 | 1.4359657282 | 43.8225718254 | 49.4515574801 | No editorial low-event flag |
| 2025 | Ages 35–54 | 3 | TV/movies + games/computer leisure | 1820 | 271 | Percent of all weighted diary days in the declared population | 15.4104419875 | 1.1588306873 | 13.1391338403 | 17.6817501346 | No editorial low-event flag |
| 2025 | Ages 35–54 | 4 | Reading only | 1820 | 61 | Percent of all weighted diary days in the declared population | 3.3560841418 | 0.5154309318 | 2.3458395155 | 4.3663287681 | No editorial low-event flag |
| 2025 | Ages 35–54 | 5 | Reading + games/computer leisure | 1820 | 18 | Percent of all weighted diary days in the declared population | 0.9495146637 | 0.2784130327 | 0.4038251197 | 1.4952042077 | Yes — editorial flag, not BLS suppression |
| 2025 | Ages 35–54 | 6 | Reading + TV/movies | 1820 | 150 | Percent of all weighted diary days in the declared population | 6.7909640534 | 0.6187621988 | 5.5781901437 | 8.0037379632 | No editorial low-event flag |
| 2025 | Ages 35–54 | 7 | Reading + TV/movies + games/computer leisure | 1820 | 49 | Percent of all weighted diary days in the declared population | 2.7498593942 | 0.4613872993 | 1.8455402875 | 3.6541785008 | No editorial low-event flag |
| 2025 | Ages 55 and over | 0 | None of these three categories | 3109 | 248 | Percent of all weighted diary days in the declared population | 8.6611002110 | 0.6476484647 | 7.3917092203 | 9.9304912018 | No editorial low-event flag |
| 2025 | Ages 55 and over | 1 | Games/computer leisure only | 3109 | 56 | Percent of all weighted diary days in the declared population | 1.6945711100 | 0.2918814458 | 1.1224834761 | 2.2666587438 | No editorial low-event flag |
| 2025 | Ages 55 and over | 2 | TV/movies only | 3109 | 1624 | Percent of all weighted diary days in the declared population | 54.8459654016 | 1.0880329063 | 52.7134209052 | 56.9785098980 | No editorial low-event flag |
| 2025 | Ages 55 and over | 3 | TV/movies + games/computer leisure | 3109 | 396 | Percent of all weighted diary days in the declared population | 12.5861502949 | 0.7633788846 | 11.0899276810 | 14.0823729088 | No editorial low-event flag |
| 2025 | Ages 55 and over | 4 | Reading only | 3109 | 83 | Percent of all weighted diary days in the declared population | 2.7122630192 | 0.3768938029 | 1.9735511654 | 3.4509748729 | No editorial low-event flag |
| 2025 | Ages 55 and over | 5 | Reading + games/computer leisure | 3109 | 40 | Percent of all weighted diary days in the declared population | 0.9978666951 | 0.1826016163 | 0.6399675273 | 1.3557658630 | No editorial low-event flag |
| 2025 | Ages 55 and over | 6 | Reading + TV/movies | 3109 | 498 | Percent of all weighted diary days in the declared population | 14.0083324398 | 0.7405261123 | 12.5569012597 | 15.4597636199 | No editorial low-event flag |
| 2025 | Ages 55 and over | 7 | Reading + TV/movies + games/computer leisure | 3109 | 164 | Percent of all weighted diary days in the declared population | 4.4937508283 | 0.4627514441 | 3.5867579978 | 5.4007436589 | No editorial low-event flag |
| 2025 | Monday–Friday diary days, ages 15 and over | 0 | None of these three categories | 3082 | 437 | Percent of all weighted diary days in the declared population | 15.9587335716 | 0.7589830416 | 14.4711268101 | 17.4463403332 | No editorial low-event flag |
| 2025 | Monday–Friday diary days, ages 15 and over | 1 | Games/computer leisure only | 3082 | 134 | Percent of all weighted diary days in the declared population | 6.4920685102 | 0.6055580769 | 5.3051746794 | 7.6789623410 | No editorial low-event flag |
| 2025 | Monday–Friday diary days, ages 15 and over | 2 | TV/movies only | 3082 | 1444 | Percent of all weighted diary days in the declared population | 45.1858310992 | 1.1088938933 | 43.0123990684 | 47.3592631300 | No editorial low-event flag |
| 2025 | Monday–Friday diary days, ages 15 and over | 3 | TV/movies + games/computer leisure | 3082 | 439 | Percent of all weighted diary days in the declared population | 15.9781480179 | 0.9191065681 | 14.1766991444 | 17.7795968914 | No editorial low-event flag |
| 2025 | Monday–Friday diary days, ages 15 and over | 4 | Reading only | 3082 | 109 | Percent of all weighted diary days in the declared population | 3.5403217539 | 0.3726715362 | 2.8098855429 | 4.2707579649 | No editorial low-event flag |
| 2025 | Monday–Friday diary days, ages 15 and over | 5 | Reading + games/computer leisure | 3082 | 42 | Percent of all weighted diary days in the declared population | 1.1307487385 | 0.2039364697 | 0.7310332579 | 1.5304642191 | No editorial low-event flag |
| 2025 | Monday–Friday diary days, ages 15 and over | 6 | Reading + TV/movies | 3082 | 354 | Percent of all weighted diary days in the declared population | 8.5884454501 | 0.5677554207 | 7.4756448256 | 9.7012460746 | No editorial low-event flag |
| 2025 | Monday–Friday diary days, ages 15 and over | 7 | Reading + TV/movies + games/computer leisure | 3082 | 123 | Percent of all weighted diary days in the declared population | 3.1257028585 | 0.3262731215 | 2.4862075403 | 3.7651981768 | No editorial low-event flag |
| 2025 | Saturday–Sunday diary days, ages 15 and over | 0 | None of these three categories | 3064 | 366 | Percent of all weighted diary days in the declared population | 13.7049499279 | 0.8078436027 | 12.1215764667 | 15.2883233892 | No editorial low-event flag |
| 2025 | Saturday–Sunday diary days, ages 15 and over | 1 | Games/computer leisure only | 3064 | 122 | Percent of all weighted diary days in the declared population | 5.2738335563 | 0.5544277807 | 4.1871551062 | 6.3605120064 | No editorial low-event flag |
| 2025 | Saturday–Sunday diary days, ages 15 and over | 2 | TV/movies only | 3064 | 1509 | Percent of all weighted diary days in the declared population | 47.9539173886 | 1.0558023167 | 45.8845448478 | 50.0232899295 | No editorial low-event flag |
| 2025 | Saturday–Sunday diary days, ages 15 and over | 3 | TV/movies + games/computer leisure | 3064 | 468 | Percent of all weighted diary days in the declared population | 17.5613458251 | 0.8211745741 | 15.9518436598 | 19.1708479904 | No editorial low-event flag |
| 2025 | Saturday–Sunday diary days, ages 15 and over | 4 | Reading only | 3064 | 80 | Percent of all weighted diary days in the declared population | 1.9981276026 | 0.2832297675 | 1.4429972583 | 2.5532579469 | No editorial low-event flag |
| 2025 | Saturday–Sunday diary days, ages 15 and over | 5 | Reading + games/computer leisure | 3064 | 34 | Percent of all weighted diary days in the declared population | 1.0332878547 | 0.2082673982 | 0.6250837543 | 1.4414919552 | No editorial low-event flag |
| 2025 | Saturday–Sunday diary days, ages 15 and over | 6 | Reading + TV/movies | 3064 | 365 | Percent of all weighted diary days in the declared population | 9.3885520595 | 0.5130860766 | 8.3829033493 | 10.3942007696 | No editorial low-event flag |
| 2025 | Saturday–Sunday diary days, ages 15 and over | 7 | Reading + TV/movies + games/computer leisure | 3064 | 120 | Percent of all weighted diary days in the declared population | 3.0859857853 | 0.3254709640 | 2.4480626959 | 3.7239088747 | No editorial low-event flag |
112 rows. Eight exclusive combinations sum to 100% within each population/year, apart from rounding. Denominator: all weighted diary days in that population. Only and none refer solely to the three selected categories. Counts are unweighted; fewer than 30 events is an editorial exploratory flag, not a BLS rule. US civilian noninstitutionalized population aged 15 and over unless the age domain states otherwise; one primary-activity diary per respondent. Same day is not simultaneous activity or a causal effect. Games/computer leisure includes board/card games and non-game computer use; TV includes religious TV and excludes cinema attendance; personal-interest reading is not books only. Weights represent the missing 30 September–11 November 2025 diary dates, but BLS cannot quantify resulting bias; 95% sampling intervals do not cover it.
Other media within personal-interest reading diary days
US ages 15+; each denominator is weighted diary days with reading, not annual book readers. Unweighted reading-day samples: 2,485 in 2015 and 1,227 in 2025.
Full chart and source

Scroll horizontally to inspect the chart. ↔
Chart and values
Scroll horizontally to see all columns.
| Survey year | Declared population or diary-day group | Conditional overlap and denominator | Unweighted diary count in denominator | Unweighted diaries in numerator | Unit | Weighted estimate | Replicate-weight standard error | Lower 95% sampling limit | Upper 95% sampling limit |
|---|---|---|---|---|---|---|---|---|---|
| 2015 | All ages 15 and over | TV/movies among reading diary days | 2485 | 2006 | Percent within the stated weighted diary-day denominator | 80.0344943044 | 0.9795138555 | 78.1146471476 | 81.9543414612 |
| 2015 | All ages 15 and over | Games/computer leisure among reading diary days | 2485 | 604 | Percent within the stated weighted diary-day denominator | 24.7439973299 | 1.2841210460 | 22.2271200797 | 27.2608745800 |
| 2015 | All ages 15 and over | TV/movies or games/computer leisure among reading diary days | 2485 | 2132 | Percent within the stated weighted diary-day denominator | 85.3289682212 | 0.8594016925 | 83.6445409039 | 87.0133955385 |
| 2015 | All ages 15 and over | Reading among TV/movie diary days | 8763 | 2006 | Percent within the stated weighted diary-day denominator | 21.1656316071 | 0.5049944231 | 20.1758425379 | 22.1554206764 |
| 2015 | All ages 15 and over | Reading among games/computer-leisure diary days | 2283 | 604 | Percent within the stated weighted diary-day denominator | 23.4611776476 | 1.1885029244 | 21.1317119157 | 25.7906433795 |
| 2015 | Ages 18 and over — adult sensitivity | TV/movies among reading diary days | 2451 | 1980 | Percent within the stated weighted diary-day denominator | 80.1405495480 | 0.9796140176 | 78.2205060735 | 82.0605930226 |
| 2015 | Ages 18 and over — adult sensitivity | Games/computer leisure among reading diary days | 2451 | 588 | Percent within the stated weighted diary-day denominator | 24.3851567796 | 1.3022147308 | 21.8328159073 | 26.9374976519 |
| 2015 | Ages 18 and over — adult sensitivity | TV/movies or games/computer leisure among reading diary days | 2451 | 2101 | Percent within the stated weighted diary-day denominator | 85.2739062905 | 0.8727621330 | 83.5632925099 | 86.9845200710 |
| 2015 | Ages 18 and over — adult sensitivity | Reading among TV/movie diary days | 8506 | 1980 | Percent within the stated weighted diary-day denominator | 21.6957419328 | 0.5036162142 | 20.7086541530 | 22.6828297126 |
| 2015 | Ages 18 and over — adult sensitivity | Reading among games/computer-leisure diary days | 2125 | 588 | Percent within the stated weighted diary-day denominator | 25.2238600234 | 1.2535689199 | 22.7668649405 | 27.6808551063 |
| 2015 | Ages 15–34, including 15–17 | TV/movies among reading diary days | 290 | 215 | Percent within the stated weighted diary-day denominator | 71.5477979830 | 3.7003674714 | 64.2950777391 | 78.8005182270 |
| 2015 | Ages 15–34, including 15–17 | Games/computer leisure among reading diary days | 290 | 89 | Percent within the stated weighted diary-day denominator | 32.3991834624 | 3.2288776182 | 26.0705833308 | 38.7277835941 |
| 2015 | Ages 15–34, including 15–17 | TV/movies or games/computer leisure among reading diary days | 290 | 242 | Percent within the stated weighted diary-day denominator | 81.1430781130 | 3.1867064839 | 74.8971334046 | 87.3890228213 |
| 2015 | Ages 15–34, including 15–17 | Reading among TV/movie diary days | 2018 | 215 | Percent within the stated weighted diary-day denominator | 11.0573115417 | 0.9628827909 | 9.1700612716 | 12.9445618117 |
| 2015 | Ages 15–34, including 15–17 | Reading among games/computer-leisure diary days | 681 | 89 | Percent within the stated weighted diary-day denominator | 13.4018486232 | 1.5774145277 | 10.3101161489 | 16.4935810974 |
| 2015 | Ages 35–54 | TV/movies among reading diary days | 681 | 501 | Percent within the stated weighted diary-day denominator | 72.4600829067 | 2.1835041200 | 68.1804148316 | 76.7397509818 |
| 2015 | Ages 35–54 | Games/computer leisure among reading diary days | 681 | 143 | Percent within the stated weighted diary-day denominator | 18.0206256343 | 1.8680089205 | 14.3593281501 | 21.6819231185 |
| 2015 | Ages 35–54 | TV/movies or games/computer leisure among reading diary days | 681 | 538 | Percent within the stated weighted diary-day denominator | 77.1851901799 | 2.1571387672 | 72.9571981961 | 81.4131821636 |
| 2015 | Ages 35–54 | Reading among TV/movie diary days | 3003 | 501 | Percent within the stated weighted diary-day denominator | 15.5170303927 | 0.7421013271 | 14.0625117915 | 16.9715489938 |
| 2015 | Ages 35–54 | Reading among games/computer-leisure diary days | 728 | 143 | Percent within the stated weighted diary-day denominator | 16.9942506424 | 1.6788567672 | 13.7036913786 | 20.2848099062 |
| 2015 | Ages 55 and over | TV/movies among reading diary days | 1514 | 1290 | Percent within the stated weighted diary-day denominator | 86.1888302439 | 1.0884052965 | 84.0555558627 | 88.3221046250 |
| 2015 | Ages 55 and over | Games/computer leisure among reading diary days | 1514 | 372 | Percent within the stated weighted diary-day denominator | 25.2507955094 | 1.6303308614 | 22.0553470209 | 28.4462439978 |
| 2015 | Ages 55 and over | TV/movies or games/computer leisure among reading diary days | 1514 | 1352 | Percent within the stated weighted diary-day denominator | 90.3343783502 | 0.9020081088 | 88.5664424569 | 92.1023142435 |
| 2015 | Ages 55 and over | Reading among TV/movie diary days | 3742 | 1290 | Percent within the stated weighted diary-day denominator | 34.3821730303 | 0.8008935311 | 32.8124217094 | 35.9519243512 |
| 2015 | Ages 55 and over | Reading among games/computer-leisure diary days | 874 | 372 | Percent within the stated weighted diary-day denominator | 41.5705218673 | 2.3148006628 | 37.0335125682 | 46.1075311664 |
| 2015 | Monday–Friday diary days, ages 15 and over | TV/movies among reading diary days | 1251 | 991 | Percent within the stated weighted diary-day denominator | 78.9674506116 | 1.2178586936 | 76.5804475722 | 81.3544536510 |
| 2015 | Monday–Friday diary days, ages 15 and over | Games/computer leisure among reading diary days | 1251 | 296 | Percent within the stated weighted diary-day denominator | 24.8834076270 | 1.6129814803 | 21.7219639256 | 28.0448513285 |
| 2015 | Monday–Friday diary days, ages 15 and over | TV/movies or games/computer leisure among reading diary days | 1251 | 1053 | Percent within the stated weighted diary-day denominator | 84.3213204871 | 1.0964769377 | 82.1722256892 | 86.4704152851 |
| 2015 | Monday–Friday diary days, ages 15 and over | Reading among TV/movie diary days | 4352 | 991 | Percent within the stated weighted diary-day denominator | 21.1940118834 | 0.6441515452 | 19.9314748548 | 22.4565489119 |
| 2015 | Monday–Friday diary days, ages 15 and over | Reading among games/computer-leisure diary days | 1116 | 296 | Percent within the stated weighted diary-day denominator | 24.1952981565 | 1.4951655013 | 21.2647737741 | 27.1258225390 |
| 2015 | Saturday–Sunday diary days, ages 15 and over | TV/movies among reading diary days | 1234 | 1015 | Percent within the stated weighted diary-day denominator | 82.8075695201 | 1.2917471024 | 80.2757451994 | 85.3393938408 |
| 2015 | Saturday–Sunday diary days, ages 15 and over | Games/computer leisure among reading diary days | 1234 | 308 | Percent within the stated weighted diary-day denominator | 24.3816923535 | 1.5577403927 | 21.3285211839 | 27.4348635231 |
| 2015 | Saturday–Sunday diary days, ages 15 and over | TV/movies or games/computer leisure among reading diary days | 1234 | 1079 | Percent within the stated weighted diary-day denominator | 87.9476828777 | 0.9761642279 | 86.0344009910 | 89.8609647644 |
| 2015 | Saturday–Sunday diary days, ages 15 and over | Reading among TV/movie diary days | 4411 | 1015 | Percent within the stated weighted diary-day denominator | 21.0956226965 | 0.6947612284 | 19.7338906888 | 22.4573547042 |
| 2015 | Saturday–Sunday diary days, ages 15 and over | Reading among games/computer-leisure diary days | 1167 | 308 | Percent within the stated weighted diary-day denominator | 21.7137594494 | 1.5278846700 | 18.7191054962 | 24.7084134026 |
| 2025 | All ages 15 and over | TV/movies among reading diary days | 1227 | 962 | Percent within the stated weighted diary-day denominator | 73.9450248469 | 1.5279914928 | 70.9501615210 | 76.9398881728 |
| 2025 | All ages 15 and over | Games/computer leisure among reading diary days | 1227 | 319 | Percent within the stated weighted diary-day denominator | 26.1384952763 | 1.7339314727 | 22.7399895899 | 29.5370009628 |
| 2025 | All ages 15 and over | TV/movies or games/computer leisure among reading diary days | 1227 | 1038 | Percent within the stated weighted diary-day denominator | 80.7810990715 | 1.5562937494 | 77.7307633227 | 83.8314348203 |
| 2025 | All ages 15 and over | Reading among TV/movie diary days | 4822 | 962 | Percent within the stated weighted diary-day denominator | 16.0501393603 | 0.6187767760 | 14.8373368794 | 17.2629418413 |
| 2025 | All ages 15 and over | Reading among games/computer-leisure diary days | 1482 | 319 | Percent within the stated weighted diary-day denominator | 15.7413919974 | 1.1312619344 | 13.5241186059 | 17.9586653889 |
| 2025 | Ages 18 and over — adult sensitivity | TV/movies among reading diary days | 1212 | 954 | Percent within the stated weighted diary-day denominator | 75.0067565187 | 1.4863093837 | 72.0935901266 | 77.9199229108 |
| 2025 | Ages 18 and over — adult sensitivity | Games/computer leisure among reading diary days | 1212 | 313 | Percent within the stated weighted diary-day denominator | 25.6662127551 | 1.6686480463 | 22.3956625843 | 28.9367629258 |
| 2025 | Ages 18 and over — adult sensitivity | TV/movies or games/computer leisure among reading diary days | 1212 | 1027 | Percent within the stated weighted diary-day denominator | 81.4582906624 | 1.4662764931 | 78.5843887360 | 84.3321925889 |
| 2025 | Ages 18 and over — adult sensitivity | Reading among TV/movie diary days | 4756 | 954 | Percent within the stated weighted diary-day denominator | 16.3332014417 | 0.6354879799 | 15.0876450010 | 17.5787578824 |
| 2025 | Ages 18 and over — adult sensitivity | Reading among games/computer-leisure diary days | 1423 | 313 | Percent within the stated weighted diary-day denominator | 16.6404796115 | 1.1807328535 | 14.3262432186 | 18.9547160043 |
| 2025 | Ages 15–34, including 15–17 | TV/movies among reading diary days | 164 | 101 | Percent within the stated weighted diary-day denominator | 58.7652319779 | 4.4938378900 | 49.9573097134 | 67.5731542424 |
| 2025 | Ages 15–34, including 15–17 | Games/computer leisure among reading diary days | 164 | 48 | Percent within the stated weighted diary-day denominator | 28.6510332773 | 4.1595976886 | 20.4982218077 | 36.8038447470 |
| 2025 | Ages 15–34, including 15–17 | TV/movies or games/computer leisure among reading diary days | 164 | 119 | Percent within the stated weighted diary-day denominator | 70.8605044130 | 4.4167983852 | 62.2035795781 | 79.5174292480 |
| 2025 | Ages 15–34, including 15–17 | Reading among TV/movie diary days | 802 | 101 | Percent within the stated weighted diary-day denominator | 10.4710712122 | 1.2920732708 | 7.9386076014 | 13.0035348230 |
| 2025 | Ages 15–34, including 15–17 | Reading among games/computer-leisure diary days | 416 | 48 | Percent within the stated weighted diary-day denominator | 8.5269343636 | 1.3527381260 | 5.8755676365 | 11.1783010906 |
| 2025 | Ages 35–54 | TV/movies among reading diary days | 278 | 199 | Percent within the stated weighted diary-day denominator | 68.9046114096 | 3.4278144899 | 62.1860950093 | 75.6231278099 |
| 2025 | Ages 35–54 | Games/computer leisure among reading diary days | 278 | 67 | Percent within the stated weighted diary-day denominator | 26.7171836177 | 3.4581343095 | 19.9392403710 | 33.4951268644 |
| 2025 | Ages 35–54 | TV/movies or games/computer leisure among reading diary days | 278 | 217 | Percent within the stated weighted diary-day denominator | 75.7620843822 | 3.2537740707 | 69.3846872036 | 82.1394815607 |
| 2025 | Ages 35–54 | Reading among TV/movie diary days | 1338 | 199 | Percent within the stated weighted diary-day denominator | 13.3273446048 | 1.0355752946 | 11.2976170275 | 15.3570721821 |
| 2025 | Ages 35–54 | Reading among games/computer-leisure diary days | 410 | 67 | Percent within the stated weighted diary-day denominator | 15.7870190275 | 2.3111787528 | 11.2571086720 | 20.3169293829 |
| 2025 | Ages 55 and over | TV/movies among reading diary days | 785 | 662 | Percent within the stated weighted diary-day denominator | 83.2968929424 | 1.7425638231 | 79.8814678490 | 86.7123180357 |
| 2025 | Ages 55 and over | Games/computer leisure among reading diary days | 785 | 204 | Percent within the stated weighted diary-day denominator | 24.7234146720 | 2.0051511200 | 20.7933184767 | 28.6535108672 |
| 2025 | Ages 55 and over | TV/movies or games/computer leisure among reading diary days | 785 | 702 | Percent within the stated weighted diary-day denominator | 87.7893165291 | 1.6294108424 | 84.5956712779 | 90.9829617802 |
| 2025 | Ages 55 and over | Reading among TV/movie diary days | 2682 | 662 | Percent within the stated weighted diary-day denominator | 21.5305239254 | 0.9504582347 | 19.6676257853 | 23.3934220654 |
| 2025 | Ages 55 and over | Reading among games/computer-leisure diary days | 656 | 204 | Percent within the stated weighted diary-day denominator | 27.7742433172 | 2.1931392279 | 23.4756904305 | 32.0727962040 |
| 2025 | Monday–Friday diary days, ages 15 and over | TV/movies among reading diary days | 628 | 477 | Percent within the stated weighted diary-day denominator | 71.4921689536 | 2.1275621763 | 67.3221470880 | 75.6621908191 |
| 2025 | Monday–Friday diary days, ages 15 and over | Games/computer leisure among reading diary days | 628 | 165 | Percent within the stated weighted diary-day denominator | 25.9773863793 | 2.1443218239 | 21.7745156045 | 30.1802571541 |
| 2025 | Monday–Friday diary days, ages 15 and over | TV/movies or games/computer leisure among reading diary days | 628 | 519 | Percent within the stated weighted diary-day denominator | 78.3931981814 | 2.1075529399 | 74.2623944192 | 82.5240019435 |
| 2025 | Monday–Friday diary days, ages 15 and over | Reading among TV/movie diary days | 2360 | 477 | Percent within the stated weighted diary-day denominator | 16.0736131984 | 0.8662122812 | 14.3758371273 | 17.7713892695 |
| 2025 | Monday–Friday diary days, ages 15 and over | Reading among games/computer-leisure diary days | 738 | 165 | Percent within the stated weighted diary-day denominator | 15.9258594342 | 1.4445870297 | 13.0944688559 | 18.7572500124 |
| 2025 | Saturday–Sunday diary days, ages 15 and over | TV/movies among reading diary days | 599 | 485 | Percent within the stated weighted diary-day denominator | 80.4499897668 | 1.9505000272 | 76.6270097135 | 84.2729698200 |
| 2025 | Saturday–Sunday diary days, ages 15 and over | Games/computer leisure among reading diary days | 599 | 154 | Percent within the stated weighted diary-day denominator | 26.5657554861 | 2.1555097006 | 22.3409564730 | 30.7905544993 |
| 2025 | Saturday–Sunday diary days, ages 15 and over | TV/movies or games/computer leisure among reading diary days | 599 | 519 | Percent within the stated weighted diary-day denominator | 87.1138035588 | 1.6945655514 | 83.7924550780 | 90.4351520396 |
| 2025 | Saturday–Sunday diary days, ages 15 and over | Reading among TV/movie diary days | 2462 | 485 | Percent within the stated weighted diary-day denominator | 15.9950886852 | 0.7513918884 | 14.5223605839 | 17.4678167865 |
| 2025 | Saturday–Sunday diary days, ages 15 and over | Reading among games/computer-leisure diary days | 744 | 154 | Percent within the stated weighted diary-day denominator | 15.2823492161 | 1.4116997695 | 12.5154176679 | 18.0492807643 |
70 rows. Each conditional measure specifies its own weighted diary-day denominator. Raw denominator and event counts are unweighted and do not reproduce the weighted percentage. TV and games/computer overlap; their percentages must not be added to obtain either. Reverse conditional measures use different denominators. US civilian noninstitutionalized population aged 15 and over unless the age domain states otherwise; one primary-activity diary per respondent. Same day is not simultaneous activity or a causal effect. Games/computer leisure includes board/card games and non-game computer use; TV includes religious TV and excludes cinema attendance; personal-interest reading is not books only. Weights represent the missing 30 September–11 November 2025 diary dates, but BLS cannot quantify resulting bias; 95% sampling intervals do not cover it.

Reading plus other media across age groups
US 2025; TV/movies or games/computer leisure on a diary day that also contains personal-interest reading. Each age group has its own reading-day denominator.
Full chart and source
Scroll horizontally to inspect the chart. ↔
Chart and values
Scroll horizontally to see all columns.
| Survey year | Declared population or diary-day group | Conditional overlap and denominator | Unweighted diary count in denominator | Unweighted diaries in numerator | Unit | Weighted estimate | Replicate-weight standard error | Lower 95% sampling limit | Upper 95% sampling limit |
|---|---|---|---|---|---|---|---|---|---|
| 2015 | All ages 15 and over | TV/movies among reading diary days | 2485 | 2006 | Percent within the stated weighted diary-day denominator | 80.0344943044 | 0.9795138555 | 78.1146471476 | 81.9543414612 |
| 2015 | All ages 15 and over | Games/computer leisure among reading diary days | 2485 | 604 | Percent within the stated weighted diary-day denominator | 24.7439973299 | 1.2841210460 | 22.2271200797 | 27.2608745800 |
| 2015 | All ages 15 and over | TV/movies or games/computer leisure among reading diary days | 2485 | 2132 | Percent within the stated weighted diary-day denominator | 85.3289682212 | 0.8594016925 | 83.6445409039 | 87.0133955385 |
| 2015 | All ages 15 and over | Reading among TV/movie diary days | 8763 | 2006 | Percent within the stated weighted diary-day denominator | 21.1656316071 | 0.5049944231 | 20.1758425379 | 22.1554206764 |
| 2015 | All ages 15 and over | Reading among games/computer-leisure diary days | 2283 | 604 | Percent within the stated weighted diary-day denominator | 23.4611776476 | 1.1885029244 | 21.1317119157 | 25.7906433795 |
| 2015 | Ages 18 and over — adult sensitivity | TV/movies among reading diary days | 2451 | 1980 | Percent within the stated weighted diary-day denominator | 80.1405495480 | 0.9796140176 | 78.2205060735 | 82.0605930226 |
| 2015 | Ages 18 and over — adult sensitivity | Games/computer leisure among reading diary days | 2451 | 588 | Percent within the stated weighted diary-day denominator | 24.3851567796 | 1.3022147308 | 21.8328159073 | 26.9374976519 |
| 2015 | Ages 18 and over — adult sensitivity | TV/movies or games/computer leisure among reading diary days | 2451 | 2101 | Percent within the stated weighted diary-day denominator | 85.2739062905 | 0.8727621330 | 83.5632925099 | 86.9845200710 |
| 2015 | Ages 18 and over — adult sensitivity | Reading among TV/movie diary days | 8506 | 1980 | Percent within the stated weighted diary-day denominator | 21.6957419328 | 0.5036162142 | 20.7086541530 | 22.6828297126 |
| 2015 | Ages 18 and over — adult sensitivity | Reading among games/computer-leisure diary days | 2125 | 588 | Percent within the stated weighted diary-day denominator | 25.2238600234 | 1.2535689199 | 22.7668649405 | 27.6808551063 |
| 2015 | Ages 15–34, including 15–17 | TV/movies among reading diary days | 290 | 215 | Percent within the stated weighted diary-day denominator | 71.5477979830 | 3.7003674714 | 64.2950777391 | 78.8005182270 |
| 2015 | Ages 15–34, including 15–17 | Games/computer leisure among reading diary days | 290 | 89 | Percent within the stated weighted diary-day denominator | 32.3991834624 | 3.2288776182 | 26.0705833308 | 38.7277835941 |
| 2015 | Ages 15–34, including 15–17 | TV/movies or games/computer leisure among reading diary days | 290 | 242 | Percent within the stated weighted diary-day denominator | 81.1430781130 | 3.1867064839 | 74.8971334046 | 87.3890228213 |
| 2015 | Ages 15–34, including 15–17 | Reading among TV/movie diary days | 2018 | 215 | Percent within the stated weighted diary-day denominator | 11.0573115417 | 0.9628827909 | 9.1700612716 | 12.9445618117 |
| 2015 | Ages 15–34, including 15–17 | Reading among games/computer-leisure diary days | 681 | 89 | Percent within the stated weighted diary-day denominator | 13.4018486232 | 1.5774145277 | 10.3101161489 | 16.4935810974 |
| 2015 | Ages 35–54 | TV/movies among reading diary days | 681 | 501 | Percent within the stated weighted diary-day denominator | 72.4600829067 | 2.1835041200 | 68.1804148316 | 76.7397509818 |
| 2015 | Ages 35–54 | Games/computer leisure among reading diary days | 681 | 143 | Percent within the stated weighted diary-day denominator | 18.0206256343 | 1.8680089205 | 14.3593281501 | 21.6819231185 |
| 2015 | Ages 35–54 | TV/movies or games/computer leisure among reading diary days | 681 | 538 | Percent within the stated weighted diary-day denominator | 77.1851901799 | 2.1571387672 | 72.9571981961 | 81.4131821636 |
| 2015 | Ages 35–54 | Reading among TV/movie diary days | 3003 | 501 | Percent within the stated weighted diary-day denominator | 15.5170303927 | 0.7421013271 | 14.0625117915 | 16.9715489938 |
| 2015 | Ages 35–54 | Reading among games/computer-leisure diary days | 728 | 143 | Percent within the stated weighted diary-day denominator | 16.9942506424 | 1.6788567672 | 13.7036913786 | 20.2848099062 |
| 2015 | Ages 55 and over | TV/movies among reading diary days | 1514 | 1290 | Percent within the stated weighted diary-day denominator | 86.1888302439 | 1.0884052965 | 84.0555558627 | 88.3221046250 |
| 2015 | Ages 55 and over | Games/computer leisure among reading diary days | 1514 | 372 | Percent within the stated weighted diary-day denominator | 25.2507955094 | 1.6303308614 | 22.0553470209 | 28.4462439978 |
| 2015 | Ages 55 and over | TV/movies or games/computer leisure among reading diary days | 1514 | 1352 | Percent within the stated weighted diary-day denominator | 90.3343783502 | 0.9020081088 | 88.5664424569 | 92.1023142435 |
| 2015 | Ages 55 and over | Reading among TV/movie diary days | 3742 | 1290 | Percent within the stated weighted diary-day denominator | 34.3821730303 | 0.8008935311 | 32.8124217094 | 35.9519243512 |
| 2015 | Ages 55 and over | Reading among games/computer-leisure diary days | 874 | 372 | Percent within the stated weighted diary-day denominator | 41.5705218673 | 2.3148006628 | 37.0335125682 | 46.1075311664 |
| 2015 | Monday–Friday diary days, ages 15 and over | TV/movies among reading diary days | 1251 | 991 | Percent within the stated weighted diary-day denominator | 78.9674506116 | 1.2178586936 | 76.5804475722 | 81.3544536510 |
| 2015 | Monday–Friday diary days, ages 15 and over | Games/computer leisure among reading diary days | 1251 | 296 | Percent within the stated weighted diary-day denominator | 24.8834076270 | 1.6129814803 | 21.7219639256 | 28.0448513285 |
| 2015 | Monday–Friday diary days, ages 15 and over | TV/movies or games/computer leisure among reading diary days | 1251 | 1053 | Percent within the stated weighted diary-day denominator | 84.3213204871 | 1.0964769377 | 82.1722256892 | 86.4704152851 |
| 2015 | Monday–Friday diary days, ages 15 and over | Reading among TV/movie diary days | 4352 | 991 | Percent within the stated weighted diary-day denominator | 21.1940118834 | 0.6441515452 | 19.9314748548 | 22.4565489119 |
| 2015 | Monday–Friday diary days, ages 15 and over | Reading among games/computer-leisure diary days | 1116 | 296 | Percent within the stated weighted diary-day denominator | 24.1952981565 | 1.4951655013 | 21.2647737741 | 27.1258225390 |
| 2015 | Saturday–Sunday diary days, ages 15 and over | TV/movies among reading diary days | 1234 | 1015 | Percent within the stated weighted diary-day denominator | 82.8075695201 | 1.2917471024 | 80.2757451994 | 85.3393938408 |
| 2015 | Saturday–Sunday diary days, ages 15 and over | Games/computer leisure among reading diary days | 1234 | 308 | Percent within the stated weighted diary-day denominator | 24.3816923535 | 1.5577403927 | 21.3285211839 | 27.4348635231 |
| 2015 | Saturday–Sunday diary days, ages 15 and over | TV/movies or games/computer leisure among reading diary days | 1234 | 1079 | Percent within the stated weighted diary-day denominator | 87.9476828777 | 0.9761642279 | 86.0344009910 | 89.8609647644 |
| 2015 | Saturday–Sunday diary days, ages 15 and over | Reading among TV/movie diary days | 4411 | 1015 | Percent within the stated weighted diary-day denominator | 21.0956226965 | 0.6947612284 | 19.7338906888 | 22.4573547042 |
| 2015 | Saturday–Sunday diary days, ages 15 and over | Reading among games/computer-leisure diary days | 1167 | 308 | Percent within the stated weighted diary-day denominator | 21.7137594494 | 1.5278846700 | 18.7191054962 | 24.7084134026 |
| 2025 | All ages 15 and over | TV/movies among reading diary days | 1227 | 962 | Percent within the stated weighted diary-day denominator | 73.9450248469 | 1.5279914928 | 70.9501615210 | 76.9398881728 |
| 2025 | All ages 15 and over | Games/computer leisure among reading diary days | 1227 | 319 | Percent within the stated weighted diary-day denominator | 26.1384952763 | 1.7339314727 | 22.7399895899 | 29.5370009628 |
| 2025 | All ages 15 and over | TV/movies or games/computer leisure among reading diary days | 1227 | 1038 | Percent within the stated weighted diary-day denominator | 80.7810990715 | 1.5562937494 | 77.7307633227 | 83.8314348203 |
| 2025 | All ages 15 and over | Reading among TV/movie diary days | 4822 | 962 | Percent within the stated weighted diary-day denominator | 16.0501393603 | 0.6187767760 | 14.8373368794 | 17.2629418413 |
| 2025 | All ages 15 and over | Reading among games/computer-leisure diary days | 1482 | 319 | Percent within the stated weighted diary-day denominator | 15.7413919974 | 1.1312619344 | 13.5241186059 | 17.9586653889 |
| 2025 | Ages 18 and over — adult sensitivity | TV/movies among reading diary days | 1212 | 954 | Percent within the stated weighted diary-day denominator | 75.0067565187 | 1.4863093837 | 72.0935901266 | 77.9199229108 |
| 2025 | Ages 18 and over — adult sensitivity | Games/computer leisure among reading diary days | 1212 | 313 | Percent within the stated weighted diary-day denominator | 25.6662127551 | 1.6686480463 | 22.3956625843 | 28.9367629258 |
| 2025 | Ages 18 and over — adult sensitivity | TV/movies or games/computer leisure among reading diary days | 1212 | 1027 | Percent within the stated weighted diary-day denominator | 81.4582906624 | 1.4662764931 | 78.5843887360 | 84.3321925889 |
| 2025 | Ages 18 and over — adult sensitivity | Reading among TV/movie diary days | 4756 | 954 | Percent within the stated weighted diary-day denominator | 16.3332014417 | 0.6354879799 | 15.0876450010 | 17.5787578824 |
| 2025 | Ages 18 and over — adult sensitivity | Reading among games/computer-leisure diary days | 1423 | 313 | Percent within the stated weighted diary-day denominator | 16.6404796115 | 1.1807328535 | 14.3262432186 | 18.9547160043 |
| 2025 | Ages 15–34, including 15–17 | TV/movies among reading diary days | 164 | 101 | Percent within the stated weighted diary-day denominator | 58.7652319779 | 4.4938378900 | 49.9573097134 | 67.5731542424 |
| 2025 | Ages 15–34, including 15–17 | Games/computer leisure among reading diary days | 164 | 48 | Percent within the stated weighted diary-day denominator | 28.6510332773 | 4.1595976886 | 20.4982218077 | 36.8038447470 |
| 2025 | Ages 15–34, including 15–17 | TV/movies or games/computer leisure among reading diary days | 164 | 119 | Percent within the stated weighted diary-day denominator | 70.8605044130 | 4.4167983852 | 62.2035795781 | 79.5174292480 |
| 2025 | Ages 15–34, including 15–17 | Reading among TV/movie diary days | 802 | 101 | Percent within the stated weighted diary-day denominator | 10.4710712122 | 1.2920732708 | 7.9386076014 | 13.0035348230 |
| 2025 | Ages 15–34, including 15–17 | Reading among games/computer-leisure diary days | 416 | 48 | Percent within the stated weighted diary-day denominator | 8.5269343636 | 1.3527381260 | 5.8755676365 | 11.1783010906 |
| 2025 | Ages 35–54 | TV/movies among reading diary days | 278 | 199 | Percent within the stated weighted diary-day denominator | 68.9046114096 | 3.4278144899 | 62.1860950093 | 75.6231278099 |
| 2025 | Ages 35–54 | Games/computer leisure among reading diary days | 278 | 67 | Percent within the stated weighted diary-day denominator | 26.7171836177 | 3.4581343095 | 19.9392403710 | 33.4951268644 |
| 2025 | Ages 35–54 | TV/movies or games/computer leisure among reading diary days | 278 | 217 | Percent within the stated weighted diary-day denominator | 75.7620843822 | 3.2537740707 | 69.3846872036 | 82.1394815607 |
| 2025 | Ages 35–54 | Reading among TV/movie diary days | 1338 | 199 | Percent within the stated weighted diary-day denominator | 13.3273446048 | 1.0355752946 | 11.2976170275 | 15.3570721821 |
| 2025 | Ages 35–54 | Reading among games/computer-leisure diary days | 410 | 67 | Percent within the stated weighted diary-day denominator | 15.7870190275 | 2.3111787528 | 11.2571086720 | 20.3169293829 |
| 2025 | Ages 55 and over | TV/movies among reading diary days | 785 | 662 | Percent within the stated weighted diary-day denominator | 83.2968929424 | 1.7425638231 | 79.8814678490 | 86.7123180357 |
| 2025 | Ages 55 and over | Games/computer leisure among reading diary days | 785 | 204 | Percent within the stated weighted diary-day denominator | 24.7234146720 | 2.0051511200 | 20.7933184767 | 28.6535108672 |
| 2025 | Ages 55 and over | TV/movies or games/computer leisure among reading diary days | 785 | 702 | Percent within the stated weighted diary-day denominator | 87.7893165291 | 1.6294108424 | 84.5956712779 | 90.9829617802 |
| 2025 | Ages 55 and over | Reading among TV/movie diary days | 2682 | 662 | Percent within the stated weighted diary-day denominator | 21.5305239254 | 0.9504582347 | 19.6676257853 | 23.3934220654 |
| 2025 | Ages 55 and over | Reading among games/computer-leisure diary days | 656 | 204 | Percent within the stated weighted diary-day denominator | 27.7742433172 | 2.1931392279 | 23.4756904305 | 32.0727962040 |
| 2025 | Monday–Friday diary days, ages 15 and over | TV/movies among reading diary days | 628 | 477 | Percent within the stated weighted diary-day denominator | 71.4921689536 | 2.1275621763 | 67.3221470880 | 75.6621908191 |
| 2025 | Monday–Friday diary days, ages 15 and over | Games/computer leisure among reading diary days | 628 | 165 | Percent within the stated weighted diary-day denominator | 25.9773863793 | 2.1443218239 | 21.7745156045 | 30.1802571541 |
| 2025 | Monday–Friday diary days, ages 15 and over | TV/movies or games/computer leisure among reading diary days | 628 | 519 | Percent within the stated weighted diary-day denominator | 78.3931981814 | 2.1075529399 | 74.2623944192 | 82.5240019435 |
| 2025 | Monday–Friday diary days, ages 15 and over | Reading among TV/movie diary days | 2360 | 477 | Percent within the stated weighted diary-day denominator | 16.0736131984 | 0.8662122812 | 14.3758371273 | 17.7713892695 |
| 2025 | Monday–Friday diary days, ages 15 and over | Reading among games/computer-leisure diary days | 738 | 165 | Percent within the stated weighted diary-day denominator | 15.9258594342 | 1.4445870297 | 13.0944688559 | 18.7572500124 |
| 2025 | Saturday–Sunday diary days, ages 15 and over | TV/movies among reading diary days | 599 | 485 | Percent within the stated weighted diary-day denominator | 80.4499897668 | 1.9505000272 | 76.6270097135 | 84.2729698200 |
| 2025 | Saturday–Sunday diary days, ages 15 and over | Games/computer leisure among reading diary days | 599 | 154 | Percent within the stated weighted diary-day denominator | 26.5657554861 | 2.1555097006 | 22.3409564730 | 30.7905544993 |
| 2025 | Saturday–Sunday diary days, ages 15 and over | TV/movies or games/computer leisure among reading diary days | 599 | 519 | Percent within the stated weighted diary-day denominator | 87.1138035588 | 1.6945655514 | 83.7924550780 | 90.4351520396 |
| 2025 | Saturday–Sunday diary days, ages 15 and over | Reading among TV/movie diary days | 2462 | 485 | Percent within the stated weighted diary-day denominator | 15.9950886852 | 0.7513918884 | 14.5223605839 | 17.4678167865 |
| 2025 | Saturday–Sunday diary days, ages 15 and over | Reading among games/computer-leisure diary days | 744 | 154 | Percent within the stated weighted diary-day denominator | 15.2823492161 | 1.4116997695 | 12.5154176679 | 18.0492807643 |
70 rows. Each conditional measure specifies its own weighted diary-day denominator. Raw denominator and event counts are unweighted and do not reproduce the weighted percentage. TV and games/computer overlap; their percentages must not be added to obtain either. Reverse conditional measures use different denominators. US civilian noninstitutionalized population aged 15 and over unless the age domain states otherwise; one primary-activity diary per respondent. Same day is not simultaneous activity or a causal effect. Games/computer leisure includes board/card games and non-game computer use; TV includes religious TV and excludes cinema attendance; personal-interest reading is not books only. Weights represent the missing 30 September–11 November 2025 diary dates, but BLS cannot quantify resulting bias; 95% sampling intervals do not cover it.

Data & downloads
Scroll horizontally to see all columns.
| Survey year | Declared population or diary-day group | Combination code | Selected-category combination | Unweighted diary count in denominator | Unweighted diaries in combination | Unit | Weighted estimate | Replicate-weight standard error | Lower 95% sampling limit | Upper 95% sampling limit | Editorial flag: fewer than 30 unweighted events |
|---|---|---|---|---|---|---|---|---|---|---|---|
| 2015 | All ages 15 and over | 0 | None of these three categories | 10905 | 1328 | Percent of all weighted diary days in the declared population | 12.5820310792 | 0.4246397735 | 11.7497371232 | 13.4143250352 | No editorial low-event flag |
| 2015 | All ages 15 and over | 1 | Games/computer leisure only | 10905 | 335 | Percent of all weighted diary days in the declared population | 3.3492201665 | 0.2176867172 | 2.9225542009 | 3.7758861321 | No editorial low-event flag |
| 2015 | All ages 15 and over | 2 | TV/movies only | 10905 | 5413 | Percent of all weighted diary days in the declared population | 49.2535928730 | 0.5874412862 | 48.1022079521 | 50.4049777939 | No editorial low-event flag |
| 2015 | All ages 15 and over | 3 | TV/movies + games/computer leisure | 10905 | 1344 | Percent of all weighted diary days in the declared population | 13.6976456180 | 0.4539893180 | 12.8078265547 | 14.5874646813 | No editorial low-event flag |
| 2015 | All ages 15 and over | 4 | Reading only | 10905 | 353 | Percent of all weighted diary days in the declared population | 3.0981566416 | 0.1935939881 | 2.7187124249 | 3.4776008583 | No editorial low-event flag |
| 2015 | All ages 15 and over | 5 | Reading + games/computer leisure | 10905 | 126 | Percent of all weighted diary days in the declared population | 1.1180610728 | 0.1274498283 | 0.8682594093 | 1.3678627362 | No editorial low-event flag |
| 2015 | All ages 15 and over | 6 | Reading + TV/movies | 10905 | 1528 | Percent of all weighted diary days in the declared population | 12.7940374460 | 0.3715143528 | 12.0658693145 | 13.5222055774 | No editorial low-event flag |
| 2015 | All ages 15 and over | 7 | Reading + TV/movies + games/computer leisure | 10905 | 478 | Percent of all weighted diary days in the declared population | 4.1072551029 | 0.2478525846 | 3.6214640370 | 4.5930461688 | No editorial low-event flag |
| 2015 | Ages 18 and over — adult sensitivity | 0 | None of these three categories | 10549 | 1279 | Percent of all weighted diary days in the declared population | 12.4853374804 | 0.4321642324 | 11.6382955850 | 13.3323793758 | No editorial low-event flag |
| 2015 | Ages 18 and over — adult sensitivity | 1 | Games/computer leisure only | 10549 | 293 | Percent of all weighted diary days in the declared population | 2.8158260253 | 0.1971436553 | 2.4294244608 | 3.2022275897 | No editorial low-event flag |
| 2015 | Ages 18 and over — adult sensitivity | 2 | TV/movies only | 10549 | 5282 | Percent of all weighted diary days in the declared population | 50.0246173279 | 0.6143056508 | 48.8205782524 | 51.2286564034 | No editorial low-event flag |
| 2015 | Ages 18 and over — adult sensitivity | 3 | TV/movies + games/computer leisure | 10549 | 1244 | Percent of all weighted diary days in the declared population | 12.9143446261 | 0.4349671198 | 12.0618090713 | 13.7668801810 | No editorial low-event flag |
| 2015 | Ages 18 and over — adult sensitivity | 4 | Reading only | 10549 | 350 | Percent of all weighted diary days in the declared population | 3.2043795159 | 0.2006715157 | 2.8110633451 | 3.5976956867 | No editorial low-event flag |
| 2015 | Ages 18 and over — adult sensitivity | 5 | Reading + games/computer leisure | 10549 | 121 | Percent of all weighted diary days in the declared population | 1.1170119869 | 0.1295635080 | 0.8630675112 | 1.3709564625 | No editorial low-event flag |
| 2015 | Ages 18 and over — adult sensitivity | 6 | Reading + TV/movies | 10549 | 1513 | Percent of all weighted diary days in the declared population | 13.2493155027 | 0.3830343024 | 12.4985682700 | 14.0000627354 | No editorial low-event flag |
| 2015 | Ages 18 and over — adult sensitivity | 7 | Reading + TV/movies + games/computer leisure | 10549 | 467 | Percent of all weighted diary days in the declared population | 4.1891675348 | 0.2583664172 | 3.6827693572 | 4.6955657125 | No editorial low-event flag |
| 2015 | Ages 15–34, including 15–17 | 0 | None of these three categories | 2662 | 433 | Percent of all weighted diary days in the declared population | 16.2352799126 | 0.9592635592 | 14.3551233366 | 18.1154364887 | No editorial low-event flag |
| 2015 | Ages 15–34, including 15–17 | 1 | Games/computer leisure only | 2662 | 136 | Percent of all weighted diary days in the declared population | 5.5383955606 | 0.5163789781 | 4.5262927636 | 6.5504983576 | No editorial low-event flag |
| 2015 | Ages 15–34, including 15–17 | 2 | TV/movies only | 2662 | 1347 | Percent of all weighted diary days in the declared population | 47.9409607406 | 1.1696607653 | 45.6484256406 | 50.2334958406 | No editorial low-event flag |
| 2015 | Ages 15–34, including 15–17 | 3 | TV/movies + games/computer leisure | 2662 | 456 | Percent of all weighted diary days in the declared population | 18.7051214983 | 0.9585858046 | 16.8262933213 | 20.5839496753 | No editorial low-event flag |
| 2015 | Ages 15–34, including 15–17 | 4 | Reading only | 2662 | 48 | Percent of all weighted diary days in the declared population | 2.1836772426 | 0.3976056505 | 1.4043701676 | 2.9629843175 | No editorial low-event flag |
| 2015 | Ages 15–34, including 15–17 | 5 | Reading + games/computer leisure | 2662 | 27 | Percent of all weighted diary days in the declared population | 1.1111566873 | 0.2624004258 | 0.5968518526 | 1.6254615219 | Yes — editorial flag, not BLS suppression |
| 2015 | Ages 15–34, including 15–17 | 6 | Reading + TV/movies | 2662 | 153 | Percent of all weighted diary days in the declared population | 5.6446611011 | 0.5608100594 | 4.5454733847 | 6.7438488175 | No editorial low-event flag |
| 2015 | Ages 15–34, including 15–17 | 7 | Reading + TV/movies + games/computer leisure | 2662 | 62 | Percent of all weighted diary days in the declared population | 2.6407472570 | 0.4154693436 | 1.8264273435 | 3.4550671705 | No editorial low-event flag |
| 2015 | Ages 35–54 | 0 | None of these three categories | 3907 | 588 | Percent of all weighted diary days in the declared population | 15.3603341173 | 0.7041374093 | 13.9802247951 | 16.7404434394 | No editorial low-event flag |
| 2015 | Ages 35–54 | 1 | Games/computer leisure only | 3907 | 136 | Percent of all weighted diary days in the declared population | 3.1224121409 | 0.2965176058 | 2.5412376336 | 3.7035866483 | No editorial low-event flag |
| 2015 | Ages 35–54 | 2 | TV/movies only | 3907 | 2053 | Percent of all weighted diary days in the declared population | 53.6458595656 | 0.9530850609 | 51.7778128462 | 55.5139062850 | No editorial low-event flag |
| 2015 | Ages 35–54 | 3 | TV/movies + games/computer leisure | 3907 | 449 | Percent of all weighted diary days in the declared population | 11.3869856751 | 0.6311298555 | 10.1499711584 | 12.6240001918 | No editorial low-event flag |
| 2015 | Ages 35–54 | 4 | Reading only | 3907 | 143 | Percent of all weighted diary days in the declared population | 3.7608864495 | 0.4060990504 | 2.9649323107 | 4.5568405883 | No editorial low-event flag |
| 2015 | Ages 35–54 | 5 | Reading + games/computer leisure | 3907 | 37 | Percent of all weighted diary days in the declared population | 0.7789059850 | 0.1641437976 | 0.4571841418 | 1.1006278283 | No editorial low-event flag |
| 2015 | Ages 35–54 | 6 | Reading + TV/movies | 3907 | 395 | Percent of all weighted diary days in the declared population | 9.7529285076 | 0.5827771464 | 8.6106853006 | 10.8951717145 | No editorial low-event flag |
| 2015 | Ages 35–54 | 7 | Reading + TV/movies + games/computer leisure | 3907 | 106 | Percent of all weighted diary days in the declared population | 2.1916875590 | 0.2549241515 | 1.6920362220 | 2.6913388959 | No editorial low-event flag |
| 2015 | Ages 55 and over | 0 | None of these three categories | 4336 | 307 | Percent of all weighted diary days in the declared population | 6.3664534788 | 0.3949854380 | 5.5922820204 | 7.1406249372 | No editorial low-event flag |
| 2015 | Ages 55 and over | 1 | Games/computer leisure only | 4336 | 63 | Percent of all weighted diary days in the declared population | 1.4127798295 | 0.2298327652 | 0.9623076096 | 1.8632520493 | No editorial low-event flag |
| 2015 | Ages 55 and over | 2 | TV/movies only | 4336 | 2013 | Percent of all weighted diary days in the declared population | 46.3912724498 | 0.8219576158 | 44.7802355228 | 48.0023093767 | No editorial low-event flag |
| 2015 | Ages 55 and over | 3 | TV/movies + games/computer leisure | 4336 | 439 | Percent of all weighted diary days in the declared population | 10.9621020542 | 0.5720352899 | 9.8409128860 | 12.0832912225 | No editorial low-event flag |
| 2015 | Ages 55 and over | 4 | Reading only | 4336 | 162 | Percent of all weighted diary days in the declared population | 3.3701502080 | 0.3308517516 | 2.7216807749 | 4.0186196412 | No editorial low-event flag |
| 2015 | Ages 55 and over | 5 | Reading + games/computer leisure | 4336 | 62 | Percent of all weighted diary days in the declared population | 1.4454445166 | 0.2407551642 | 0.9735643947 | 1.9173246384 | No editorial low-event flag |
| 2015 | Ages 55 and over | 6 | Reading + TV/movies | 4336 | 980 | Percent of all weighted diary days in the declared population | 22.6929480790 | 0.6782087642 | 21.3636589011 | 24.0222372569 | No editorial low-event flag |
| 2015 | Ages 55 and over | 7 | Reading + TV/movies + games/computer leisure | 4336 | 310 | Percent of all weighted diary days in the declared population | 7.3588493842 | 0.5551661450 | 6.2707237401 | 8.4469750283 | No editorial low-event flag |
| 2015 | Monday–Friday diary days, ages 15 and over | 0 | None of these three categories | 5475 | 694 | Percent of all weighted diary days in the declared population | 12.8497158379 | 0.5624638842 | 11.7472866250 | 13.9521450509 | No editorial low-event flag |
| 2015 | Monday–Friday diary days, ages 15 and over | 1 | Games/computer leisure only | 5475 | 169 | Percent of all weighted diary days in the declared population | 3.2059317844 | 0.2715083661 | 2.6737753869 | 3.7380881819 | No editorial low-event flag |
| 2015 | Monday–Friday diary days, ages 15 and over | 2 | TV/movies only | 5475 | 2710 | Percent of all weighted diary days in the declared population | 49.1985383765 | 0.7401419238 | 47.7478602058 | 50.6492165472 | No editorial low-event flag |
| 2015 | Monday–Friday diary days, ages 15 and over | 3 | TV/movies + games/computer leisure | 5475 | 651 | Percent of all weighted diary days in the declared population | 13.4198847501 | 0.5966066876 | 12.2505356424 | 14.5892338578 | No editorial low-event flag |
| 2015 | Monday–Friday diary days, ages 15 and over | 4 | Reading only | 5475 | 198 | Percent of all weighted diary days in the declared population | 3.3436241004 | 0.2574242015 | 2.8390726655 | 3.8481755353 | No editorial low-event flag |
| 2015 | Monday–Friday diary days, ages 15 and over | 5 | Reading + games/computer leisure | 5475 | 62 | Percent of all weighted diary days in the declared population | 1.1417625018 | 0.1644878715 | 0.8193662738 | 1.4641587299 | No editorial low-event flag |
| 2015 | Monday–Friday diary days, ages 15 and over | 6 | Reading + TV/movies | 5475 | 757 | Percent of all weighted diary days in the declared population | 12.6756872449 | 0.4655493820 | 11.7632104562 | 13.5881640335 | No editorial low-event flag |
| 2015 | Monday–Friday diary days, ages 15 and over | 7 | Reading + TV/movies + games/computer leisure | 5475 | 234 | Percent of all weighted diary days in the declared population | 4.1648554040 | 0.3126475405 | 3.5520662245 | 4.7776445834 | No editorial low-event flag |
| 2015 | Saturday–Sunday diary days, ages 15 and over | 0 | None of these three categories | 5430 | 634 | Percent of all weighted diary days in the declared population | 11.9102231191 | 0.5360594847 | 10.8595465290 | 12.9608997091 | No editorial low-event flag |
| 2015 | Saturday–Sunday diary days, ages 15 and over | 1 | Games/computer leisure only | 5430 | 166 | Percent of all weighted diary days in the declared population | 3.7088307628 | 0.3350009878 | 3.0522288267 | 4.3654326988 | No editorial low-event flag |
| 2015 | Saturday–Sunday diary days, ages 15 and over | 2 | TV/movies only | 5430 | 2703 | Percent of all weighted diary days in the declared population | 49.3917630445 | 0.8338506878 | 47.7574156963 | 51.0261103927 | No editorial low-event flag |
| 2015 | Saturday–Sunday diary days, ages 15 and over | 3 | TV/movies + games/computer leisure | 5430 | 693 | Percent of all weighted diary days in the declared population | 14.3947415713 | 0.5950788136 | 13.2283870966 | 15.5610960461 | No editorial low-event flag |
| 2015 | Saturday–Sunday diary days, ages 15 and over | 4 | Reading only | 5430 | 155 | Percent of all weighted diary days in the declared population | 2.4821073994 | 0.2016560406 | 2.0868615598 | 2.8773532390 | No editorial low-event flag |
| 2015 | Saturday–Sunday diary days, ages 15 and over | 5 | Reading + games/computer leisure | 5430 | 64 | Percent of all weighted diary days in the declared population | 1.0585776386 | 0.1761815328 | 0.7132618343 | 1.4038934429 | No editorial low-event flag |
| 2015 | Saturday–Sunday diary days, ages 15 and over | 6 | Reading + TV/movies | 5430 | 771 | Percent of all weighted diary days in the declared population | 13.0910607339 | 0.4617684495 | 12.1859945728 | 13.9961268950 | No editorial low-event flag |
| 2015 | Saturday–Sunday diary days, ages 15 and over | 7 | Reading + TV/movies + games/computer leisure | 5430 | 244 | Percent of all weighted diary days in the declared population | 3.9626957305 | 0.3480776783 | 3.2804634809 | 4.6449279800 | No editorial low-event flag |
| 2025 | All ages 15 and over | 0 | None of these three categories | 6146 | 803 | Percent of all weighted diary days in the declared population | 15.3165722725 | 0.5937928444 | 14.1527382974 | 16.4804062475 | No editorial low-event flag |
| 2025 | All ages 15 and over | 1 | Games/computer leisure only | 6146 | 256 | Percent of all weighted diary days in the declared population | 6.1449618378 | 0.4832641088 | 5.1977641845 | 7.0921594912 | No editorial low-event flag |
| 2025 | All ages 15 and over | 2 | TV/movies only | 6146 | 2953 | Percent of all weighted diary days in the declared population | 45.9745305349 | 0.8357130432 | 44.3365329703 | 47.6125280994 | No editorial low-event flag |
| 2025 | All ages 15 and over | 3 | TV/movies + games/computer leisure | 6146 | 907 | Percent of all weighted diary days in the declared population | 16.4292420542 | 0.6960456634 | 15.0649925538 | 17.7934915545 | No editorial low-event flag |
| 2025 | All ages 15 and over | 4 | Reading only | 6146 | 189 | Percent of all weighted diary days in the declared population | 3.1009107206 | 0.2694750620 | 2.5727395991 | 3.6290818421 | No editorial low-event flag |
| 2025 | All ages 15 and over | 5 | Reading + games/computer leisure | 6146 | 76 | Percent of all weighted diary days in the declared population | 1.1029796099 | 0.1569803849 | 0.7952980555 | 1.4106611644 | No editorial low-event flag |
| 2025 | All ages 15 and over | 6 | Reading + TV/movies | 6146 | 719 | Percent of all weighted diary days in the declared population | 8.8164165338 | 0.4108199560 | 8.0112094202 | 9.6216236475 | No editorial low-event flag |
| 2025 | All ages 15 and over | 7 | Reading + TV/movies + games/computer leisure | 6146 | 243 | Percent of all weighted diary days in the declared population | 3.1143864363 | 0.2572838386 | 2.6101101126 | 3.6186627601 | No editorial low-event flag |
| 2025 | Ages 18 and over — adult sensitivity | 0 | None of these three categories | 6028 | 782 | Percent of all weighted diary days in the declared population | 15.3925974151 | 0.6002362021 | 14.2161344590 | 16.5690603711 | No editorial low-event flag |
| 2025 | Ages 18 and over — adult sensitivity | 1 | Games/computer leisure only | 6028 | 232 | Percent of all weighted diary days in the declared population | 5.2207468752 | 0.4159964708 | 4.4053937924 | 6.0360999580 | No editorial low-event flag |
| 2025 | Ages 18 and over — adult sensitivity | 2 | TV/movies only | 6028 | 2924 | Percent of all weighted diary days in the declared population | 47.1335190967 | 0.8368671284 | 45.4932595250 | 48.7737786684 | No editorial low-event flag |
| 2025 | Ages 18 and over — adult sensitivity | 3 | TV/movies + games/computer leisure | 6028 | 878 | Percent of all weighted diary days in the declared population | 15.8584546125 | 0.6682765259 | 14.5486326218 | 17.1682766033 | No editorial low-event flag |
| 2025 | Ages 18 and over — adult sensitivity | 4 | Reading only | 6028 | 185 | Percent of all weighted diary days in the declared population | 3.0398542834 | 0.2518230260 | 2.5462811523 | 3.5334274144 | No editorial low-event flag |
| 2025 | Ages 18 and over — adult sensitivity | 5 | Reading + games/computer leisure | 6028 | 73 | Percent of all weighted diary days in the declared population | 1.0577085070 | 0.1504903150 | 0.7627474896 | 1.3526695245 | No editorial low-event flag |
| 2025 | Ages 18 and over — adult sensitivity | 6 | Reading + TV/movies | 6028 | 714 | Percent of all weighted diary days in the declared population | 9.1469337544 | 0.4299590358 | 8.3042140442 | 9.9896534646 | No editorial low-event flag |
| 2025 | Ages 18 and over — adult sensitivity | 7 | Reading + TV/movies + games/computer leisure | 6028 | 240 | Percent of all weighted diary days in the declared population | 3.1501854557 | 0.2597184045 | 2.6411373830 | 3.6592335285 | No editorial low-event flag |
| 2025 | Ages 15–34, including 15–17 | 0 | None of these three categories | 1217 | 224 | Percent of all weighted diary days in the declared population | 18.6905839829 | 1.3475007019 | 16.0494826071 | 21.3316853587 | No editorial low-event flag |
| 2025 | Ages 15–34, including 15–17 | 1 | Games/computer leisure only | 1217 | 128 | Percent of all weighted diary days in the declared population | 13.0138061015 | 1.3691798693 | 10.3302135576 | 15.6973986454 | No editorial low-event flag |
| 2025 | Ages 15–34, including 15–17 | 2 | TV/movies only | 1217 | 461 | Percent of all weighted diary days in the declared population | 35.1303469971 | 1.5935153172 | 32.0070569754 | 38.2536370188 | No editorial low-event flag |
| 2025 | Ages 15–34, including 15–17 | 3 | TV/movies + games/computer leisure | 1217 | 240 | Percent of all weighted diary days in the declared population | 21.8289485788 | 1.5756123265 | 18.7407484188 | 24.9171487388 | No editorial low-event flag |
| 2025 | Ages 15–34, including 15–17 | 4 | Reading only | 1217 | 45 | Percent of all weighted diary days in the declared population | 3.3033448168 | 0.5511026295 | 2.2231836629 | 4.3835059706 | No editorial low-event flag |
| 2025 | Ages 15–34, including 15–17 | 5 | Reading + games/computer leisure | 1217 | 18 | Percent of all weighted diary days in the declared population | 1.3711581035 | 0.3497432967 | 0.6856612420 | 2.0566549650 | Yes — editorial flag, not BLS suppression |
| 2025 | Ages 15–34, including 15–17 | 6 | Reading + TV/movies | 1217 | 71 | Percent of all weighted diary days in the declared population | 4.7849983291 | 0.7400350980 | 3.3345295370 | 6.2354671212 | No editorial low-event flag |
| 2025 | Ages 15–34, including 15–17 | 7 | Reading + TV/movies + games/computer leisure | 1217 | 30 | Percent of all weighted diary days in the declared population | 1.8768130904 | 0.3748191188 | 1.1421676176 | 2.6114585632 | No editorial low-event flag |
| 2025 | Ages 35–54 | 0 | None of these three categories | 1820 | 331 | Percent of all weighted diary days in the declared population | 19.7828751856 | 1.1625178784 | 17.5043401439 | 22.0614102274 | No editorial low-event flag |
| 2025 | Ages 35–54 | 1 | Games/computer leisure only | 1820 | 72 | Percent of all weighted diary days in the declared population | 4.3231959210 | 0.6229837963 | 3.1021476804 | 5.5442441617 | No editorial low-event flag |
| 2025 | Ages 35–54 | 2 | TV/movies only | 1820 | 868 | Percent of all weighted diary days in the declared population | 46.6370646528 | 1.4359657282 | 43.8225718254 | 49.4515574801 | No editorial low-event flag |
| 2025 | Ages 35–54 | 3 | TV/movies + games/computer leisure | 1820 | 271 | Percent of all weighted diary days in the declared population | 15.4104419875 | 1.1588306873 | 13.1391338403 | 17.6817501346 | No editorial low-event flag |
| 2025 | Ages 35–54 | 4 | Reading only | 1820 | 61 | Percent of all weighted diary days in the declared population | 3.3560841418 | 0.5154309318 | 2.3458395155 | 4.3663287681 | No editorial low-event flag |
| 2025 | Ages 35–54 | 5 | Reading + games/computer leisure | 1820 | 18 | Percent of all weighted diary days in the declared population | 0.9495146637 | 0.2784130327 | 0.4038251197 | 1.4952042077 | Yes — editorial flag, not BLS suppression |
| 2025 | Ages 35–54 | 6 | Reading + TV/movies | 1820 | 150 | Percent of all weighted diary days in the declared population | 6.7909640534 | 0.6187621988 | 5.5781901437 | 8.0037379632 | No editorial low-event flag |
| 2025 | Ages 35–54 | 7 | Reading + TV/movies + games/computer leisure | 1820 | 49 | Percent of all weighted diary days in the declared population | 2.7498593942 | 0.4613872993 | 1.8455402875 | 3.6541785008 | No editorial low-event flag |
| 2025 | Ages 55 and over | 0 | None of these three categories | 3109 | 248 | Percent of all weighted diary days in the declared population | 8.6611002110 | 0.6476484647 | 7.3917092203 | 9.9304912018 | No editorial low-event flag |
| 2025 | Ages 55 and over | 1 | Games/computer leisure only | 3109 | 56 | Percent of all weighted diary days in the declared population | 1.6945711100 | 0.2918814458 | 1.1224834761 | 2.2666587438 | No editorial low-event flag |
| 2025 | Ages 55 and over | 2 | TV/movies only | 3109 | 1624 | Percent of all weighted diary days in the declared population | 54.8459654016 | 1.0880329063 | 52.7134209052 | 56.9785098980 | No editorial low-event flag |
| 2025 | Ages 55 and over | 3 | TV/movies + games/computer leisure | 3109 | 396 | Percent of all weighted diary days in the declared population | 12.5861502949 | 0.7633788846 | 11.0899276810 | 14.0823729088 | No editorial low-event flag |
| 2025 | Ages 55 and over | 4 | Reading only | 3109 | 83 | Percent of all weighted diary days in the declared population | 2.7122630192 | 0.3768938029 | 1.9735511654 | 3.4509748729 | No editorial low-event flag |
| 2025 | Ages 55 and over | 5 | Reading + games/computer leisure | 3109 | 40 | Percent of all weighted diary days in the declared population | 0.9978666951 | 0.1826016163 | 0.6399675273 | 1.3557658630 | No editorial low-event flag |
| 2025 | Ages 55 and over | 6 | Reading + TV/movies | 3109 | 498 | Percent of all weighted diary days in the declared population | 14.0083324398 | 0.7405261123 | 12.5569012597 | 15.4597636199 | No editorial low-event flag |
| 2025 | Ages 55 and over | 7 | Reading + TV/movies + games/computer leisure | 3109 | 164 | Percent of all weighted diary days in the declared population | 4.4937508283 | 0.4627514441 | 3.5867579978 | 5.4007436589 | No editorial low-event flag |
| 2025 | Monday–Friday diary days, ages 15 and over | 0 | None of these three categories | 3082 | 437 | Percent of all weighted diary days in the declared population | 15.9587335716 | 0.7589830416 | 14.4711268101 | 17.4463403332 | No editorial low-event flag |
| 2025 | Monday–Friday diary days, ages 15 and over | 1 | Games/computer leisure only | 3082 | 134 | Percent of all weighted diary days in the declared population | 6.4920685102 | 0.6055580769 | 5.3051746794 | 7.6789623410 | No editorial low-event flag |
| 2025 | Monday–Friday diary days, ages 15 and over | 2 | TV/movies only | 3082 | 1444 | Percent of all weighted diary days in the declared population | 45.1858310992 | 1.1088938933 | 43.0123990684 | 47.3592631300 | No editorial low-event flag |
| 2025 | Monday–Friday diary days, ages 15 and over | 3 | TV/movies + games/computer leisure | 3082 | 439 | Percent of all weighted diary days in the declared population | 15.9781480179 | 0.9191065681 | 14.1766991444 | 17.7795968914 | No editorial low-event flag |
| 2025 | Monday–Friday diary days, ages 15 and over | 4 | Reading only | 3082 | 109 | Percent of all weighted diary days in the declared population | 3.5403217539 | 0.3726715362 | 2.8098855429 | 4.2707579649 | No editorial low-event flag |
| 2025 | Monday–Friday diary days, ages 15 and over | 5 | Reading + games/computer leisure | 3082 | 42 | Percent of all weighted diary days in the declared population | 1.1307487385 | 0.2039364697 | 0.7310332579 | 1.5304642191 | No editorial low-event flag |
| 2025 | Monday–Friday diary days, ages 15 and over | 6 | Reading + TV/movies | 3082 | 354 | Percent of all weighted diary days in the declared population | 8.5884454501 | 0.5677554207 | 7.4756448256 | 9.7012460746 | No editorial low-event flag |
| 2025 | Monday–Friday diary days, ages 15 and over | 7 | Reading + TV/movies + games/computer leisure | 3082 | 123 | Percent of all weighted diary days in the declared population | 3.1257028585 | 0.3262731215 | 2.4862075403 | 3.7651981768 | No editorial low-event flag |
| 2025 | Saturday–Sunday diary days, ages 15 and over | 0 | None of these three categories | 3064 | 366 | Percent of all weighted diary days in the declared population | 13.7049499279 | 0.8078436027 | 12.1215764667 | 15.2883233892 | No editorial low-event flag |
| 2025 | Saturday–Sunday diary days, ages 15 and over | 1 | Games/computer leisure only | 3064 | 122 | Percent of all weighted diary days in the declared population | 5.2738335563 | 0.5544277807 | 4.1871551062 | 6.3605120064 | No editorial low-event flag |
| 2025 | Saturday–Sunday diary days, ages 15 and over | 2 | TV/movies only | 3064 | 1509 | Percent of all weighted diary days in the declared population | 47.9539173886 | 1.0558023167 | 45.8845448478 | 50.0232899295 | No editorial low-event flag |
| 2025 | Saturday–Sunday diary days, ages 15 and over | 3 | TV/movies + games/computer leisure | 3064 | 468 | Percent of all weighted diary days in the declared population | 17.5613458251 | 0.8211745741 | 15.9518436598 | 19.1708479904 | No editorial low-event flag |
| 2025 | Saturday–Sunday diary days, ages 15 and over | 4 | Reading only | 3064 | 80 | Percent of all weighted diary days in the declared population | 1.9981276026 | 0.2832297675 | 1.4429972583 | 2.5532579469 | No editorial low-event flag |
| 2025 | Saturday–Sunday diary days, ages 15 and over | 5 | Reading + games/computer leisure | 3064 | 34 | Percent of all weighted diary days in the declared population | 1.0332878547 | 0.2082673982 | 0.6250837543 | 1.4414919552 | No editorial low-event flag |
| 2025 | Saturday–Sunday diary days, ages 15 and over | 6 | Reading + TV/movies | 3064 | 365 | Percent of all weighted diary days in the declared population | 9.3885520595 | 0.5130860766 | 8.3829033493 | 10.3942007696 | No editorial low-event flag |
| 2025 | Saturday–Sunday diary days, ages 15 and over | 7 | Reading + TV/movies + games/computer leisure | 3064 | 120 | Percent of all weighted diary days in the declared population | 3.0859857853 | 0.3254709640 | 2.4480626959 | 3.7239088747 | No editorial low-event flag |
112 rows. Eight exclusive combinations sum to 100% within each population/year, apart from rounding. Denominator: all weighted diary days in that population. Only and none refer solely to the three selected categories. Counts are unweighted; fewer than 30 events is an editorial exploratory flag, not a BLS rule. US civilian noninstitutionalized population aged 15 and over unless the age domain states otherwise; one primary-activity diary per respondent. Same day is not simultaneous activity or a causal effect. Games/computer leisure includes board/card games and non-game computer use; TV includes religious TV and excludes cinema attendance; personal-interest reading is not books only. Weights represent the missing 30 September–11 November 2025 diary dates, but BLS cannot quantify resulting bias; 95% sampling intervals do not cover it.
Scroll horizontally to see all columns.
| Survey year | Declared population or diary-day group | Conditional overlap and denominator | Unweighted diary count in denominator | Unweighted diaries in numerator | Unit | Weighted estimate | Replicate-weight standard error | Lower 95% sampling limit | Upper 95% sampling limit |
|---|---|---|---|---|---|---|---|---|---|
| 2015 | All ages 15 and over | TV/movies among reading diary days | 2485 | 2006 | Percent within the stated weighted diary-day denominator | 80.0344943044 | 0.9795138555 | 78.1146471476 | 81.9543414612 |
| 2015 | All ages 15 and over | Games/computer leisure among reading diary days | 2485 | 604 | Percent within the stated weighted diary-day denominator | 24.7439973299 | 1.2841210460 | 22.2271200797 | 27.2608745800 |
| 2015 | All ages 15 and over | TV/movies or games/computer leisure among reading diary days | 2485 | 2132 | Percent within the stated weighted diary-day denominator | 85.3289682212 | 0.8594016925 | 83.6445409039 | 87.0133955385 |
| 2015 | All ages 15 and over | Reading among TV/movie diary days | 8763 | 2006 | Percent within the stated weighted diary-day denominator | 21.1656316071 | 0.5049944231 | 20.1758425379 | 22.1554206764 |
| 2015 | All ages 15 and over | Reading among games/computer-leisure diary days | 2283 | 604 | Percent within the stated weighted diary-day denominator | 23.4611776476 | 1.1885029244 | 21.1317119157 | 25.7906433795 |
| 2015 | Ages 18 and over — adult sensitivity | TV/movies among reading diary days | 2451 | 1980 | Percent within the stated weighted diary-day denominator | 80.1405495480 | 0.9796140176 | 78.2205060735 | 82.0605930226 |
| 2015 | Ages 18 and over — adult sensitivity | Games/computer leisure among reading diary days | 2451 | 588 | Percent within the stated weighted diary-day denominator | 24.3851567796 | 1.3022147308 | 21.8328159073 | 26.9374976519 |
| 2015 | Ages 18 and over — adult sensitivity | TV/movies or games/computer leisure among reading diary days | 2451 | 2101 | Percent within the stated weighted diary-day denominator | 85.2739062905 | 0.8727621330 | 83.5632925099 | 86.9845200710 |
| 2015 | Ages 18 and over — adult sensitivity | Reading among TV/movie diary days | 8506 | 1980 | Percent within the stated weighted diary-day denominator | 21.6957419328 | 0.5036162142 | 20.7086541530 | 22.6828297126 |
| 2015 | Ages 18 and over — adult sensitivity | Reading among games/computer-leisure diary days | 2125 | 588 | Percent within the stated weighted diary-day denominator | 25.2238600234 | 1.2535689199 | 22.7668649405 | 27.6808551063 |
| 2015 | Ages 15–34, including 15–17 | TV/movies among reading diary days | 290 | 215 | Percent within the stated weighted diary-day denominator | 71.5477979830 | 3.7003674714 | 64.2950777391 | 78.8005182270 |
| 2015 | Ages 15–34, including 15–17 | Games/computer leisure among reading diary days | 290 | 89 | Percent within the stated weighted diary-day denominator | 32.3991834624 | 3.2288776182 | 26.0705833308 | 38.7277835941 |
| 2015 | Ages 15–34, including 15–17 | TV/movies or games/computer leisure among reading diary days | 290 | 242 | Percent within the stated weighted diary-day denominator | 81.1430781130 | 3.1867064839 | 74.8971334046 | 87.3890228213 |
| 2015 | Ages 15–34, including 15–17 | Reading among TV/movie diary days | 2018 | 215 | Percent within the stated weighted diary-day denominator | 11.0573115417 | 0.9628827909 | 9.1700612716 | 12.9445618117 |
| 2015 | Ages 15–34, including 15–17 | Reading among games/computer-leisure diary days | 681 | 89 | Percent within the stated weighted diary-day denominator | 13.4018486232 | 1.5774145277 | 10.3101161489 | 16.4935810974 |
| 2015 | Ages 35–54 | TV/movies among reading diary days | 681 | 501 | Percent within the stated weighted diary-day denominator | 72.4600829067 | 2.1835041200 | 68.1804148316 | 76.7397509818 |
| 2015 | Ages 35–54 | Games/computer leisure among reading diary days | 681 | 143 | Percent within the stated weighted diary-day denominator | 18.0206256343 | 1.8680089205 | 14.3593281501 | 21.6819231185 |
| 2015 | Ages 35–54 | TV/movies or games/computer leisure among reading diary days | 681 | 538 | Percent within the stated weighted diary-day denominator | 77.1851901799 | 2.1571387672 | 72.9571981961 | 81.4131821636 |
| 2015 | Ages 35–54 | Reading among TV/movie diary days | 3003 | 501 | Percent within the stated weighted diary-day denominator | 15.5170303927 | 0.7421013271 | 14.0625117915 | 16.9715489938 |
| 2015 | Ages 35–54 | Reading among games/computer-leisure diary days | 728 | 143 | Percent within the stated weighted diary-day denominator | 16.9942506424 | 1.6788567672 | 13.7036913786 | 20.2848099062 |
| 2015 | Ages 55 and over | TV/movies among reading diary days | 1514 | 1290 | Percent within the stated weighted diary-day denominator | 86.1888302439 | 1.0884052965 | 84.0555558627 | 88.3221046250 |
| 2015 | Ages 55 and over | Games/computer leisure among reading diary days | 1514 | 372 | Percent within the stated weighted diary-day denominator | 25.2507955094 | 1.6303308614 | 22.0553470209 | 28.4462439978 |
| 2015 | Ages 55 and over | TV/movies or games/computer leisure among reading diary days | 1514 | 1352 | Percent within the stated weighted diary-day denominator | 90.3343783502 | 0.9020081088 | 88.5664424569 | 92.1023142435 |
| 2015 | Ages 55 and over | Reading among TV/movie diary days | 3742 | 1290 | Percent within the stated weighted diary-day denominator | 34.3821730303 | 0.8008935311 | 32.8124217094 | 35.9519243512 |
| 2015 | Ages 55 and over | Reading among games/computer-leisure diary days | 874 | 372 | Percent within the stated weighted diary-day denominator | 41.5705218673 | 2.3148006628 | 37.0335125682 | 46.1075311664 |
| 2015 | Monday–Friday diary days, ages 15 and over | TV/movies among reading diary days | 1251 | 991 | Percent within the stated weighted diary-day denominator | 78.9674506116 | 1.2178586936 | 76.5804475722 | 81.3544536510 |
| 2015 | Monday–Friday diary days, ages 15 and over | Games/computer leisure among reading diary days | 1251 | 296 | Percent within the stated weighted diary-day denominator | 24.8834076270 | 1.6129814803 | 21.7219639256 | 28.0448513285 |
| 2015 | Monday–Friday diary days, ages 15 and over | TV/movies or games/computer leisure among reading diary days | 1251 | 1053 | Percent within the stated weighted diary-day denominator | 84.3213204871 | 1.0964769377 | 82.1722256892 | 86.4704152851 |
| 2015 | Monday–Friday diary days, ages 15 and over | Reading among TV/movie diary days | 4352 | 991 | Percent within the stated weighted diary-day denominator | 21.1940118834 | 0.6441515452 | 19.9314748548 | 22.4565489119 |
| 2015 | Monday–Friday diary days, ages 15 and over | Reading among games/computer-leisure diary days | 1116 | 296 | Percent within the stated weighted diary-day denominator | 24.1952981565 | 1.4951655013 | 21.2647737741 | 27.1258225390 |
| 2015 | Saturday–Sunday diary days, ages 15 and over | TV/movies among reading diary days | 1234 | 1015 | Percent within the stated weighted diary-day denominator | 82.8075695201 | 1.2917471024 | 80.2757451994 | 85.3393938408 |
| 2015 | Saturday–Sunday diary days, ages 15 and over | Games/computer leisure among reading diary days | 1234 | 308 | Percent within the stated weighted diary-day denominator | 24.3816923535 | 1.5577403927 | 21.3285211839 | 27.4348635231 |
| 2015 | Saturday–Sunday diary days, ages 15 and over | TV/movies or games/computer leisure among reading diary days | 1234 | 1079 | Percent within the stated weighted diary-day denominator | 87.9476828777 | 0.9761642279 | 86.0344009910 | 89.8609647644 |
| 2015 | Saturday–Sunday diary days, ages 15 and over | Reading among TV/movie diary days | 4411 | 1015 | Percent within the stated weighted diary-day denominator | 21.0956226965 | 0.6947612284 | 19.7338906888 | 22.4573547042 |
| 2015 | Saturday–Sunday diary days, ages 15 and over | Reading among games/computer-leisure diary days | 1167 | 308 | Percent within the stated weighted diary-day denominator | 21.7137594494 | 1.5278846700 | 18.7191054962 | 24.7084134026 |
| 2025 | All ages 15 and over | TV/movies among reading diary days | 1227 | 962 | Percent within the stated weighted diary-day denominator | 73.9450248469 | 1.5279914928 | 70.9501615210 | 76.9398881728 |
| 2025 | All ages 15 and over | Games/computer leisure among reading diary days | 1227 | 319 | Percent within the stated weighted diary-day denominator | 26.1384952763 | 1.7339314727 | 22.7399895899 | 29.5370009628 |
| 2025 | All ages 15 and over | TV/movies or games/computer leisure among reading diary days | 1227 | 1038 | Percent within the stated weighted diary-day denominator | 80.7810990715 | 1.5562937494 | 77.7307633227 | 83.8314348203 |
| 2025 | All ages 15 and over | Reading among TV/movie diary days | 4822 | 962 | Percent within the stated weighted diary-day denominator | 16.0501393603 | 0.6187767760 | 14.8373368794 | 17.2629418413 |
| 2025 | All ages 15 and over | Reading among games/computer-leisure diary days | 1482 | 319 | Percent within the stated weighted diary-day denominator | 15.7413919974 | 1.1312619344 | 13.5241186059 | 17.9586653889 |
| 2025 | Ages 18 and over — adult sensitivity | TV/movies among reading diary days | 1212 | 954 | Percent within the stated weighted diary-day denominator | 75.0067565187 | 1.4863093837 | 72.0935901266 | 77.9199229108 |
| 2025 | Ages 18 and over — adult sensitivity | Games/computer leisure among reading diary days | 1212 | 313 | Percent within the stated weighted diary-day denominator | 25.6662127551 | 1.6686480463 | 22.3956625843 | 28.9367629258 |
| 2025 | Ages 18 and over — adult sensitivity | TV/movies or games/computer leisure among reading diary days | 1212 | 1027 | Percent within the stated weighted diary-day denominator | 81.4582906624 | 1.4662764931 | 78.5843887360 | 84.3321925889 |
| 2025 | Ages 18 and over — adult sensitivity | Reading among TV/movie diary days | 4756 | 954 | Percent within the stated weighted diary-day denominator | 16.3332014417 | 0.6354879799 | 15.0876450010 | 17.5787578824 |
| 2025 | Ages 18 and over — adult sensitivity | Reading among games/computer-leisure diary days | 1423 | 313 | Percent within the stated weighted diary-day denominator | 16.6404796115 | 1.1807328535 | 14.3262432186 | 18.9547160043 |
| 2025 | Ages 15–34, including 15–17 | TV/movies among reading diary days | 164 | 101 | Percent within the stated weighted diary-day denominator | 58.7652319779 | 4.4938378900 | 49.9573097134 | 67.5731542424 |
| 2025 | Ages 15–34, including 15–17 | Games/computer leisure among reading diary days | 164 | 48 | Percent within the stated weighted diary-day denominator | 28.6510332773 | 4.1595976886 | 20.4982218077 | 36.8038447470 |
| 2025 | Ages 15–34, including 15–17 | TV/movies or games/computer leisure among reading diary days | 164 | 119 | Percent within the stated weighted diary-day denominator | 70.8605044130 | 4.4167983852 | 62.2035795781 | 79.5174292480 |
| 2025 | Ages 15–34, including 15–17 | Reading among TV/movie diary days | 802 | 101 | Percent within the stated weighted diary-day denominator | 10.4710712122 | 1.2920732708 | 7.9386076014 | 13.0035348230 |
| 2025 | Ages 15–34, including 15–17 | Reading among games/computer-leisure diary days | 416 | 48 | Percent within the stated weighted diary-day denominator | 8.5269343636 | 1.3527381260 | 5.8755676365 | 11.1783010906 |
| 2025 | Ages 35–54 | TV/movies among reading diary days | 278 | 199 | Percent within the stated weighted diary-day denominator | 68.9046114096 | 3.4278144899 | 62.1860950093 | 75.6231278099 |
| 2025 | Ages 35–54 | Games/computer leisure among reading diary days | 278 | 67 | Percent within the stated weighted diary-day denominator | 26.7171836177 | 3.4581343095 | 19.9392403710 | 33.4951268644 |
| 2025 | Ages 35–54 | TV/movies or games/computer leisure among reading diary days | 278 | 217 | Percent within the stated weighted diary-day denominator | 75.7620843822 | 3.2537740707 | 69.3846872036 | 82.1394815607 |
| 2025 | Ages 35–54 | Reading among TV/movie diary days | 1338 | 199 | Percent within the stated weighted diary-day denominator | 13.3273446048 | 1.0355752946 | 11.2976170275 | 15.3570721821 |
| 2025 | Ages 35–54 | Reading among games/computer-leisure diary days | 410 | 67 | Percent within the stated weighted diary-day denominator | 15.7870190275 | 2.3111787528 | 11.2571086720 | 20.3169293829 |
| 2025 | Ages 55 and over | TV/movies among reading diary days | 785 | 662 | Percent within the stated weighted diary-day denominator | 83.2968929424 | 1.7425638231 | 79.8814678490 | 86.7123180357 |
| 2025 | Ages 55 and over | Games/computer leisure among reading diary days | 785 | 204 | Percent within the stated weighted diary-day denominator | 24.7234146720 | 2.0051511200 | 20.7933184767 | 28.6535108672 |
| 2025 | Ages 55 and over | TV/movies or games/computer leisure among reading diary days | 785 | 702 | Percent within the stated weighted diary-day denominator | 87.7893165291 | 1.6294108424 | 84.5956712779 | 90.9829617802 |
| 2025 | Ages 55 and over | Reading among TV/movie diary days | 2682 | 662 | Percent within the stated weighted diary-day denominator | 21.5305239254 | 0.9504582347 | 19.6676257853 | 23.3934220654 |
| 2025 | Ages 55 and over | Reading among games/computer-leisure diary days | 656 | 204 | Percent within the stated weighted diary-day denominator | 27.7742433172 | 2.1931392279 | 23.4756904305 | 32.0727962040 |
| 2025 | Monday–Friday diary days, ages 15 and over | TV/movies among reading diary days | 628 | 477 | Percent within the stated weighted diary-day denominator | 71.4921689536 | 2.1275621763 | 67.3221470880 | 75.6621908191 |
| 2025 | Monday–Friday diary days, ages 15 and over | Games/computer leisure among reading diary days | 628 | 165 | Percent within the stated weighted diary-day denominator | 25.9773863793 | 2.1443218239 | 21.7745156045 | 30.1802571541 |
| 2025 | Monday–Friday diary days, ages 15 and over | TV/movies or games/computer leisure among reading diary days | 628 | 519 | Percent within the stated weighted diary-day denominator | 78.3931981814 | 2.1075529399 | 74.2623944192 | 82.5240019435 |
| 2025 | Monday–Friday diary days, ages 15 and over | Reading among TV/movie diary days | 2360 | 477 | Percent within the stated weighted diary-day denominator | 16.0736131984 | 0.8662122812 | 14.3758371273 | 17.7713892695 |
| 2025 | Monday–Friday diary days, ages 15 and over | Reading among games/computer-leisure diary days | 738 | 165 | Percent within the stated weighted diary-day denominator | 15.9258594342 | 1.4445870297 | 13.0944688559 | 18.7572500124 |
| 2025 | Saturday–Sunday diary days, ages 15 and over | TV/movies among reading diary days | 599 | 485 | Percent within the stated weighted diary-day denominator | 80.4499897668 | 1.9505000272 | 76.6270097135 | 84.2729698200 |
| 2025 | Saturday–Sunday diary days, ages 15 and over | Games/computer leisure among reading diary days | 599 | 154 | Percent within the stated weighted diary-day denominator | 26.5657554861 | 2.1555097006 | 22.3409564730 | 30.7905544993 |
| 2025 | Saturday–Sunday diary days, ages 15 and over | TV/movies or games/computer leisure among reading diary days | 599 | 519 | Percent within the stated weighted diary-day denominator | 87.1138035588 | 1.6945655514 | 83.7924550780 | 90.4351520396 |
| 2025 | Saturday–Sunday diary days, ages 15 and over | Reading among TV/movie diary days | 2462 | 485 | Percent within the stated weighted diary-day denominator | 15.9950886852 | 0.7513918884 | 14.5223605839 | 17.4678167865 |
| 2025 | Saturday–Sunday diary days, ages 15 and over | Reading among games/computer-leisure diary days | 744 | 154 | Percent within the stated weighted diary-day denominator | 15.2823492161 | 1.4116997695 | 12.5154176679 | 18.0492807643 |
70 rows. Each conditional measure specifies its own weighted diary-day denominator. Raw denominator and event counts are unweighted and do not reproduce the weighted percentage. TV and games/computer overlap; their percentages must not be added to obtain either. Reverse conditional measures use different denominators. US civilian noninstitutionalized population aged 15 and over unless the age domain states otherwise; one primary-activity diary per respondent. Same day is not simultaneous activity or a causal effect. Games/computer leisure includes board/card games and non-game computer use; TV includes religious TV and excludes cinema attendance; personal-interest reading is not books only. Weights represent the missing 30 September–11 November 2025 diary dates, but BLS cannot quantify resulting bias; 95% sampling intervals do not cover it.
Scroll horizontally to see all columns.
| Survey year | Declared population or diary-day group | Primary-activity category | Diary-day denominator | Unweighted diary count in denominator | Unit | Weighted estimate | Replicate-weight standard error | Lower 95% sampling limit | Upper 95% sampling limit |
|---|---|---|---|---|---|---|---|---|---|
| 2015 | All ages 15 and over | Personal-interest reading | All diary days in the declared population | 10905 | Minutes per stated diary day | 19.4496435619 | 0.6218685672 | 18.2307811702 | 20.6685059537 |
| 2015 | All ages 15 and over | Personal-interest reading | Only diary days containing the stated category | 2485 | Minutes per stated diary day | 92.1019728152 | 2.3337974574 | 87.5277297988 | 96.6762158317 |
| 2015 | All ages 15 and over | TV/movies, including religious TV | All diary days in the declared population | 10905 | Minutes per stated diary day | 166.7656593233 | 2.0243673639 | 162.7978992901 | 170.7334193565 |
| 2015 | All ages 15 and over | TV/movies, including religious TV | Only diary days containing the stated category | 8763 | Minutes per stated diary day | 208.8420456452 | 2.1761684819 | 204.5767554207 | 213.1073358697 |
| 2015 | All ages 15 and over | Games and computer leisure | All diary days in the declared population | 10905 | Minutes per stated diary day | 25.2135076747 | 0.9553212989 | 23.3410779289 | 27.0859374204 |
| 2015 | All ages 15 and over | Games and computer leisure | Only diary days containing the stated category | 2283 | Minutes per stated diary day | 113.2062755221 | 3.5864516366 | 106.1768303144 | 120.2357207298 |
| 2015 | Ages 18 and over — adult sensitivity | Personal-interest reading | All diary days in the declared population | 10549 | Minutes per stated diary day | 19.9217018060 | 0.6136021318 | 18.7190416276 | 21.1243619844 |
| 2015 | Ages 18 and over — adult sensitivity | Personal-interest reading | Only diary days containing the stated category | 2451 | Minutes per stated diary day | 91.5524663026 | 2.2986734166 | 87.0470664060 | 96.0578661992 |
| 2015 | Ages 18 and over — adult sensitivity | TV/movies, including religious TV | All diary days in the declared population | 10549 | Minutes per stated diary day | 168.9922738255 | 2.1384586096 | 164.8008949507 | 173.1836527003 |
| 2015 | Ages 18 and over — adult sensitivity | TV/movies, including religious TV | Only diary days containing the stated category | 8506 | Minutes per stated diary day | 210.2483773192 | 2.2704548242 | 205.7982858638 | 214.6984687746 |
| 2015 | Ages 18 and over — adult sensitivity | Games and computer leisure | All diary days in the declared population | 10549 | Minutes per stated diary day | 22.5306627419 | 0.9215636898 | 20.7243979099 | 24.3369275740 |
| 2015 | Ages 18 and over — adult sensitivity | Games and computer leisure | Only diary days containing the stated category | 2125 | Minutes per stated diary day | 107.1034782961 | 3.6293475811 | 99.9899570372 | 114.2169995551 |
| 2015 | Ages 15–34, including 15–17 | Personal-interest reading | All diary days in the declared population | 2662 | Minutes per stated diary day | 9.6017287843 | 0.8992953852 | 7.8391098293 | 11.3643477394 |
| 2015 | Ages 15–34, including 15–17 | Personal-interest reading | Only diary days containing the stated category | 290 | Minutes per stated diary day | 82.9147486348 | 4.9041055527 | 73.3027017515 | 92.5267955181 |
| 2015 | Ages 15–34, including 15–17 | TV/movies, including religious TV | All diary days in the declared population | 2662 | Minutes per stated diary day | 132.3241751401 | 3.3429667841 | 125.7719602431 | 138.8763900370 |
| 2015 | Ages 15–34, including 15–17 | TV/movies, including religious TV | Only diary days containing the stated category | 2018 | Minutes per stated diary day | 176.5935444308 | 3.6406391545 | 169.4578916879 | 183.7291971737 |
| 2015 | Ages 15–34, including 15–17 | Games and computer leisure | All diary days in the declared population | 2662 | Minutes per stated diary day | 37.4202029546 | 2.4406878414 | 32.6364547855 | 42.2039511237 |
| 2015 | Ages 15–34, including 15–17 | Games and computer leisure | Only diary days containing the stated category | 681 | Minutes per stated diary day | 133.6654410390 | 6.9801596314 | 119.9843281615 | 147.3465539166 |
| 2015 | Ages 35–54 | Personal-interest reading | All diary days in the declared population | 3907 | Minutes per stated diary day | 11.7201126799 | 0.7948016802 | 10.1623013866 | 13.2779239731 |
| 2015 | Ages 35–54 | Personal-interest reading | Only diary days containing the stated category | 681 | Minutes per stated diary day | 71.0981693951 | 3.7349431239 | 63.7776808723 | 78.4186579180 |
| 2015 | Ages 35–54 | TV/movies, including religious TV | All diary days in the declared population | 3907 | Minutes per stated diary day | 140.5498984553 | 2.8882813774 | 134.8888669556 | 146.2109299551 |
| 2015 | Ages 35–54 | TV/movies, including religious TV | Only diary days containing the stated category | 3003 | Minutes per stated diary day | 182.5857803940 | 3.2997168651 | 176.1183353384 | 189.0532254495 |
| 2015 | Ages 35–54 | Games and computer leisure | All diary days in the declared population | 3907 | Minutes per stated diary day | 14.8569874587 | 0.8483891301 | 13.1941447637 | 16.5198301538 |
| 2015 | Ages 35–54 | Games and computer leisure | Only diary days containing the stated category | 728 | Minutes per stated diary day | 84.9942494403 | 3.1782492121 | 78.7648809846 | 91.2236178961 |
| 2015 | Ages 55 and over | Personal-interest reading | All diary days in the declared population | 4336 | Minutes per stated diary day | 36.4317563599 | 1.2614096220 | 33.9593935007 | 38.9041192191 |
| 2015 | Ages 55 and over | Personal-interest reading | Only diary days containing the stated category | 1514 | Minutes per stated diary day | 104.4866107672 | 3.0475644178 | 98.5133845084 | 110.4598370260 |
| 2015 | Ages 55 and over | TV/movies, including religious TV | All diary days in the declared population | 4336 | Minutes per stated diary day | 225.3855232833 | 3.6207335858 | 218.2888854551 | 232.4821611114 |
| 2015 | Ages 55 and over | TV/movies, including religious TV | Only diary days containing the stated category | 3742 | Minutes per stated diary day | 257.8629138421 | 3.7812369735 | 250.4516893740 | 265.2741383102 |
| 2015 | Ages 55 and over | Games and computer leisure | All diary days in the declared population | 4336 | Minutes per stated diary day | 23.0104860515 | 1.0760885699 | 20.9013524544 | 25.1196196485 |
| 2015 | Ages 55 and over | Games and computer leisure | Only diary days containing the stated category | 874 | Minutes per stated diary day | 108.6467494563 | 4.0626462238 | 100.6839628577 | 116.6095360549 |
| 2015 | Monday–Friday diary days, ages 15 and over | Personal-interest reading | All diary days in the declared population | 5475 | Minutes per stated diary day | 18.8595710559 | 0.8015609029 | 17.2885116863 | 20.4306304255 |
| 2015 | Monday–Friday diary days, ages 15 and over | Personal-interest reading | Only diary days containing the stated category | 1251 | Minutes per stated diary day | 88.4349321141 | 2.9543073076 | 82.6444897913 | 94.2253744369 |
| 2015 | Monday–Friday diary days, ages 15 and over | TV/movies, including religious TV | All diary days in the declared population | 5475 | Minutes per stated diary day | 155.0621709349 | 2.5036781259 | 150.1549618081 | 159.9693800616 |
| 2015 | Monday–Friday diary days, ages 15 and over | TV/movies, including religious TV | Only diary days containing the stated category | 4352 | Minutes per stated diary day | 195.1474820011 | 2.7905605624 | 189.6779832989 | 200.6169807034 |
| 2015 | Monday–Friday diary days, ages 15 and over | Games and computer leisure | All diary days in the declared population | 5475 | Minutes per stated diary day | 23.6929631354 | 1.1889528866 | 21.3626154777 | 26.0233107931 |
| 2015 | Monday–Friday diary days, ages 15 and over | Games and computer leisure | Only diary days containing the stated category | 1116 | Minutes per stated diary day | 108.0270555460 | 4.5635297476 | 99.0825372406 | 116.9715738514 |
| 2015 | Saturday–Sunday diary days, ages 15 and over | Personal-interest reading | All diary days in the declared population | 5430 | Minutes per stated diary day | 20.9305474745 | 0.8719304300 | 19.2215638318 | 22.6395311173 |
| 2015 | Saturday–Sunday diary days, ages 15 and over | Personal-interest reading | Only diary days containing the stated category | 1234 | Minutes per stated diary day | 101.6320227578 | 3.2554453160 | 95.2513499384 | 108.0126955773 |
| 2015 | Saturday–Sunday diary days, ages 15 and over | TV/movies, including religious TV | All diary days in the declared population | 5430 | Minutes per stated diary day | 196.1378831924 | 3.0406395491 | 190.1782296761 | 202.0975367087 |
| 2015 | Saturday–Sunday diary days, ages 15 and over | TV/movies, including religious TV | Only diary days containing the stated category | 4411 | Minutes per stated diary day | 242.6240100807 | 3.4146313422 | 235.9313326501 | 249.3166875113 |
| 2015 | Saturday–Sunday diary days, ages 15 and over | Games and computer leisure | All diary days in the declared population | 5430 | Minutes per stated diary day | 29.0296155844 | 1.4509142872 | 26.1858235814 | 31.8734075874 |
| 2015 | Saturday–Sunday diary days, ages 15 and over | Games and computer leisure | Only diary days containing the stated category | 1167 | Minutes per stated diary day | 125.5343103995 | 4.4785006329 | 116.7564491591 | 134.3121716400 |
| 2025 | All ages 15 and over | Personal-interest reading | All diary days in the declared population | 6146 | Minutes per stated diary day | 16.1337171852 | 0.8032728798 | 14.5593023408 | 17.7081320297 |
| 2025 | All ages 15 and over | Personal-interest reading | Only diary days containing the stated category | 1227 | Minutes per stated diary day | 99.9939502079 | 3.9131325496 | 92.3242104106 | 107.6636900051 |
| 2025 | All ages 15 and over | TV/movies, including religious TV | All diary days in the declared population | 6146 | Minutes per stated diary day | 156.6323339290 | 2.6444137922 | 151.4492828964 | 161.8153849616 |
| 2025 | All ages 15 and over | TV/movies, including religious TV | Only diary days containing the stated category | 4822 | Minutes per stated diary day | 210.7126229628 | 3.0653801321 | 204.7044779039 | 216.7207680218 |
| 2025 | All ages 15 and over | Games and computer leisure | All diary days in the declared population | 6146 | Minutes per stated diary day | 37.3278343273 | 1.8940728416 | 33.6154515577 | 41.0402170969 |
| 2025 | All ages 15 and over | Games and computer leisure | Only diary days containing the stated category | 1482 | Minutes per stated diary day | 139.3267897824 | 5.2934458890 | 128.9516358400 | 149.7019437248 |
| 2025 | Ages 18 and over — adult sensitivity | Personal-interest reading | All diary days in the declared population | 6028 | Minutes per stated diary day | 16.5727757198 | 0.8175783580 | 14.9703221382 | 18.1752293015 |
| 2025 | Ages 18 and over — adult sensitivity | Personal-interest reading | Only diary days containing the stated category | 1212 | Minutes per stated diary day | 101.0862895621 | 4.0490826538 | 93.1500875606 | 109.0224915636 |
| 2025 | Ages 18 and over — adult sensitivity | TV/movies, including religious TV | All diary days in the declared population | 6028 | Minutes per stated diary day | 160.5083557700 | 2.6851901896 | 155.2453829984 | 165.7713285416 |
| 2025 | Ages 18 and over — adult sensitivity | TV/movies, including religious TV | Only diary days containing the stated category | 4756 | Minutes per stated diary day | 213.1893871294 | 3.0762095029 | 207.1600165037 | 219.2187577551 |
| 2025 | Ages 18 and over — adult sensitivity | Games and computer leisure | All diary days in the declared population | 6028 | Minutes per stated diary day | 34.3115257409 | 1.8152789809 | 30.7535789384 | 37.8694725435 |
| 2025 | Ages 18 and over — adult sensitivity | Games and computer leisure | Only diary days containing the stated category | 1423 | Minutes per stated diary day | 135.6878879510 | 5.4319285898 | 125.0413079149 | 146.3344679870 |
| 2025 | Ages 15–34, including 15–17 | Personal-interest reading | All diary days in the declared population | 1217 | Minutes per stated diary day | 9.8436226170 | 1.5097618553 | 6.8844893806 | 12.8027558535 |
| 2025 | Ages 15–34, including 15–17 | Personal-interest reading | Only diary days containing the stated category | 164 | Minutes per stated diary day | 86.8326540888 | 10.1813188408 | 66.8772691608 | 106.7880390169 |
| 2025 | Ages 15–34, including 15–17 | TV/movies, including religious TV | All diary days in the declared population | 1217 | Minutes per stated diary day | 109.7483972619 | 4.2993121340 | 101.3217454794 | 118.1750490445 |
| 2025 | Ages 15–34, including 15–17 | TV/movies, including religious TV | Only diary days containing the stated category | 802 | Minutes per stated diary day | 172.5031242696 | 5.5563872466 | 161.6126052663 | 183.3936432728 |
| 2025 | Ages 15–34, including 15–17 | Games and computer leisure | All diary days in the declared population | 1217 | Minutes per stated diary day | 66.2202489730 | 4.8423854644 | 56.7291734627 | 75.7113244832 |
| 2025 | Ages 15–34, including 15–17 | Games and computer leisure | Only diary days containing the stated category | 416 | Minutes per stated diary day | 173.8487452082 | 9.3932608975 | 155.4379538491 | 192.2595365674 |
| 2025 | Ages 35–54 | Personal-interest reading | All diary days in the declared population | 1820 | Minutes per stated diary day | 13.1193346471 | 1.6165300507 | 9.9509357477 | 16.2877335464 |
| 2025 | Ages 35–54 | Personal-interest reading | Only diary days containing the stated category | 278 | Minutes per stated diary day | 94.7489135263 | 9.6068042949 | 75.9195771082 | 113.5782499443 |
| 2025 | Ages 35–54 | TV/movies, including religious TV | All diary days in the declared population | 1820 | Minutes per stated diary day | 119.6488231113 | 3.5631293975 | 112.6650894923 | 126.6325567303 |
| 2025 | Ages 35–54 | TV/movies, including religious TV | Only diary days containing the stated category | 1338 | Minutes per stated diary day | 167.1345357050 | 4.5003901136 | 158.3137710822 | 175.9553003277 |
| 2025 | Ages 35–54 | Games and computer leisure | All diary days in the declared population | 1820 | Minutes per stated diary day | 24.9680259098 | 2.1383206548 | 20.7769174265 | 29.1591343931 |
| 2025 | Ages 35–54 | Games and computer leisure | Only diary days containing the stated category | 410 | Minutes per stated diary day | 106.5506472051 | 6.9797256499 | 92.8703849312 | 120.2309094790 |
| 2025 | Ages 55 and over | Personal-interest reading | All diary days in the declared population | 3109 | Minutes per stated diary day | 24.1128953738 | 1.2565085124 | 21.6501386896 | 26.5756520581 |
| 2025 | Ages 55 and over | Personal-interest reading | Only diary days containing the stated category | 785 | Minutes per stated diary day | 108.5569249353 | 3.8285602098 | 101.0529469240 | 116.0609029465 |
| 2025 | Ages 55 and over | TV/movies, including religious TV | All diary days in the declared population | 3109 | Minutes per stated diary day | 228.2070918369 | 4.9378946835 | 218.5288182572 | 237.8853654166 |
| 2025 | Ages 55 and over | TV/movies, including religious TV | Only diary days containing the stated category | 2682 | Minutes per stated diary day | 265.5602712149 | 5.3678234536 | 255.0393372458 | 276.0812051841 |
| 2025 | Ages 55 and over | Games and computer leisure | All diary days in the declared population | 3109 | Minutes per stated diary day | 22.5238156277 | 1.4492101326 | 19.6833637678 | 25.3642674875 |
| 2025 | Ages 55 and over | Games and computer leisure | Only diary days containing the stated category | 656 | Minutes per stated diary day | 113.9157876530 | 5.8623459467 | 102.4255895976 | 125.4059857085 |
| 2025 | Monday–Friday diary days, ages 15 and over | Personal-interest reading | All diary days in the declared population | 3082 | Minutes per stated diary day | 15.8385557032 | 1.0931737032 | 13.6959352450 | 17.9811761614 |
| 2025 | Monday–Friday diary days, ages 15 and over | Personal-interest reading | Only diary days containing the stated category | 628 | Minutes per stated diary day | 96.6636814282 | 5.2139492849 | 86.4443408299 | 106.8830220265 |
| 2025 | Monday–Friday diary days, ages 15 and over | TV/movies, including religious TV | All diary days in the declared population | 3082 | Minutes per stated diary day | 139.7782783927 | 3.4653032600 | 132.9862840032 | 146.5702727822 |
| 2025 | Monday–Friday diary days, ages 15 and over | TV/movies, including religious TV | Only diary days containing the stated category | 2360 | Minutes per stated diary day | 191.7972968434 | 4.0785116426 | 183.8034140240 | 199.7911796628 |
| 2025 | Monday–Friday diary days, ages 15 and over | Games and computer leisure | All diary days in the declared population | 3082 | Minutes per stated diary day | 35.1850621760 | 2.2977095800 | 30.6815513992 | 39.6885729528 |
| 2025 | Monday–Friday diary days, ages 15 and over | Games and computer leisure | Only diary days containing the stated category | 738 | Minutes per stated diary day | 131.6477684809 | 6.9688896895 | 117.9887446893 | 145.3067922724 |
| 2025 | Saturday–Sunday diary days, ages 15 and over | Personal-interest reading | All diary days in the declared population | 3064 | Minutes per stated diary day | 16.8744794211 | 0.9180265862 | 15.0751473121 | 18.6738115301 |
| 2025 | Saturday–Sunday diary days, ages 15 and over | Personal-interest reading | Only diary days containing the stated category | 599 | Minutes per stated diary day | 108.8258109153 | 4.2786749292 | 100.4396080540 | 117.2120137765 |
| 2025 | Saturday–Sunday diary days, ages 15 and over | TV/movies, including religious TV | All diary days in the declared population | 3064 | Minutes per stated diary day | 198.9306981150 | 3.9950863908 | 191.1003287890 | 206.7610674410 |
| 2025 | Saturday–Sunday diary days, ages 15 and over | TV/movies, including religious TV | Only diary days containing the stated category | 2462 | Minutes per stated diary day | 255.0727087582 | 4.3326892459 | 246.5806378363 | 263.5647796802 |
| 2025 | Saturday–Sunday diary days, ages 15 and over | Games and computer leisure | All diary days in the declared population | 3064 | Minutes per stated diary day | 42.7055166678 | 2.9331199113 | 36.9566016415 | 48.4544316940 |
| 2025 | Saturday–Sunday diary days, ages 15 and over | Games and computer leisure | Only diary days containing the stated category | 744 | Minutes per stated diary day | 158.4358496680 | 8.0715864612 | 142.6155402041 | 174.2561591319 |
84 rows. Mean minutes across all diary days and mean minutes among category-participation days have separate denominators. Positive primary minutes define participation. Minutes do not measure attention, simultaneous use or an annual habit. US civilian noninstitutionalized population aged 15 and over unless the age domain states otherwise; one primary-activity diary per respondent. Same day is not simultaneous activity or a causal effect. Games/computer leisure includes board/card games and non-game computer use; TV includes religious TV and excludes cinema attendance; personal-interest reading is not books only. Weights represent the missing 30 September–11 November 2025 diary dates, but BLS cannot quantify resulting bias; 95% sampling intervals do not cover it.
Scroll horizontally to see all columns.
| Declared population or diary-day group | Combination code | 2025 minus 2015 | Replicate-weight standard error | Lower 95% sampling limit | Upper 95% sampling limit | Unit |
|---|---|---|---|---|---|---|
| Ages 18 and over — adult sensitivity | 0 | 2.9072599347 | 0.7396278943 | 1.4575892618 | 4.3569306075 | Percentage points |
| Ages 18 and over — adult sensitivity | 1 | 2.4049208500 | 0.4603462659 | 1.5026421687 | 3.3071995312 | Percentage points |
| Ages 18 and over — adult sensitivity | 2 | −2.8910982312 | 1.0381319874 | −4.9258369264 | −0.8563595360 | Percentage points |
| Ages 18 and over — adult sensitivity | 3 | 2.9441099864 | 0.7973643523 | 1.3812758558 | 4.5069441170 | Percentage points |
| Ages 18 and over — adult sensitivity | 4 | −0.1645252325 | 0.3219998349 | −0.7956449089 | 0.4665944438 | Percentage points |
| Ages 18 and over — adult sensitivity | 5 | −0.0593034798 | 0.1985800532 | −0.4485203841 | 0.3299134244 | Percentage points |
| Ages 18 and over — adult sensitivity | 6 | −4.1023817483 | 0.5758298788 | −5.2310083107 | −2.9737551859 | Percentage points |
| Ages 18 and over — adult sensitivity | 7 | −1.0389820791 | 0.3663425380 | −1.7570134536 | −0.3209507046 | Percentage points |
| Ages 15–34, including 15–17 | 0 | 2.4553040702 | 1.6540691394 | −0.7866714429 | 5.6972795834 | Percentage points |
| Ages 15–34, including 15–17 | 1 | 7.4754105409 | 1.4633184081 | 4.6073064610 | 10.3435146209 | Percentage points |
| Ages 15–34, including 15–17 | 2 | −12.8106137435 | 1.9767137810 | −16.6849727542 | −8.9362547327 | Percentage points |
| Ages 15–34, including 15–17 | 3 | 3.1238270805 | 1.8442995820 | −0.4910001003 | 6.7386542613 | Percentage points |
| Ages 15–34, including 15–17 | 4 | 1.1196675742 | 0.6795618894 | −0.2122737291 | 2.4516088775 | Percentage points |
| Ages 15–34, including 15–17 | 5 | 0.2600014162 | 0.4372348992 | −0.5969789861 | 1.1169818186 | Percentage points |
| Ages 15–34, including 15–17 | 6 | −0.8596627720 | 0.9285256426 | −2.6795730316 | 0.9602474875 | Percentage points |
| Ages 15–34, including 15–17 | 7 | −0.7639341666 | 0.5595570992 | −1.8606660811 | 0.3327977479 | Percentage points |
| Ages 35–54 | 0 | 4.4225410684 | 1.3591384436 | 1.7586297189 | 7.0864524178 | Percentage points |
| Ages 35–54 | 1 | 1.2007837801 | 0.6899503612 | −0.1515189279 | 2.5530864881 | Percentage points |
| Ages 35–54 | 2 | −7.0087949128 | 1.7234757631 | −10.3868074085 | −3.6307824172 | Percentage points |
| Ages 35–54 | 3 | 4.0234563123 | 1.3195504751 | 1.4371373812 | 6.6097752435 | Percentage points |
| Ages 35–54 | 4 | −0.4048023077 | 0.6561901281 | −1.6909349587 | 0.8813303433 | Percentage points |
| Ages 35–54 | 5 | 0.1706086786 | 0.3231980864 | −0.4628595706 | 0.8040769279 | Percentage points |
| Ages 35–54 | 6 | −2.9619644541 | 0.8499975653 | −4.6279596822 | −1.2959692261 | Percentage points |
| Ages 35–54 | 7 | 0.5581718352 | 0.5271286019 | −0.4750002246 | 1.5913438950 | Percentage points |
| Ages 55 and over | 0 | 2.2946467323 | 0.7585921368 | 0.8078061441 | 3.7814873204 | Percentage points |
| Ages 55 and over | 1 | 0.2817912805 | 0.3715075751 | −0.4463635667 | 1.0099461278 | Percentage points |
| Ages 55 and over | 2 | 8.4546929518 | 1.3636091549 | 5.7820190081 | 11.1273668955 | Percentage points |
| Ages 55 and over | 3 | 1.6240482407 | 0.9539243652 | −0.2456435150 | 3.4937399964 | Percentage points |
| Ages 55 and over | 4 | −0.6578871888 | 0.5015095415 | −1.6408458902 | 0.3250715125 | Percentage points |
| Ages 55 and over | 5 | −0.4475778214 | 0.3021694878 | −1.0398300175 | 0.1446743746 | Percentage points |
| Ages 55 and over | 6 | −8.6846156392 | 1.0041643545 | −10.6527777740 | −6.7164535043 | Percentage points |
| Ages 55 and over | 7 | −2.8650985559 | 0.7227367069 | −4.2816625015 | −1.4485346103 | Percentage points |
| All ages 15 and over | 0 | 2.7345411933 | 0.7300060817 | 1.3037292732 | 4.1653531134 | Percentage points |
| All ages 15 and over | 1 | 2.7957416714 | 0.5300299102 | 1.7568830473 | 3.8346002954 | Percentage points |
| All ages 15 and over | 2 | −3.2790623382 | 1.0215202177 | −5.2812419649 | −1.2768827114 | Percentage points |
| All ages 15 and over | 3 | 2.7315964361 | 0.8310149616 | 1.1028071113 | 4.3603857609 | Percentage points |
| All ages 15 and over | 4 | 0.0027540789 | 0.3318063310 | −0.6475863297 | 0.6530944876 | Percentage points |
| All ages 15 and over | 5 | −0.0150814628 | 0.2022036102 | −0.4114005388 | 0.3812376132 | Percentage points |
| All ages 15 and over | 6 | −3.9776209121 | 0.5538916415 | −5.0632485295 | −2.8919932948 | Percentage points |
| All ages 15 and over | 7 | −0.9928686666 | 0.3572476415 | −1.6930740439 | −0.2926632893 | Percentage points |
| Monday–Friday diary days, ages 15 and over | 0 | 3.1090177337 | 0.9446803049 | 1.2574443361 | 4.9605911313 | Percentage points |
| Monday–Friday diary days, ages 15 and over | 1 | 3.2861367258 | 0.6636394935 | 1.9854033185 | 4.5868701331 | Percentage points |
| Monday–Friday diary days, ages 15 and over | 2 | −4.0127072772 | 1.3332125614 | −6.6258038976 | −1.3996106568 | Percentage points |
| Monday–Friday diary days, ages 15 and over | 3 | 2.5582632678 | 1.0957629412 | 0.4105679031 | 4.7059586325 | Percentage points |
| Monday–Friday diary days, ages 15 and over | 4 | 0.1966976535 | 0.4529363017 | −0.6910574979 | 1.0844528049 | Percentage points |
| Monday–Friday diary days, ages 15 and over | 5 | −0.0110137633 | 0.2620044723 | −0.5245425291 | 0.5025150024 | Percentage points |
| Monday–Friday diary days, ages 15 and over | 6 | −4.0872417948 | 0.7342223401 | −5.5263175814 | −2.6481660081 | Percentage points |
| Monday–Friday diary days, ages 15 and over | 7 | −1.0391525454 | 0.4518878560 | −1.9248527433 | −0.1534523476 | Percentage points |
| Saturday–Sunday diary days, ages 15 and over | 0 | 1.7947268089 | 0.9695210454 | −0.1055344402 | 3.6949880579 | Percentage points |
| Saturday–Sunday diary days, ages 15 and over | 1 | 1.5650027935 | 0.6477776052 | 0.2953586873 | 2.8346468997 | Percentage points |
| Saturday–Sunday diary days, ages 15 and over | 2 | −1.4378456559 | 1.3453718823 | −4.0747745452 | 1.1990832334 | Percentage points |
| Saturday–Sunday diary days, ages 15 and over | 3 | 3.1666042538 | 1.0141235012 | 1.1789221915 | 5.1542863161 | Percentage points |
| Saturday–Sunday diary days, ages 15 and over | 4 | −0.4839797969 | 0.3476841381 | −1.1654407076 | 0.1974811139 | Percentage points |
| Saturday–Sunday diary days, ages 15 and over | 5 | −0.0252897838 | 0.2727915718 | −0.5599612646 | 0.5093816969 | Percentage points |
| Saturday–Sunday diary days, ages 15 and over | 6 | −3.7025086744 | 0.6902806842 | −5.0554588155 | −2.3495585334 | Percentage points |
| Saturday–Sunday diary days, ages 15 and over | 7 | −0.8767099452 | 0.4765390000 | −1.8107263852 | 0.0573064949 | Percentage points |
56 rows. Changes in joint-state weighted shares, 2025 minus 2015, measured in percentage points. Independent annual samples; difference variance is the sum of annual variances. No continuous trend or within-person change is inferred. State codes match the eight-state table. US civilian noninstitutionalized population aged 15 and over unless the age domain states otherwise; one primary-activity diary per respondent. Same day is not simultaneous activity or a causal effect. Games/computer leisure includes board/card games and non-game computer use; TV includes religious TV and excludes cinema attendance; personal-interest reading is not books only. Weights represent the missing 30 September–11 November 2025 diary dates, but BLS cannot quantify resulting bias; 95% sampling intervals do not cover it.
Scroll horizontally to see all columns.
| Declared population or diary-day group | Conditional overlap and denominator | 2025 minus 2015 | Replicate-weight standard error | Lower 95% sampling limit | Upper 95% sampling limit | Unit |
|---|---|---|---|---|---|---|
| Ages 18 and over — adult sensitivity | Games/computer leisure among reading diary days | 1.2810559755 | 2.1166363664 | −2.8675513026 | 5.4296632536 | Percentage points |
| Ages 18 and over — adult sensitivity | Reading among games/computer-leisure diary days | −8.5833804120 | 1.7220816206 | −11.9586603884 | −5.2081004355 | Percentage points |
| Ages 18 and over — adult sensitivity | Reading among TV/movie diary days | −5.3625404911 | 0.8108478673 | −6.9518023109 | −3.7732786713 | Percentage points |
| Ages 18 and over — adult sensitivity | TV/movies among reading diary days | −5.1337930293 | 1.7801008982 | −8.6227907898 | −1.6447952689 | Percentage points |
| Ages 18 and over — adult sensitivity | TV/movies or games/computer leisure among reading diary days | −3.8156156280 | 1.7063647016 | −7.1600904432 | −0.4711408128 | Percentage points |
| Ages 15–34, including 15–17 | Games/computer leisure among reading diary days | −3.7481501851 | 5.2657291617 | −14.0689793421 | 6.5726789718 | Percentage points |
| Ages 15–34, including 15–17 | Reading among games/computer-leisure diary days | −4.8749142596 | 2.0780127598 | −8.9478192688 | −0.8020092504 | Percentage points |
| Ages 15–34, including 15–17 | Reading among TV/movie diary days | −0.5862403294 | 1.6113958564 | −3.7445762080 | 2.5720955491 | Percentage points |
| Ages 15–34, including 15–17 | TV/movies among reading diary days | −12.7825660052 | 5.8212797910 | −24.1922743955 | −1.3728576148 | Percentage points |
| Ages 15–34, including 15–17 | TV/movies or games/computer leisure among reading diary days | −10.2825737000 | 5.4463938702 | −20.9575056856 | 0.3923582856 | Percentage points |
| Ages 35–54 | Games/computer leisure among reading diary days | 8.6965579834 | 3.9304134935 | 0.9929475361 | 16.4001684307 | Percentage points |
| Ages 35–54 | Reading among games/computer-leisure diary days | −1.2072316149 | 2.8565901478 | −6.8061483045 | 4.3916850747 | Percentage points |
| Ages 35–54 | Reading among TV/movie diary days | −2.1896857879 | 1.2740214168 | −4.6867677648 | 0.3073961890 | Percentage points |
| Ages 35–54 | TV/movies among reading diary days | −3.5554714971 | 4.0641853328 | −11.5212747494 | 4.4103317552 | Percentage points |
| Ages 35–54 | TV/movies or games/computer leisure among reading diary days | −1.4231057977 | 3.9038818327 | −9.0747141899 | 6.2285025945 | Percentage points |
| Ages 55 and over | Games/computer leisure among reading diary days | −0.5273808374 | 2.5843006272 | −5.5926100667 | 4.5378483919 | Percentage points |
| Ages 55 and over | Reading among games/computer-leisure diary days | −13.7962785500 | 3.1887555224 | −20.0462393739 | −7.5463177261 | Percentage points |
| Ages 55 and over | Reading among TV/movie diary days | −12.8516491049 | 1.2429003597 | −15.2877338099 | −10.4155643999 | Percentage points |
| Ages 55 and over | TV/movies among reading diary days | −2.8919373015 | 2.0545449051 | −6.9188453155 | 1.1349707126 | Percentage points |
| Ages 55 and over | TV/movies or games/computer leisure among reading diary days | −2.5450618212 | 1.8624173329 | −6.1953997936 | 1.1052761513 | Percentage points |
| All ages 15 and over | Games/computer leisure among reading diary days | 1.3944979465 | 2.1576573437 | −2.8345104472 | 5.6235063401 | Percentage points |
| All ages 15 and over | Reading among games/computer-leisure diary days | −7.7197856502 | 1.6408207598 | −10.9357943393 | −4.5037769610 | Percentage points |
| All ages 15 and over | Reading among TV/movie diary days | −5.1154922468 | 0.7986889669 | −6.6809226219 | −3.5500618717 | Percentage points |
| All ages 15 and over | TV/movies among reading diary days | −6.0894694575 | 1.8149945992 | −9.6468588720 | −2.5320800430 | Percentage points |
| All ages 15 and over | TV/movies or games/computer leisure among reading diary days | −4.5478691497 | 1.7778136864 | −8.0323839749 | −1.0633543244 | Percentage points |
| Monday–Friday diary days, ages 15 and over | Games/computer leisure among reading diary days | 1.0939787523 | 2.6832490269 | −4.1651893404 | 6.3531468449 | Percentage points |
| Monday–Friday diary days, ages 15 and over | Reading among games/computer-leisure diary days | −8.2694387223 | 2.0790265902 | −12.3443308391 | −4.1945466056 | Percentage points |
| Monday–Friday diary days, ages 15 and over | Reading among TV/movie diary days | −5.1203986849 | 1.0794697445 | −7.2361593841 | −3.0046379858 | Percentage points |
| Monday–Friday diary days, ages 15 and over | TV/movies among reading diary days | −7.4752816580 | 2.4514690721 | −12.2801610394 | −2.6704022767 | Percentage points |
| Monday–Friday diary days, ages 15 and over | TV/movies or games/computer leisure among reading diary days | −5.9281223058 | 2.3757190636 | −10.5845316705 | −1.2717129410 | Percentage points |
| Saturday–Sunday diary days, ages 15 and over | Games/computer leisure among reading diary days | 2.1840631326 | 2.6594693456 | −3.0284967848 | 7.3966230500 | Percentage points |
| Saturday–Sunday diary days, ages 15 and over | Reading among games/computer-leisure diary days | −6.4314102333 | 2.0802230179 | −10.5086473483 | −2.3541731183 | Percentage points |
| Saturday–Sunday diary days, ages 15 and over | Reading among TV/movie diary days | −5.1005340113 | 1.0233684256 | −7.1063361254 | −3.0947318971 | Percentage points |
| Saturday–Sunday diary days, ages 15 and over | TV/movies among reading diary days | −2.3575797534 | 2.3394574013 | −6.9429162599 | 2.2277567532 | Percentage points |
| Saturday–Sunday diary days, ages 15 and over | TV/movies or games/computer leisure among reading diary days | −0.8338793189 | 1.9556198526 | −4.6668942300 | 2.9991355923 | Percentage points |
35 rows. Changes in conditional weighted percentages, 2025 minus 2015, measured in percentage points. Each endpoint retains its stated denominator. Independent-sample difference intervals are calculated from unrounded results; displayed endpoint percentages must not be used to reconstruct differences. US civilian noninstitutionalized population aged 15 and over unless the age domain states otherwise; one primary-activity diary per respondent. Same day is not simultaneous activity or a causal effect. Games/computer leisure includes board/card games and non-game computer use; TV includes religious TV and excludes cinema attendance; personal-interest reading is not books only. Weights represent the missing 30 September–11 November 2025 diary dates, but BLS cannot quantify resulting bias; 95% sampling intervals do not cover it.
Scroll horizontally to see all columns.
| Declared population or diary-day group | Primary-activity category | Diary-day denominator | 2025 minus 2015 | Replicate-weight standard error | Lower 95% sampling limit | Upper 95% sampling limit | Unit |
|---|---|---|---|---|---|---|---|
| Ages 18 and over — adult sensitivity | Games and computer leisure | All diary days in the declared population | 11.7808629990 | 2.0358087859 | 7.7906777786 | 15.7710482194 | Minutes |
| Ages 18 and over — adult sensitivity | Games and computer leisure | Only diary days containing the stated category | 28.5844096548 | 6.5328410412 | 15.7800412141 | 41.3887780955 | Minutes |
| Ages 18 and over — adult sensitivity | Personal-interest reading | All diary days in the declared population | −3.3489260862 | 1.0222240203 | −5.3524851659 | −1.3453670064 | Minutes |
| Ages 18 and over — adult sensitivity | Personal-interest reading | Only diary days containing the stated category | 9.5338232595 | 4.6560680637 | 0.4079298547 | 18.6597166644 | Minutes |
| Ages 18 and over — adult sensitivity | TV/movies, including religious TV | All diary days in the declared population | −8.4839180554 | 3.4326741149 | −15.2119593207 | −1.7558767902 | Minutes |
| Ages 18 and over — adult sensitivity | TV/movies, including religious TV | Only diary days containing the stated category | 2.9410098102 | 3.8233532422 | −4.5527625444 | 10.4347821648 | Minutes |
| Ages 15–34, including 15–17 | Games and computer leisure | All diary days in the declared population | 28.8000460184 | 5.4226980485 | 18.1715578433 | 39.4285341934 | Minutes |
| Ages 15–34, including 15–17 | Games and computer leisure | Only diary days containing the stated category | 40.1833041692 | 11.7028192658 | 17.2457784082 | 63.1208299302 | Minutes |
| Ages 15–34, including 15–17 | Personal-interest reading | All diary days in the declared population | 0.2418938327 | 1.7573027769 | −3.2024196100 | 3.6862072755 | Minutes |
| Ages 15–34, including 15–17 | Personal-interest reading | Only diary days containing the stated category | 3.9179054540 | 11.3008630029 | −18.2317860317 | 26.0675969397 | Minutes |
| Ages 15–34, including 15–17 | TV/movies, including religious TV | All diary days in the declared population | −22.5757778781 | 5.4460546954 | −33.2500450811 | −11.9015106752 | Minutes |
| Ages 15–34, including 15–17 | TV/movies, including religious TV | Only diary days containing the stated category | −4.0904201613 | 6.6428678059 | −17.1104410609 | 8.9296007384 | Minutes |
| Ages 35–54 | Games and computer leisure | All diary days in the declared population | 10.1110384511 | 2.3004737205 | 5.6021099589 | 14.6199669432 | Minutes |
| Ages 35–54 | Games and computer leisure | Only diary days containing the stated category | 21.5563977648 | 7.6692788581 | 6.5246112029 | 36.5881843266 | Minutes |
| Ages 35–54 | Personal-interest reading | All diary days in the declared population | 1.3992219672 | 1.8013548000 | −2.1314334409 | 4.9298773753 | Minutes |
| Ages 35–54 | Personal-interest reading | Only diary days containing the stated category | 23.6507441312 | 10.3073026976 | 3.4484308439 | 43.8530574184 | Minutes |
| Ages 35–54 | TV/movies, including religious TV | All diary days in the declared population | −20.9010753441 | 4.5867265471 | −29.8910593764 | −11.9110913117 | Minutes |
| Ages 35–54 | TV/movies, including religious TV | Only diary days containing the stated category | −15.4512446890 | 5.5804697441 | −26.3889653874 | −4.5135239906 | Minutes |
| Ages 55 and over | Games and computer leisure | All diary days in the declared population | −0.4866704238 | 1.8050419992 | −4.0245527421 | 3.0512118946 | Minutes |
| Ages 55 and over | Games and computer leisure | Only diary days containing the stated category | 5.2690381968 | 7.1324746293 | −8.7106120767 | 19.2486884703 | Minutes |
| Ages 55 and over | Personal-interest reading | All diary days in the declared population | −12.3188609861 | 1.7804403602 | −15.8085240921 | −8.8291978801 | Minutes |
| Ages 55 and over | Personal-interest reading | Only diary days containing the stated category | 4.0703141681 | 4.8934162055 | −5.5207815948 | 13.6614099309 | Minutes |
| Ages 55 and over | TV/movies, including religious TV | All diary days in the declared population | 2.8215685536 | 6.1231132281 | −9.1797333736 | 14.8228704808 | Minutes |
| Ages 55 and over | TV/movies, including religious TV | Only diary days containing the stated category | 7.6973573728 | 6.5659181901 | −5.1718422798 | 20.5665570255 | Minutes |
| All ages 15 and over | Games and computer leisure | All diary days in the declared population | 12.1143266526 | 2.1213558668 | 7.9564691538 | 16.2721841515 | Minutes |
| All ages 15 and over | Games and computer leisure | Only diary days containing the stated category | 26.1205142603 | 6.3939975540 | 13.5882790544 | 38.6527494662 | Minutes |
| All ages 15 and over | Personal-interest reading | All diary days in the declared population | −3.3159263767 | 1.0158581763 | −5.3070084022 | −1.3248443512 | Minutes |
| All ages 15 and over | Personal-interest reading | Only diary days containing the stated category | 7.8919773926 | 4.5562283660 | −1.0382302047 | 16.8221849900 | Minutes |
| All ages 15 and over | TV/movies, including religious TV | All diary days in the declared population | −10.1333253943 | 3.3303134279 | −16.6607397130 | −3.6059110756 | Minutes |
| All ages 15 and over | TV/movies, including religious TV | Only diary days containing the stated category | 1.8705773176 | 3.7592904405 | −5.4976319457 | 9.2387865810 | Minutes |
| Monday–Friday diary days, ages 15 and over | Games and computer leisure | All diary days in the declared population | 11.4920990406 | 2.5870984288 | 6.4213861201 | 16.5628119611 | Minutes |
| Monday–Friday diary days, ages 15 and over | Games and computer leisure | Only diary days containing the stated category | 23.6207129348 | 8.3301396905 | 7.2936391415 | 39.9477867282 | Minutes |
| Monday–Friday diary days, ages 15 and over | Personal-interest reading | All diary days in the declared population | −3.0210153527 | 1.3555547301 | −5.6779026237 | −0.3641280818 | Minutes |
| Monday–Friday diary days, ages 15 and over | Personal-interest reading | Only diary days containing the stated category | 8.2287493141 | 5.9927622022 | −3.5170646023 | 19.9745632305 | Minutes |
| Monday–Friday diary days, ages 15 and over | TV/movies, including religious TV | All diary days in the declared population | −15.2838925421 | 4.2751293362 | −23.6631460411 | −6.9046390431 | Minutes |
| Monday–Friday diary days, ages 15 and over | TV/movies, including religious TV | Only diary days containing the stated category | −3.3501851578 | 4.9418099387 | −13.0361326377 | 6.3357623222 | Minutes |
| Saturday–Sunday diary days, ages 15 and over | Games and computer leisure | All diary days in the declared population | 13.6759010834 | 3.2723607202 | 7.2620740718 | 20.0897280950 | Minutes |
| Saturday–Sunday diary days, ages 15 and over | Games and computer leisure | Only diary days containing the stated category | 32.9015392684 | 9.2307895610 | 14.8091917290 | 50.9938868079 | Minutes |
| Saturday–Sunday diary days, ages 15 and over | Personal-interest reading | All diary days in the declared population | −4.0560680534 | 1.2661103774 | −6.5376443931 | −1.5744917138 | Minutes |
| Saturday–Sunday diary days, ages 15 and over | Personal-interest reading | Only diary days containing the stated category | 7.1937881574 | 5.3763354951 | −3.3438294129 | 17.7314057278 | Minutes |
| Saturday–Sunday diary days, ages 15 and over | TV/movies, including religious TV | All diary days in the declared population | 2.7928149226 | 5.0205780681 | −7.0475180909 | 12.6331479361 | Minutes |
| Saturday–Sunday diary days, ages 15 and over | TV/movies, including religious TV | Only diary days containing the stated category | 12.4486986775 | 5.5165118784 | 1.6363353959 | 23.2610619592 | Minutes |
42 rows. Changes in mean minutes, 2025 minus 2015, within the specified all-day or category-participation denominator. Independent annual samples, not a panel. Difference uncertainty is based on the sum of annual variances. US civilian noninstitutionalized population aged 15 and over unless the age domain states otherwise; one primary-activity diary per respondent. Same day is not simultaneous activity or a causal effect. Games/computer leisure includes board/card games and non-game computer use; TV includes religious TV and excludes cinema attendance; personal-interest reading is not books only. Weights represent the missing 30 September–11 November 2025 diary dates, but BLS cannot quantify resulting bias; 95% sampling intervals do not cover it.
Evidence & method
How we calculated it
- Use official BLS ATUS 2015 and 2025 Activity, Activity Summary and replicate-weight files, annual lexicons, the 2025 interview dictionary and the September 2026 user guide. The analysis plan and day-group addendum preceded the new computation. Main universe: US civilian noninstitutionalized population aged 15 and over; ages 18 and over are a separately labelled sensitivity.
- Join unique TUCASEID records; verify every diary totals 1,440 minutes and selected activity durations match official summary columns. Reading uses 120312; TV/movies uses 120303 and 120304; games/computer leisure uses 120307 and 120308. Presence requires positive summed primary-activity minutes. Construct eight exclusive R/T/G states; reconcile their raw counts and weighted shares within each declared group.
- Compute weighted point estimates with TUFINLWGT and recalculate each statistic with FINLWGT001 through FINLWGT160, including conditional denominators. Variance equals 4/160 times the sum of squared replicate deviations from the full-weight estimate. Use estimate ±1.96 standard errors for 95% sampling intervals without truncating boundaries. Add annual variances for independent 2025-minus-2015 endpoint differences.
- Retain seven domains: all ages 15+, adults 18+, ages 15–34, 35–54 and 55+, Monday–Friday diaries and Saturday–Sunday diaries. Day-of-week codes are 2–6 and 1/7 respectively. The domains overlap and are not independent groups to be pooled. Preserve null or unestimable quantities rather than substituting zero.
- Provide 399 aggregate rows across the six result tables, with original precision, unweighted counts, standard errors, intervals and editorial low-event flags. The flag threshold is fewer than 30 unweighted events; it is not a BLS suppression standard. No individual records or identifiers are public outputs.
What the data cannot tell us
- 2025 diary dates from 30 September through 11 November are missing because of the federal shutdown. Official weighting represents those dates from available observations, but BLS cannot quantify resulting bias. Sampling confidence intervals do not include that possible bias.
- Each respondent reports one primary-activity day. Same-day overlap does not establish simultaneous use, distraction, displacement, competition, protection, causality or a permanent reader identity. Primary diaries omit some simultaneous reading and listening.
- Reading is personal-interest reading, not novels, print books, completed books or a particular genre. TV includes religious television and excludes cinema attendance. Games/computer leisure includes board/card games and non-game computer use; it is not all screen time, social media, smartphone use or video gaming alone.
- The main population includes ages 15–17. Adult, age and weekday/weekend estimates have distinct denominators and overlapping domains; unadjusted patterns are not age effects, customer segments, sales forecasts or recommended routines.
- 2015 and 2025 are independent cross-sections. Endpoint differences do not form a continuous trend or follow individual changes. Recall, nonresponse, classification and changes in examples can affect comparisons even when code labels remain stable. The analysis does not explain the earlier reading-participation findings.
- Only and none describe membership among three selected categories. They do not mean exclusive daily attention, no other activity, or no leisure/media. Conditional percentages with overlapping events cannot be added; raw counts divided by bases do not reproduce weighted estimates.
Original sources
- BLS American Time Use Survey 2015: Activity Summary and linked annual public-use files
Bureau of Labor Statistics. American Time Use Survey 2015 public-use files: Activity, Activity Summary, respondent and replicate-weight data. https://www.bls.gov/tus/data/datafiles_2015.htm https://www.bls.gov/tus/datafiles/atussum_2015.zip
Accessed October 28, 2026
- BLS American Time Use Survey 2025: Activity Summary and linked annual public-use files
Bureau of Labor Statistics. American Time Use Survey 2025 public-use files. One diary day per respondent; the federal shutdown omitted 30 September–11 November diary dates. https://www.bls.gov/tus/data/datafiles-2025.htm https://www.bls.gov/tus/datafiles/atussum-2025.zip
Accessed October 28, 2026
- BLS ATUS User’s Guide, September 2026 edition
Bureau of Labor Statistics. ATUS User’s Guide, frozen September 2026 edition: primary activities, replicate-weight variance and source limitations. https://www.bls.gov/tus/atususersguide.pdf
Accessed October 28, 2026
- BLS ATUS 2015 activity lexicon
Bureau of Labor Statistics. 2015 activity lexicon. Category definitions are broader than novels, video games or all screen time. https://www.bls.gov/tus/lexicons/lexiconnoex2015.pdf
Accessed October 28, 2026
- BLS ATUS 2025 activity lexicon
Bureau of Labor Statistics. 2025 activity lexicon. TV/movies includes religious television; games/computer leisure includes board/card games and non-game computer leisure. https://www.bls.gov/tus/lexicons/lexiconnoex2025.pdf
Accessed October 28, 2026
- BLS ATUS 2025 interview dictionary
Bureau of Labor Statistics. 2025 ATUS interview dictionary. https://www.bls.gov/tus/dictionaries/atusintcodebk25.pdf
Accessed October 28, 2026
- Bone et al. (2025), iScience, DOI 10.1016/j.isci.2025.113288
Bone and colleagues (2025), iScience, DOI 10.1016/j.isci.2025.113288. Existing reading-participation research through 2023; media displacement discussed as untested. Original article text and figures are not reproduced. https://pmc.ncbi.nlm.nih.gov/articles/PMC12496190/
Accessed October 28, 2026
Cite & reuse this study
Alisson Bento. Reading, television and games on the same day: US diary overlap in 2015 and 2025. Original secondary analysis of BLS American Time Use Survey 2015 and 2025 public-use files; calculations frozen 2026-10-28. Published 2026-10-31. https://alissonbento.com/research/us-reading-media-same-day-overlap/
Original analysis, expression and arrangement by Alisson Bento are licensed under CC BY 4.0, https://creativecommons.org/licenses/by/4.0/; original code uses the MIT licence in CODE-LICENSE.txt. Source credit: US Bureau of Labor Statistics, American Time Use Survey 2015 and 2025. Government-source reuse and attribution follow the frozen source review; no blanket licence for third-party material is claimed. Preserve author and source credits, category definitions, populations, denominators, survey years, sampling uncertainty and the separate shutdown-bias qualification, and identify changes. Public outputs contain original aggregates, code, charts and paraphrased explanation, excluding source ZIP/DAT files, individual records or identifiers, BLS logos, third-party media and prior-paper content. Credit Bone and colleagues (2025), iScience, DOI 10.1016/j.isci.2025.113288. Original-work licences do not relicense those sources. No BLS affiliation or endorsement is implied; this original secondary analysis is not a peer-reviewed publication.
Corrections or editorial questions