
A seat count needs a clearly named denominator
A library’s reported seating count cannot, by itself, describe how intensively its space is furnished. A ratio also needs an area, and different area fields can produce different answers. British Columbia’s public-library workbook distinguishes total space across service points from space labelled for public use. This analysis asks how that distinction interacts with reporting coverage and with a system-level seating statistic. It does not ask how many seats a visitor can actually find, whether a room is quiet, or which library offers the best reading environment.
The substantive issue is not the mathematical fact that a smaller positive denominator raises a ratio. The evidence lies in which reported records support either denominator, how much observed area those records cover, and how sensitive comparisons become when public-use/total-area ratios vary. The 2024 frame contains 71 reporting systems, but only 60 have coherent positive paired areas, and 53 also have a usable reported seating count. Those changing supports are part of the result, not administrative details to hide behind a single province-labelled number.
The strongest caution concerns unusually small recorded area ratios. All source values remain in the main calculation, including three ratios below one tenth of reported total area. An explicitly post-pilot diagnostic finds that these three systems are involved in 119 of the 211 numerical order reversals between the two seating-intensity definitions. That concentration makes source-value sensitivity central to interpretation. It does not establish that the recorded values are mistakes, nor does it justify replacing them with presumed correct values or presenting a cleaned ranking.
The year is fixed; the measurement instructions have limits
The analysis fixes the workbook’s actual 2024 worksheet and rows whose Period field is 2024 and whose library symbol is nonempty. The download filename refers to version 24, while the workbook title refers to version 25, and the workbook includes later data. The worksheet and row period, not the filename alone, anchor this selection. No 2025 values or alternative CSV series enter the calculations. A library system is the reporting unit: its record can combine multiple service points and is not a separate observation of each building.
Three literal headers define the comparison. Field 860 is “Space/size: total square metres, all service points”; field 865 is “Total space for public use, sq metres”; field 862 is “Public seating”. The first is called reported total space here, not technical gross floor area. The second is public-use-labelled area, not verified quiet reading space or space available at a particular visit. Keeping those labels visible prevents an attractive everyday interpretation from silently replacing the administrative measures that were actually supplied.
The linked 2021 question list provides historical context. It describes public-use area as excluding private offices and facilities not serving the public, and seating as including chairs, stools and capacity on benches and sofas and for window-area seating. Matching identifiers and compatible 2024 headers support cautious contextual use, but an exact 2024 questionnaire and seating reference date have not been separately verified. In particular, a pandemic-related timing instruction in the 2021 list is not asserted for 2024. The numerator remains the reported seating field, without an invented date or occupancy meaning.
From 71 reported systems to two analytical subsets
The complete frame retains all 71 systems. Of these, 69 report positive numeric total space. The paired-area rule requires both area values to be numeric and positive, with public-use-labelled area no greater than reported total area. Sixty systems meet that rule. Coherent in this context means suitable for the stated comparison under this rule; it does not certify that an architect measured the space, that the two fields share an independently verified technical standard, or that every reporting institution interpreted the instructions identically.
The 11 paired-area exclusions are explicit: six systems lack a public-use value, two lack both area values, two report public-use area greater than total area, and one reports public-use zero. A blank and a zero remain different source observations. The zero is not converted to missing or automatically declared erroneous; it simply cannot serve as the positive denominator required here. Likewise, a public-use value above total is retained in the inputs but excluded from this particular coherent-pair calculation, rather than silently corrected.
The seating comparison adds one more condition: a numeric, nonnegative reported seating count within the paired-area subset. Seven additional systems lack usable seating, leaving 53 systems for both intensity definitions. Their membership is identical whichever area denominator is used. No missing count is imputed, no area is redistributed to branches, and no excluded system disappears from the downloadable eligibility audit. This common-case design prevents a change of sample from being mistaken for a change caused by the choice of area denominator.
Coverage is about observed area, not the province’s readers
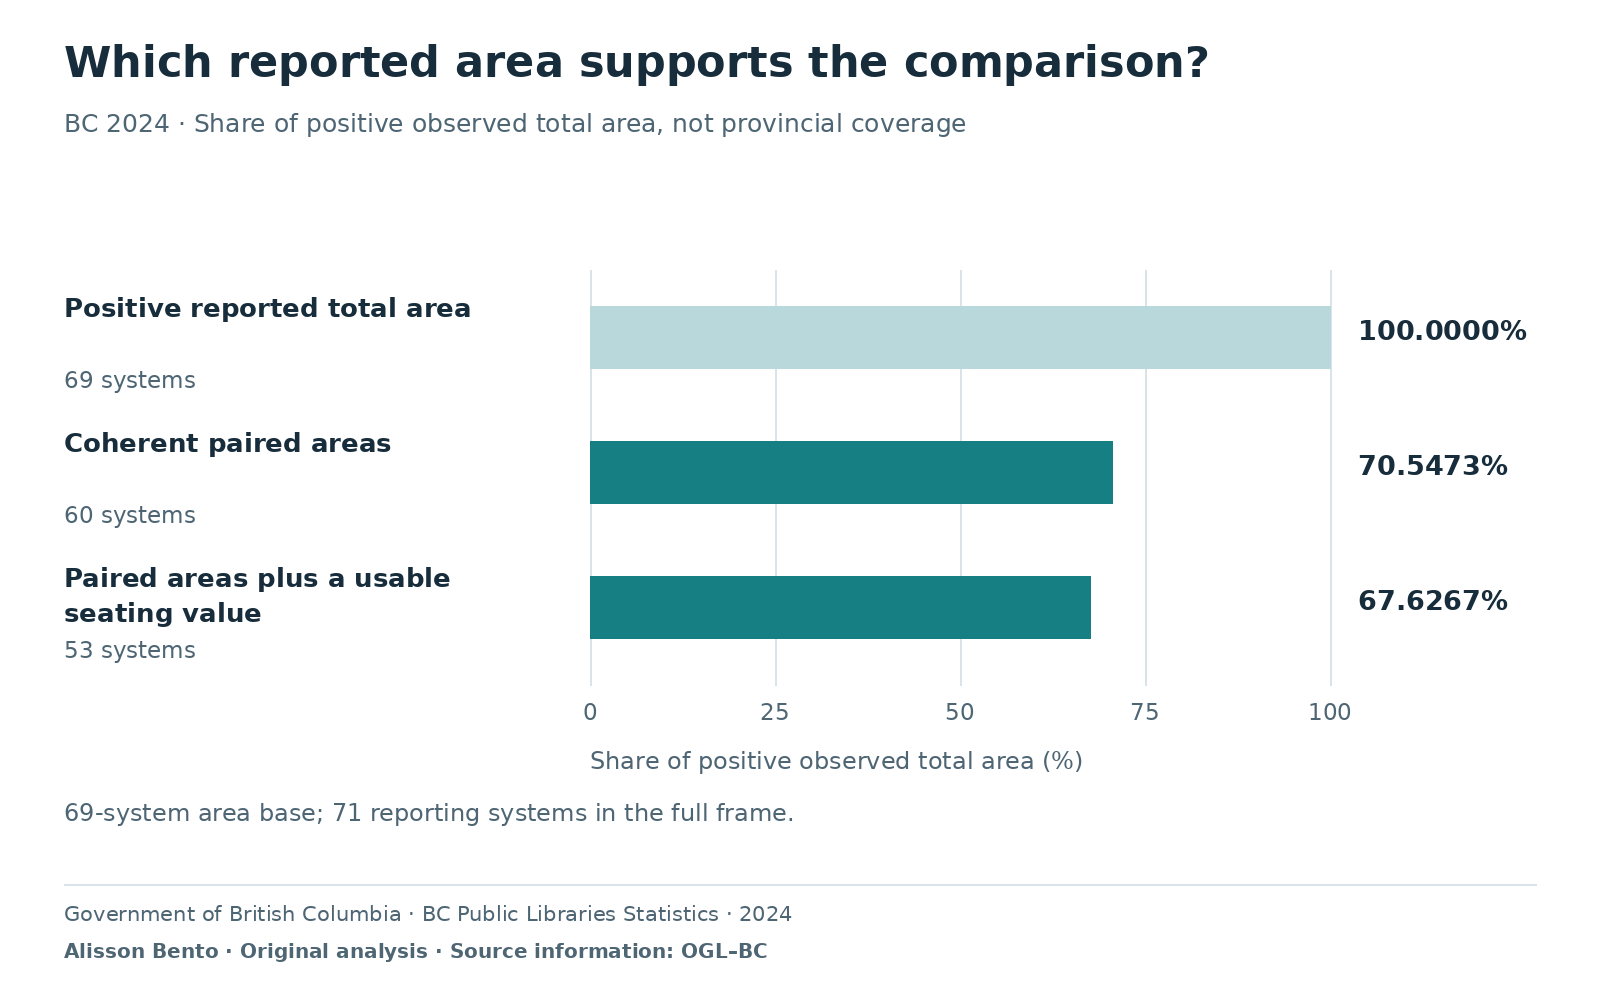
The 69 systems with positive observed total area report a combined 263,880.89 square metres, rounded for display. Within that observed base, the 60 coherent paired systems account for 186,160.82 square metres, or 70.5473%. This is the area coverage of the paired-field comparison. It is not the fraction of British Columbia’s residents, library buildings or complete provincial library estate represented. Systems without a positive recorded total cannot contribute to this observed-area denominator; their unobserved area is not assumed to be zero.
The 53-system seating subset accounts for 178,454.02 square metres of reported total space, or 67.6267% of the same positive observed-area base. That is a different support statement from counting systems. A record-count fraction and an area-weighted coverage fraction can differ because reporting systems vary in size. Neither can stand in for coverage of visitors or access to services. The table therefore states both the system count and the observed-area measure, rather than offering a percentage whose denominator readers must infer.
Incomplete paired reporting matters even when the calculations within the retained records are exact. There is no demonstrated basis for assuming omitted systems have the same public-use shares or seating patterns as included systems. The analysis consequently stops at the stated subsets. It does not scale their totals upward to manufacture a provincial estimate. This is a measurement-support result: a widely labelled administrative dataset can still support only a narrower comparison for a specific combination of fields, and the unsupported remainder must remain visible.
Pooled area and the middle system answer different questions
Among the 60 paired systems, summed public-use-labelled area is 147,554.68 square metres. Dividing it by their summed total area gives a pooled public-use share of 79.2619%. The median individual system share is 83.2397%, with inclusive lower and upper quartiles of 73.9307% and 92.3619%. These are not competing estimates of one typical province-wide percentage. The pooled ratio gives larger total-area records more influence, while the median describes the middle of the system-ratio distribution without that area weighting.
The difference between the two summaries illustrates why the unit being summarized must be named. A reader asking what share of the paired reported area carries the public-use label should use the pooled ratio. A reader asking about the middle system’s reported fraction should use the median. Neither describes the probability that a visitor will reach public space or find a seat. The observed range also includes the very small ratios discussed below and a maximum of 100%; distributional summaries do not resolve the validity of individual source records.
Subtracting public-use-labelled area from reported total area leaves 38,606.14 square metres within the same 60 systems. This is a reported-field residual, not a measured inventory of staff offices, storage or wasted space. Historical definitions offer context for why some space might fall outside public use, but do not classify every residual square metre in the 2024 records. Calling the difference inefficiency would require evidence about functions, measurement boundaries and service needs that these three fields do not provide. The arithmetic difference should not acquire a policy judgment by implication.
The same seats produce two different intensity statistics
Within the common 53-system seating subset, the numerator is 11,835 reported seats under both definitions. Their reported total area is 178,454.02 square metres, and public-use-labelled area is 140,870.78 square metres. The pooled ratios are therefore 6.63196 seats per 100 square metres of total space and 8.40132 per 100 square metres of public-use-labelled space. No chairs have been added between these calculations. The apparent rise is a denominator change applied to the same reported seats in the same systems, not improvement over time.
System-level medians also differ: 8.16143 seats per 100 square metres using total space, and 10.33873 using public-use-labelled space. The median system multiplier is 1.20270. This multiplier belongs to the same 53-system comparison; it should not be reconstructed by inverting the separate 60-system median public-use share. Medians do not generally commute with such changes of subset or arithmetic. Stating the support alongside the statistic avoids merging an area-distribution result and a seating-subset result into a quantity that was never actually calculated.
Even a correctly calculated intensity is not a seat-availability measure. The workbook does not place every reported seat within a particular room, service point or opening hour, nor show whether it is occupied, accessible, suitable for a task or available to a visitor. System aggregation can conceal where seats and space are located relative to each other. The ratio describes reported seating against a named reported area. Using it to judge crowding, comfort, capacity for reading, or the experience of arriving without a seat would exceed the evidence.
Changing denominators changes some numerical comparisons
The denominator distinction can affect numerical order as well as scale. Comparing every unordered pair among the 53 common systems gives 1,378 pairs. None is tied under either seating-intensity definition, and 211 pairs, or 15.3120%, reverse order when public-use-labelled area replaces total area. The test uses exact crossproducts, not ratios rounded to the table’s displayed precision. A reversal means only that the sign of a pairwise numerical difference changes between the definitions; it does not mean either institution becomes better or worse.
Those 1,378 comparisons are linked. Each system appears in many pairs, so the pair count is not a sample of independent observations. No significance test, uncertainty interval or population-ranking inference is attached to the reversal fraction. Its purpose is to show that a denominator choice can alter inter-system comparisons within these fixed reported records. Treating each pair as an independent trial would exaggerate the apparent amount of evidence and obscure the fact that a small number of source records can participate repeatedly.
A comparison table without clear area labels could therefore invite incompatible conclusions from the same seating counts. Yet the reversal total alone is not enough: it does not say how evenly the reversals are distributed among systems or whether especially small reported denominators dominate them. The next diagnostic addresses that limitation without publishing a league table. Numerical order is examined as a property of two measurements, not as a proxy for reader amenities, management performance or a recommendation about which library someone should use.
Three small recorded area ratios matter to the reversals
Three recorded public-use/total-area ratios are especially small: 0.96875%, 9.09091% and 9.50673%. Their underlying area pairs are 31 against 3,200 square metres, 56 against 616, and 106 against 1,115. They remain unchanged in the selected inputs and every main result. These numbers could raise questions about units, interpretation or recording, but the workbook alone does not establish an explanation. The analysis neither validates them as literal descriptions of usable reader space nor labels them errors on the strength of their unusual size.
After the pilot results were known, an independent diagnostic partitioned the existing pairs according to whether either member had one of those three smallest ratios. There are 153 such pairs and 1,225 other pairs. The first group contains 119 reversals and the second 92, adding to the unchanged total of 211. Thus 56.3981% of all reversals involve at least one of the three systems. This is an explicitly post-pilot source-value sensitivity finding, not a contrast selected before any outcomes were visible.
The partition counts each pair once, even if both members belong to the three-system group. Simply adding institution-specific reversal counts would double-count some shared pairs and answer a different question. More importantly, the finding qualifies the aggregate reversal percentage: a majority of reversals involve a very small set of unusually low recorded area fractions. The other 92 reversals remain real comparisons under the same rules, but their existence does not establish that the remaining source values have been validated or that they constitute a preferred unbiased sample.
A post-pilot diagnostic is not permission to repair the data
It would be tempting to remove the three records and present a reassuring replacement statistic. That is not the analysis performed here. The diagnostic is a disjoint partition of the original comparisons, not an exclusion rule or a revised primary estimate. All extremes remain in the pooled ratios, medians and pairwise totals. A defensible correction would require additional evidence about what was reported and how it should be interpreted. Suspicion prompted by a ratio is not enough to choose a new value, change units or relabel an observation.
The same restraint applies to the incomplete reporting frame. Neither dropping unusual records nor keeping them resolves the missing paired fields elsewhere. These are separate limitations: coverage concerns which records support the comparison, while sensitivity concerns how particular retained values affect it. Combining both into a vague claim that data are imperfect would lose useful information. The audit instead identifies the exclusions, quantifies observed-area coverage, and shows a transparent partition of reversals, allowing readers to see exactly where the limits enter the calculation.
The design history is likewise explicit. The original pilot fixed its 2024 frame and eligibility rules after limited initial source exposure; the independent review knew the pilot’s results. The three-record diagnostic was added after that pilot. No outcome-blind preregistration is claimed. This history does not change the recorded arithmetic, but it changes what can be said about selection and confirmation. The proper description is a bounded descriptive measurement audit with a labelled post-pilot diagnostic, not a prospectively tested discovery or a new general law about library space.
Precision, reproducibility and the boundaries of the source
The downloadable inputs preserve the selected workbook values, including long decimal storage tails. For example, an area sum displayed as 186,160.82 square metres has a longer unrounded representation in the results file. Rounding makes prose readable; it is not a repair of the source. The calculation code uses exact rational arithmetic for the comparisons, and the full selected values remain available. Independent checking matched 568 selected source fields and reproduced 70 numerical or categorical outcomes, supporting extraction and arithmetic rather than certifying the underlying physical measurements.
The compact bundle includes all 71 selected system rows, eligibility reasons, aggregate results, group summaries and the extreme-value diagnostic. A standard-library Python reproducer takes explicit input and output paths and regenerates the derived files without a network connection. Public source URLs and original workbook fingerprints distinguish the pinned source version from a later download; distributed-file checksums cover the selected inputs as supplied. Reproducibility here means another reader can follow the same values and rules, not that the unresolved definition or source-value questions disappear.
The source information is attributed to the Government of British Columbia under the Open Government Licence–British Columbia. Original article text and calculations are attributed to Alisson Bento. The source licence does not imply government endorsement, validate the measurements or create a blanket licence for unrelated works or the article. The full multi-year workbook and questionnaire are not redistributed in the compact bundle. The analysis also claims no first-ever denominator principle or library-space metric: its contribution is the specific, reproducible audit of reporting support and sensitivity in this pinned year.
What a reader can safely take from the comparison
The practical result is a disciplined way to read a seating statistic. Ask which area field appears in its denominator, which systems have both fields, whether the seating numerator is held fixed, and how unusual reported area fractions affect comparisons. In this case, coherent paired fields cover 70.5473% of positive observed total area, not an established share of the province’s readers or space. The seating comparison is narrower still. Those qualifications belong beside the numbers, not in a distant note after an institution has already been ranked.
For libraries and interested readers, the two intensities can be useful descriptions if their limits remain attached. One expresses reported seats relative to total reported system space; the other expresses the same seats relative to public-use-labelled space. Neither establishes the amount, location or quality of space actually available for reading. A study of visitor access, occupied seating or quiet rooms would need direct measures of those subjects. This workbook cannot supply them simply because its public-use and seating labels sound relevant.
The central conclusion is therefore not that seating improved when the denominator became smaller. It is that reporting completeness and source-value sensitivity materially condition the comparison: 60 systems support paired areas, 53 support both seat/area ratios, and three unusually small recorded area fractions participate in 119 of 211 order reversals. Keeping every value and every limit visible yields a more informative result than either an unqualified density ranking or a silently cleaned one. The evidence remains a description of reported fields, not a judgment on the library experience.
Which reported area supports the comparison?
BC 2024 · Share of positive observed total area, not provincial coverage
Full chart and source

Scroll horizontally to inspect the chart. ↔
Chart and values
Scroll horizontally to see all columns.
| Reporting support | Systems | Reported total area (m²) | Share of positive observed area (%) |
|---|---|---|---|
| Positive reported total area | 69 | 263,880.89 | 100.0000 |
| Coherent positive paired areas | 60 | 186,160.82 | 70.5473 |
| Same paired areas plus a usable seating count | 53 | 178,454.02 | 67.6267 |
2024 reporting systems. Area coverage uses only positive observed total space in 69 systems, not residents, buildings or all provincial area. Areas are rounded to two decimals; complete values remain in downloads.
Three small recorded area ratios involve most reversals
Explicitly post-pilot · 211 reversals among 1,378 linked pairs; 53 systems
Full chart and source

Scroll horizontally to inspect the chart. ↔
Chart and values
Scroll horizontally to see all columns.
| Pair group | All pairs | Reversals | Share of all 211 reversals (%) |
|---|---|---|---|
| Involves at least one of the three smallest area ratios | 153 | 119 | 56.3981 |
| Other pairs | 1,225 | 92 | 43.6019 |
| All pairs | 1,378 | 211 | 100.0000 |
Explicitly post-pilot partition of all 1,378 linked pairs among the same 53 systems. The three smallest recorded public-use/total ratios stay in every primary calculation. Pair groups are disjoint; neither is a preferred trimmed estimate or a quality ranking.

Data & downloads
Scroll horizontally to see all columns.
| Reporting support | Systems | Reported total area (m²) | Share of positive observed area (%) |
|---|---|---|---|
| Positive reported total area | 69 | 263,880.89 | 100.0000 |
| Coherent positive paired areas | 60 | 186,160.82 | 70.5473 |
| Same paired areas plus a usable seating count | 53 | 178,454.02 | 67.6267 |
2024 reporting systems. Area coverage uses only positive observed total space in 69 systems, not residents, buildings or all provincial area. Areas are rounded to two decimals; complete values remain in downloads.
Scroll horizontally to see all columns.
| Pair group | All pairs | Reversals | Share of all 211 reversals (%) |
|---|---|---|---|
| Involves at least one of the three smallest area ratios | 153 | 119 | 56.3981 |
| Other pairs | 1,225 | 92 | 43.6019 |
| All pairs | 1,378 | 211 | 100.0000 |
Explicitly post-pilot partition of all 1,378 linked pairs among the same 53 systems. The three smallest recorded public-use/total ratios stay in every primary calculation. Pair groups are disjoint; neither is a preferred trimmed estimate or a quality ranking.
Scroll horizontally to see all columns.
| Summary | Value | Unit |
|---|---|---|
| Summed reported total area | 186,160.82 | m² |
| Summed public-use-labelled area | 147,554.68 | m² |
| Reported-field residual | 38,606.14 | m² |
| Pooled public-use share | 79.2619 | % |
| Median system share | 83.2397 | % |
| Inclusive lower quartile | 73.9307 | % |
| Inclusive upper quartile | 92.3619 | % |
The pooled ratio weights by total reported area; the median and inclusive quartiles describe system ratios. The residual is only a difference between reported fields, not classified staff-only or wasted space.
Scroll horizontally to see all columns.
| Area denominator | Area (m²) | Pooled seats per 100 m² | Median system seats per 100 m² |
|---|---|---|---|
| Reported total space | 178,454.02 | 6.63196 | 8.16143 |
| Public-use-labelled space | 140,870.78 | 8.40132 | 10.33873 |
Exactly the same 53 systems and seating numerator in both rows. No temporal improvement or actual seat availability is measured. The median system multiplier is 1.20270, not an inverse of the separate 60-system median area share.
Scroll horizontally to see all columns.
| Stage | Reason | Systems |
|---|---|---|
| Paired area | Public-use value missing | 6 |
| Paired area | Both area values missing | 2 |
| Paired area | Public-use value greater than total | 2 |
| Paired area | Public-use value reported as zero | 1 |
| Additional seating requirement | Usable seating value missing in a coherent area pair | 7 |
The initial frame contains 71 systems. The first four reasons exclude 11 from paired areas, leaving 60; seven additional missing seating values leave 53. Blanks, zeros and incoherent positive pairs remain distinct, uncorrected observations.
Scroll horizontally to see all columns.
| Reporting system | Total area (m²) | Public-use-labelled area (m²) | Public-use/total (%) |
|---|---|---|---|
| Stewart Public Library (BSP) | 3,200 | 31 | 0.96875 |
| Vanderhoof Public Library (BVDH) | 616 | 56 | 9.09091 |
| Prince Rupert Public Library (BPR) | 1,115 | 106 | 9.50673 |
These are reported fields, not verified descriptions of visitor space or evidence of reporting errors. Ratios are rounded for display. Post-pilot selection identifies the three smallest fractions; no source value or primary sample was repaired or trimmed.
Evidence & method
How we calculated it
- Use the pinned official workbook’s 2024 worksheet and matching Period 2024 rows with a nonempty library symbol: 71 reporting systems. The filename/version-title mismatch does not change this year selection; no 2025 or CSV series is used.
- Literal fields are 860 reported total space across all service points, 865 public-use-labelled square metres and 862 reported public seating. The 2021 question list is historical definition context, not a separately verified 2024 questionnaire or seat reference date. Total space is not asserted as technical gross floor area.
- Paired areas require numeric total>0 and public-use>0 with public-use≤total, leaving 60 systems. Eleven exclusions are six missing public-use, two missing both areas, two public-use above total and one public-use zero. Seven additional missing seating values leave the same 53 systems for both seat/area ratios.
- Coverage is summed total area in each eligible subset divided by summed positive observed total area in 69 systems. Public-use share is field 865/860; the pooled ratio uses area sums, while medians and inclusive quartiles describe individual system shares. No provincial or population extrapolation is made.
- Calculate 100×reported seats/area under each denominator for the same 53 systems. Compare all 1,378 unordered pairs using exact crossproducts; 211 reverse order and none is tied under either definition. Pairs share systems and are not independent sample observations.
- The post-pilot diagnostic partitions unchanged pairs by involvement of the three smallest recorded area ratios: 153 versus 1,225 pairs, containing 119 versus 92 reversals. All extremes remain in every primary result. No outcome-blind preregistration, correction, unit repair or preferred trimmed estimate is claimed.
- Keep original decimal storage tails in the selected inputs and exact aggregate results. Prose, tables and figures round for display only. Standard-library Python reproduces five derived files from explicit input/output paths; public source fingerprints and distributed-file checksums identify the original workbooks and selected inputs.
What the data cannot tell us
- Reported system fields do not measure occupied seats, crowding, comfort, quiet reading rooms, actual availability, accessibility compliance, service quality or reader access. They do not allocate seats and area among buildings or service points.
- The 60 paired systems cover 70.5473% of positive observed total area, not a verified share of all provincial library space, residents or buildings. The 53-system seating subset is narrower. Missing systems are not assumed comparable or extrapolated.
- The literal 2024 headers identify the measures, but an exact 2024 questionnaire and seating reference date have not been separately verified. Historical 2021 definitions are conditional context; pandemic-specific timing is not imported into 2024.
- Total space is not a verified technical gross-floor-area standard. The reported-field residual is not an independently classified inventory of nonpublic rooms, storage or wasted space.
- Three unusually small reported area fractions are retained and unresolved. Their post-pilot participation in 119 of 211 reversals demonstrates sensitivity, not reporting errors, validated measurements or grounds for a preferred trimmed sample.
- The 1,378 pairs are linked deterministic comparisons, not independent observations, a significance test or an institutional best/worst ranking. Changing a denominator is not a temporal improvement in seating.
- The pilot had initial source exposure, and independent review knew its results. The three-record diagnostic is explicitly post-pilot. No outcome-blind preregistration, causal result, historical trend or first-ever measurement method is claimed.
- Exact extraction and reproducible arithmetic cannot certify the underlying physical measurements or uniform interpretation across reporting systems. Display rounding leaves original decimal residuals unchanged in the distributed inputs and results.
Original sources
- Government of British Columbia, BC Public Libraries Statistics: pinned workbook
Government of British Columbia, pinned BC Public Libraries Statistics workbook: actual worksheet and Period 2024, fields 860, 865 and 862. Download filename v24 and internal title v25 are distinguished. Accessed 2026-10-30. https://catalogue.data.gov.bc.ca/dataset/d03007d6-d6c7-44d7-b2f8-710ba9433617/resource/de58182c-842b-4030-94bc-c062d0ccb2cf/download/2002-2024-bc-public-libraries-open-data-xls-v24.0.xlsx
Accessed October 30, 2026
- Government of British Columbia, Annual Survey Questions 2021
Official Annual Survey Questions 2021: historical context for total area, public-use area and seating. Matching 2024 IDs do not establish an exact 2024 questionnaire or seat reference date; the 2021 pandemic timing instruction is not carried forward. Accessed 2026-10-30. https://catalogue.data.gov.bc.ca/dataset/d03007d6-d6c7-44d7-b2f8-710ba9433617/resource/14e7c376-5e10-4db8-8b0c-47c9930befe4/download/2021-annual-survey-questions.xlsx
Accessed October 30, 2026
- BC Data Catalogue metadata record
Official BC Data Catalogue reference for BC Public Libraries Statistics. Dataset identity does not certify reporting practice, individual values or unchanged 2021 instructions; the literal 2024 fields anchor this measurement audit. Accessed 2026-10-30. https://catalogue.data.gov.bc.ca/dataset/bc-public-libraries-statistics-2002-present
Accessed October 30, 2026
- Open Government Licence–British Columbia
Open Government Licence–British Columbia: source-information attribution and reuse basis, not government endorsement, measurement validation or a blanket article licence. Accessed 2026-10-30. https://www2.gov.bc.ca/gov/content/data/policy-standards/data-policies/open-data/open-government-licence-bc
Accessed October 30, 2026
Cite & reuse this study
Alisson Bento. What BC’s Library Space Fields Can—and Cannot—Say About Seating. 2026, original research. https://alissonbento.com/research/bc-reported-public-space-seating-2024/
Contains information licensed under the Open Government Licence–British Columbia. Source information is attributed to the Government of British Columbia, BC Public Libraries Statistics and the linked 2021 Annual Survey Questions. Original article text and calculations are attributed to Alisson Bento. No government endorsement or rights to official marks, personal information or third-party works are implied. This source attribution does not establish a blanket licence for the article or certify reported measurements. The bundle contains selected factual system-level values, aggregates, code and explanations, not complete multi-year source workbooks or private records.
Corrections or editorial questions