
Which market does a Canadian publishing headline describe?
A sales increase reported by publishers in Canada does not necessarily describe an increase among their customers in Canada. Publisher location and customer location are different parts of the same transaction. Keeping them separate changes how a reader interprets an international ebook headline: growth in a national industry can be concentrated in sales outside its home customer market.
Statistics Canada’s release of 5 February 2026 already states that total ebook sales increased about 15.0% between 2022 and 2024, while sales of ebooks in Canada increased about 0.6%. Those are the agency’s published findings. This article’s additional contribution is a reproducible calculation of the implied outside-Canada component, its contribution to the total change, and a matched comparison with print sold online and print not sold online.
The population is the surveyed portion of the Canadian book-publisher industry, which excludes the smallest firms. Amounts are net publisher revenue in nominal Canadian-dollar millions, and 2024 is preliminary. These qualifications apply to every result below. The figures do not measure consumer purchases at retail, books sold, readers, royalties or the earnings of an individual author. They help identify what a revenue headline describes before anyone tries to apply it to a different market.
The subtraction behind the outside-Canada amount
Start with two published ebook values for the same year and industry scope. In 2022, total publisher ebook sales are CAD 326.9 million, while sales in Canada are CAD 198.7 million. Subtracting the Canada-only component leaves CAD 128.2 million. In 2024, the corresponding calculation is CAD 376.0 million minus CAD 199.9 million, leaving CAD 176.1 million.
The remainder is labelled implied outside Canada throughout the article and figures. It is a derived difference of rounded source aggregates, not a separately published ebook-export cell. The word implied explains how the number was obtained; it is not an uncertainty label that can be dropped when the calculation is quoted. Its meaning depends on the source tables covering compatible sales and populations.
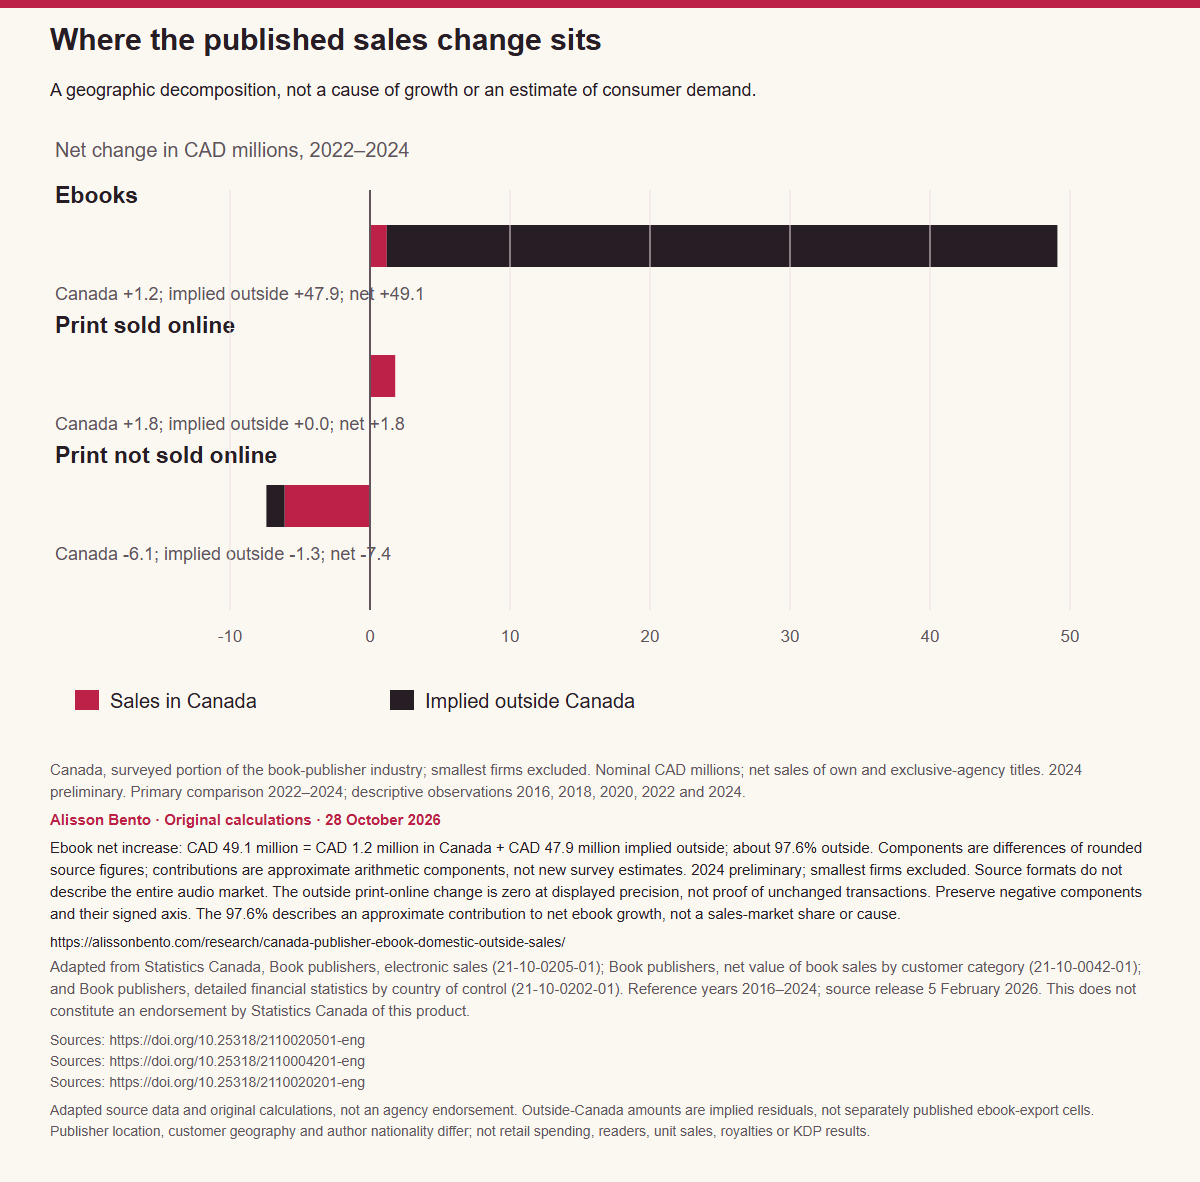
Between the two years, total ebook sales increase by CAD 49.1 million and the Canada-only component increases by CAD 1.2 million. The implied outside component consequently increases by CAD 47.9 million. These are arithmetic parts of the published change in the surveyed portion, with the smallest firms excluded and preliminary 2024 data. They show where the change sits under the matched definitions, without identifying why it happened or which particular businesses contributed.
What approximately 97.6% means
Dividing the implied outside increase of CAD 47.9 million by the total increase of CAD 49.1 million gives approximately 97.6%. The denominator is the net change in ebook revenue between 2022 and 2024. It is not total revenue in either year, and it is not the number of customers. This is an arithmetic attribution of the increase for the surveyed publisher industry; 2024 remains preliminary.
The calculation can be described as an implied outside-Canada contribution to the change. It should not be described as proof that exports caused growth or that a particular marketing channel succeeded. The tables contain revenue categories and geography, not a design that identifies the effects of promotion, reader preferences, social media, pricing or platform policies. A component of an accounting difference is not a causal explanation.
This distinction also protects against a misleading use of the large percentage. It does not mean that nearly all ebook sales occurred outside Canada. It says that nearly all of the measured net increase falls in the implied outside component. A reader comparing the size of markets should instead inspect the level and share figures; a reader examining changes should use the change table with its different denominator.
The same calculation produces different print patterns
Print sold online provides a useful matched comparison because the source gives both its total and Canada-only revenue. From 2022 to 2024, each increases by CAD 1.8 million. The implied outside-Canada change is therefore CAD 0.0 million at the published precision. That displayed zero does not establish that every transaction outside Canada was unchanged or that no underlying variation occurred below the rounding scale.
For print not sold online, total revenue decreases by CAD 7.4 million. The Canada-only decrease is CAD 6.1 million, and the implied outside decrease is CAD 1.3 million. The decomposition figure keeps both components negative, on the left of the zero axis. Turning those bars into positive magnitudes would lose the direction of change and make the comparison harder to interpret.
All three formats use the same primary period, matched source population and nominal CAD-million units. The 2024 estimates are preliminary and the smallest firms are excluded throughout. This makes the format comparison useful within the analysis, but it does not turn it into evidence that individual consumers switched between print and ebooks. The print and ebook calculations are parts of one geographic decomposition, rather than separate studies of consumer format preference.
Why these totals can be compared
The total-format values come from Statistics Canada’s Book publishers, electronic sales, Table 21-10-0205-01. The Canada-only values come from Book publishers, net value of book sales by customer category, Table 21-10-0042-01. Both identify the surveyed portion of the same publisher-industry programme and exclude the smallest revenue firms. The domestic table’s note excludes exports, providing an essential geographic distinction.
The actual 2024 questionnaire gives the operational link between them. Its ebook-sales question includes sales in Canada and exports, including sales through other companies and websites. Its Canada-only customer-category question asks for ebook sales through any channel in Canada on the matched net-sales basis. Those definitions support the subtraction. The analysis is not mixing a consumer survey with an industry survey, or subtracting book counts from monetary revenue.
A third product, Book publishers, detailed financial statistics by country of control, Table 21-10-0202-01, supplies all-book totals, Canada sales and explicitly published exports. Across five years, 15 checks compare the matching totals and domestic amounts and reconcile the all-book remainder with that export control within rounding tolerance. The checks support consistency across the tables; they do not constitute an independent audit of Statistics Canada’s collection or transform the ebook remainder into a published export series.
Rounded revenue is not a count of books
The selected published amounts are nominal Canadian-dollar millions, generally rounded to one decimal place. They are net publisher sales, including the stated own and exclusive-agency title scope, rather than consumer spending at retail. The underlying questionnaire asks businesses to report in its specified monetary units; the analysis uses the scale of the published tables and verifies that selected cells are dollars in millions.
Subtracting rounded inputs creates a separate arithmetic limitation. If each published level is rounded to the nearest CAD 0.1 million, a residual level can have up to CAD 0.1 million of rounding uncertainty. Comparing two residual levels can accumulate up to CAD 0.2 million from four rounded inputs. Exact reproduction of the displayed values is therefore compatible with approximate shares and contributions.
An exploratory check added after the main results varies the underlying changes within those rounding assumptions. It places the implied outside contribution at roughly 97.35%–97.76%. This is a post-result arithmetic sensitivity range, not a sampling confidence interval, a survey-error bound or a preregistered result. It does not address response error, imputation, revisions or omitted firms. The article does not reconstruct standard errors, test significance or divide revenue by an assumed book price to invent unit sales.
Reference years, releases and retrieval dates are different
The primary observations are 2022 and 2024, published in the 5 February 2026 release and retrieved on 28 October 2026. The retrieval date records when the evidence was captured; it does not make these 2026 sales. The current release includes revisions to earlier observations, so the comparison uses the revised values together instead of combining an old release with a new one.
The survey allows a calendar year or a qualifying twelve-month fiscal period. The methodology specifies a fiscal period ending from 1 April of the reference year through 31 March of the following year. Consequently, the series is not a monthly sales calendar and cannot isolate a launch week, a seasonal promotion or an event during 2026. A reader needs that reporting-period definition before attaching a narrative to a change.
The longer figure displays 2016, 2018, 2020, 2022 and 2024 from the same current tables as descriptive context. NAICS 511130 was replaced by 513130 starting with reference year 2022. Earlier points are not presented as independently verified unchanged coverage across that classification boundary. Domestic format values for 2014 are unavailable in the source; they are excluded rather than converted into zeros or reconstructed from unrelated totals.
Three figures, three questions
The first figure shows ebook revenue levels: total publisher sales, sales in Canada and the implied outside amount. The derived outside series is dashed so that its status remains visible even when the graphic is shared separately. The five source years provide context, while 2022–2024 remains the primary matched comparison. The chart keeps nominal CAD-million units, surveyed-portion coverage, smallest-firm exclusion and preliminary 2024 status visible.
The second figure asks where the net revenue change sits. Its signed components preserve the positive ebook and online-print changes and the negative changes for print not sold online. The third asks how much of each format’s own total is implied to be outside Canada. Each format has its own denominator; the marks do not compare shares of one common retail market. These are different views of the same matched source observations.
The accompanying table contains all 15 format-year rows, rather than only the headline ebook pair. A separate three-row table retains the full change decomposition, and supporting checks make the all-book reconciliation inspectable. Source-vector identifiers allow a researcher to trace the selected cells. Use the table to check precise quantities and the figures to understand their relationship; neither should be detached from its source definitions and adaptation notice.
How to use the decomposition in reporting
When reading a publishing headline, first identify the business population, customer geography, money unit and period. Then ask whether the quoted percentage describes growth, a share of sales or a share of the change. In this example, those distinctions explain how a substantial total ebook increase can coexist with little change in the Canada-only component without implying a contradiction in the source.
The results describe nominal revenue. They do not adjust for inflation or establish changes in real consumption, affordability, reading frequency or units sold. They also do not identify the outside customers’ individual countries or demonstrate the influence of a particular promotion. An explanation about demand or causality would need additional evidence beyond the two matched revenue tables and their controls.
The original contribution is deliberately bounded: a reproducible residual decomposition and a matched print comparison that make the agency’s already published contrast easier to interpret. Statistics Canada remains the source producer, and Alisson Bento is responsible for these calculations and explanations. The Statistics Canada Open Licence permits accurate adapted reuse under its conditions, including attribution and the required no-endorsement notice. Original calculations do not imply that the agency commissioned or approved this article.
A takeaway with the scope attached
For the surveyed portion of Canadian book publishers, ebook net sales increased CAD 49.1 million between 2022 and preliminary 2024. Sales in Canada increased CAD 1.2 million; subtracting the domestic figures from the corresponding totals implies an outside-Canada increase of CAD 47.9 million, approximately 97.6% of the total change. Amounts are nominal CAD millions, the smallest firms are excluded, and the implied outside value is not a separately published ebook-export statistic. This is arithmetic attribution, not a cause of growth.
Statistics Canada’s 5 February 2026 release already reported total ebook growth of 15.0% versus 0.6% in Canada. Retain that source credit when using the added decomposition, together with the preliminary status, revenue scope and rounded-input limitation. The calculation helps distinguish publisher-industry growth from growth in a home customer market; it does not measure authors’ income, consumer reading or a global ebook market.
One ebook headline, two customer markets
Canadian publishers’ surveyed portion; nominal net sales, CAD millions.
Full chart and source

Scroll horizontally to inspect the chart. ↔
Chart and values
Scroll horizontally to see all columns.
| Reference year | Format and sales channel | Total publisher sales (nominal CAD millions) | Sales in Canada (nominal CAD millions) | Implied outside-Canada sales (nominal CAD millions) | Implied outside share of this format's total sales (%) | Total-sales source vector | Canada-sales source vector | How the residual was obtained | Conditional residual rounding bound (CAD millions) | Part of the primary comparison |
|---|---|---|---|---|---|---|---|---|---|---|
| 2016 | Ebooks | 169.7 | 54.7 | 115.0 | 67.77 | v107640490 | v122615070 | Derived difference of rounded source aggregates | 0.1 | No; descriptive reference year |
| 2016 | Print sold online | 163.1 | 45.4 | 117.7 | 72.16 | v107640489 | v122615069 | Derived difference of rounded source aggregates | 0.1 | No; descriptive reference year |
| 2016 | Print not sold online | 930.2 | 905.5 | 24.7 | 2.66 | v107640491 | v122615059 | Derived difference of rounded source aggregates | 0.1 | No; descriptive reference year |
| 2018 | Ebooks | 218.3 | 150.6 | 67.7 | 31.01 | v107640490 | v122615070 | Derived difference of rounded source aggregates | 0.1 | No; descriptive reference year |
| 2018 | Print sold online | 184.6 | 133.8 | 50.8 | 27.52 | v107640489 | v122615069 | Derived difference of rounded source aggregates | 0.1 | No; descriptive reference year |
| 2018 | Print not sold online | 852.2 | 702.7 | 149.5 | 17.54 | v107640491 | v122615059 | Derived difference of rounded source aggregates | 0.1 | No; descriptive reference year |
| 2020 | Ebooks | 259.7 | 157.4 | 102.3 | 39.39 | v107640490 | v122615070 | Derived difference of rounded source aggregates | 0.1 | No; descriptive reference year |
| 2020 | Print sold online | 193.7 | 145.4 | 48.3 | 24.94 | v107640489 | v122615069 | Derived difference of rounded source aggregates | 0.1 | No; descriptive reference year |
| 2020 | Print not sold online | 780.4 | 630.4 | 150.0 | 19.22 | v107640491 | v122615059 | Derived difference of rounded source aggregates | 0.1 | No; descriptive reference year |
| 2022 | Ebooks | 326.9 | 198.7 | 128.2 | 39.22 | v107640490 | v122615070 | Derived difference of rounded source aggregates | 0.1 | Yes |
| 2022 | Print sold online | 176.8 | 126.3 | 50.5 | 28.56 | v107640489 | v122615069 | Derived difference of rounded source aggregates | 0.1 | Yes |
| 2022 | Print not sold online | 824.4 | 677.3 | 147.1 | 17.84 | v107640491 | v122615059 | Derived difference of rounded source aggregates | 0.1 | Yes |
| 2024 | Ebooks | 376.0 | 199.9 | 176.1 | 46.84 | v107640490 | v122615070 | Derived difference of rounded source aggregates | 0.1 | Yes |
| 2024 | Print sold online | 178.6 | 128.1 | 50.5 | 28.28 | v107640489 | v122615069 | Derived difference of rounded source aggregates | 0.1 | Yes |
| 2024 | Print not sold online | 817.0 | 671.2 | 145.8 | 17.85 | v107640491 | v122615059 | Derived difference of rounded source aggregates | 0.1 | Yes |
Canada, surveyed portion of the book-publisher industry; smallest firms excluded. Nominal CAD millions; net sales of own and exclusive-agency titles. 2024 preliminary. Primary comparison 2022–2024; descriptive observations 2016, 2018, 2020, 2022 and 2024. Preserve source vectors, years, signs and unavailable markers. Outside-Canada values are implied differences; no causal or retail-market inference.

Where the published sales change sits
A geographic decomposition, not a cause of growth or an estimate of consumer demand.
Full chart and source

Scroll horizontally to inspect the chart. ↔
Chart and values
Scroll horizontally to see all columns.
| Format and sales channel | Total change, 2022–2024 (nominal CAD millions) | Change in Canada, 2022–2024 (nominal CAD millions) | Implied outside change, 2022–2024 (nominal CAD millions) | Total revenue growth (%) | Revenue growth in Canada (%) | Implied outside revenue growth (%) | Implied outside share of format sales, 2022 (%) | Implied outside share of format sales, 2024 (%) | Change in implied outside share (percentage points) | Implied outside contribution to net change (%) |
|---|---|---|---|---|---|---|---|---|---|---|
| Ebooks | 49.1 | 1.2 | 47.9 | 15.02 | 0.60 | 37.36 | 39.22 | 46.84 | 7.62 | 97.56 |
| Print sold online | 1.8 | 1.8 | 0.0 | 1.02 | 1.43 | 0.00 | 28.56 | 28.28 | −0.29 | 0.00 |
| Print not sold online | −7.4 | −6.1 | −1.3 | −0.90 | −0.90 | −0.88 | 17.84 | 17.85 | 0.00 | 17.57 |
Canada, surveyed portion of the book-publisher industry; smallest firms excluded. Nominal CAD millions; net sales of own and exclusive-agency titles. 2024 preliminary. Primary comparison 2022–2024; descriptive observations 2016, 2018, 2020, 2022 and 2024. Preserve source vectors, years, signs and unavailable markers. Outside-Canada values are implied differences; no causal or retail-market inference. Contributions use each format's net change as denominator and are arithmetic, not causal. Preserve the negative print-not-online components. Zero for online-print outside change is zero at published precision.
Ebook growth changes the destination mix
Implied outside-Canada share of each format’s own total publisher sales.
Full chart and source

Scroll horizontally to inspect the chart. ↔
Chart and values
Scroll horizontally to see all columns.
| Format and sales channel | Total change, 2022–2024 (nominal CAD millions) | Change in Canada, 2022–2024 (nominal CAD millions) | Implied outside change, 2022–2024 (nominal CAD millions) | Total revenue growth (%) | Revenue growth in Canada (%) | Implied outside revenue growth (%) | Implied outside share of format sales, 2022 (%) | Implied outside share of format sales, 2024 (%) | Change in implied outside share (percentage points) | Implied outside contribution to net change (%) |
|---|---|---|---|---|---|---|---|---|---|---|
| Ebooks | 49.1 | 1.2 | 47.9 | 15.02 | 0.60 | 37.36 | 39.22 | 46.84 | 7.62 | 97.56 |
| Print sold online | 1.8 | 1.8 | 0.0 | 1.02 | 1.43 | 0.00 | 28.56 | 28.28 | −0.29 | 0.00 |
| Print not sold online | −7.4 | −6.1 | −1.3 | −0.90 | −0.90 | −0.88 | 17.84 | 17.85 | 0.00 | 17.57 |
Canada, surveyed portion of the book-publisher industry; smallest firms excluded. Nominal CAD millions; net sales of own and exclusive-agency titles. 2024 preliminary. Primary comparison 2022–2024; descriptive observations 2016, 2018, 2020, 2022 and 2024. Preserve source vectors, years, signs and unavailable markers. Outside-Canada values are implied differences; no causal or retail-market inference. Contributions use each format's net change as denominator and are arithmetic, not causal. Preserve the negative print-not-online components. Zero for online-print outside change is zero at published precision.

Data & downloads
Scroll horizontally to see all columns.
| Reference year | Format and sales channel | Total publisher sales (nominal CAD millions) | Sales in Canada (nominal CAD millions) | Implied outside-Canada sales (nominal CAD millions) | Implied outside share of this format's total sales (%) | Total-sales source vector | Canada-sales source vector | How the residual was obtained | Conditional residual rounding bound (CAD millions) | Part of the primary comparison |
|---|---|---|---|---|---|---|---|---|---|---|
| 2016 | Ebooks | 169.7 | 54.7 | 115.0 | 67.77 | v107640490 | v122615070 | Derived difference of rounded source aggregates | 0.1 | No; descriptive reference year |
| 2016 | Print sold online | 163.1 | 45.4 | 117.7 | 72.16 | v107640489 | v122615069 | Derived difference of rounded source aggregates | 0.1 | No; descriptive reference year |
| 2016 | Print not sold online | 930.2 | 905.5 | 24.7 | 2.66 | v107640491 | v122615059 | Derived difference of rounded source aggregates | 0.1 | No; descriptive reference year |
| 2018 | Ebooks | 218.3 | 150.6 | 67.7 | 31.01 | v107640490 | v122615070 | Derived difference of rounded source aggregates | 0.1 | No; descriptive reference year |
| 2018 | Print sold online | 184.6 | 133.8 | 50.8 | 27.52 | v107640489 | v122615069 | Derived difference of rounded source aggregates | 0.1 | No; descriptive reference year |
| 2018 | Print not sold online | 852.2 | 702.7 | 149.5 | 17.54 | v107640491 | v122615059 | Derived difference of rounded source aggregates | 0.1 | No; descriptive reference year |
| 2020 | Ebooks | 259.7 | 157.4 | 102.3 | 39.39 | v107640490 | v122615070 | Derived difference of rounded source aggregates | 0.1 | No; descriptive reference year |
| 2020 | Print sold online | 193.7 | 145.4 | 48.3 | 24.94 | v107640489 | v122615069 | Derived difference of rounded source aggregates | 0.1 | No; descriptive reference year |
| 2020 | Print not sold online | 780.4 | 630.4 | 150.0 | 19.22 | v107640491 | v122615059 | Derived difference of rounded source aggregates | 0.1 | No; descriptive reference year |
| 2022 | Ebooks | 326.9 | 198.7 | 128.2 | 39.22 | v107640490 | v122615070 | Derived difference of rounded source aggregates | 0.1 | Yes |
| 2022 | Print sold online | 176.8 | 126.3 | 50.5 | 28.56 | v107640489 | v122615069 | Derived difference of rounded source aggregates | 0.1 | Yes |
| 2022 | Print not sold online | 824.4 | 677.3 | 147.1 | 17.84 | v107640491 | v122615059 | Derived difference of rounded source aggregates | 0.1 | Yes |
| 2024 | Ebooks | 376.0 | 199.9 | 176.1 | 46.84 | v107640490 | v122615070 | Derived difference of rounded source aggregates | 0.1 | Yes |
| 2024 | Print sold online | 178.6 | 128.1 | 50.5 | 28.28 | v107640489 | v122615069 | Derived difference of rounded source aggregates | 0.1 | Yes |
| 2024 | Print not sold online | 817.0 | 671.2 | 145.8 | 17.85 | v107640491 | v122615059 | Derived difference of rounded source aggregates | 0.1 | Yes |
Canada, surveyed portion of the book-publisher industry; smallest firms excluded. Nominal CAD millions; net sales of own and exclusive-agency titles. 2024 preliminary. Primary comparison 2022–2024; descriptive observations 2016, 2018, 2020, 2022 and 2024. Preserve source vectors, years, signs and unavailable markers. Outside-Canada values are implied differences; no causal or retail-market inference.
Scroll horizontally to see all columns.
| Format and sales channel | Total change, 2022–2024 (nominal CAD millions) | Change in Canada, 2022–2024 (nominal CAD millions) | Implied outside change, 2022–2024 (nominal CAD millions) | Total revenue growth (%) | Revenue growth in Canada (%) | Implied outside revenue growth (%) | Implied outside share of format sales, 2022 (%) | Implied outside share of format sales, 2024 (%) | Change in implied outside share (percentage points) | Implied outside contribution to net change (%) |
|---|---|---|---|---|---|---|---|---|---|---|
| Ebooks | 49.1 | 1.2 | 47.9 | 15.02 | 0.60 | 37.36 | 39.22 | 46.84 | 7.62 | 97.56 |
| Print sold online | 1.8 | 1.8 | 0.0 | 1.02 | 1.43 | 0.00 | 28.56 | 28.28 | −0.29 | 0.00 |
| Print not sold online | −7.4 | −6.1 | −1.3 | −0.90 | −0.90 | −0.88 | 17.84 | 17.85 | 0.00 | 17.57 |
Canada, surveyed portion of the book-publisher industry; smallest firms excluded. Nominal CAD millions; net sales of own and exclusive-agency titles. 2024 preliminary. Primary comparison 2022–2024; descriptive observations 2016, 2018, 2020, 2022 and 2024. Preserve source vectors, years, signs and unavailable markers. Outside-Canada values are implied differences; no causal or retail-market inference. Contributions use each format's net change as denominator and are arithmetic, not causal. Preserve the negative print-not-online components. Zero for online-print outside change is zero at published precision.
Scroll horizontally to see all columns.
| Reference year | Compatibility check | Difference (nominal CAD millions) | Passed the stated tolerance |
|---|---|---|---|
| 2016 | Total-sales agreement across source tables | 0.0 | Passed |
| 2016 | Canada-sales agreement across source tables | 0.0 | Passed |
| 2016 | All-book residual versus published all-book exports | 0.0 | Passed |
| 2018 | Total-sales agreement across source tables | 0.0 | Passed |
| 2018 | Canada-sales agreement across source tables | 0.0 | Passed |
| 2018 | All-book residual versus published all-book exports | 0.0 | Passed |
| 2020 | Total-sales agreement across source tables | 0.0 | Passed |
| 2020 | Canada-sales agreement across source tables | 0.0 | Passed |
| 2020 | All-book residual versus published all-book exports | 0.1 | Passed |
| 2022 | Total-sales agreement across source tables | 0.0 | Passed |
| 2022 | Canada-sales agreement across source tables | 0.0 | Passed |
| 2022 | All-book residual versus published all-book exports | 0.0 | Passed |
| 2024 | Total-sales agreement across source tables | 0.0 | Passed |
| 2024 | Canada-sales agreement across source tables | 0.0 | Passed |
| 2024 | All-book residual versus published all-book exports | 0.0 | Passed |
Canada, surveyed portion of the book-publisher industry; smallest firms excluded. Nominal CAD millions; net sales of own and exclusive-agency titles. 2024 preliminary. Primary comparison 2022–2024; descriptive observations 2016, 2018, 2020, 2022 and 2024. Preserve source vectors, years, signs and unavailable markers. Outside-Canada values are implied differences; no causal or retail-market inference. The 15 checks support compatibility across published tables; they are not an independent audit of the source survey.
Scroll horizontally to see all columns.
| Reference year | Source geography | Net book-sales customer category | Published value (nominal CAD millions) | Source availability marker | Source vector |
|---|---|---|---|---|---|
| 2014 | Canada | Total print sales not made online | — | Not available in the source; not zero | v122615059 |
| 2014 | Canada | Total online sales of print books | — | Not available in the source; not zero | v122615069 |
| 2014 | Canada | Total ebook sales | — | Not available in the source; not zero | v122615070 |
Canada, surveyed portion of the book-publisher industry; smallest firms excluded. Nominal CAD millions; net sales of own and exclusive-agency titles. 2024 preliminary. Primary comparison 2022–2024; descriptive observations 2016, 2018, 2020, 2022 and 2024. Preserve source vectors, years, signs and unavailable markers. Outside-Canada values are implied differences; no causal or retail-market inference. These three 2014 Canada-only format values are excluded from the analysis because the source cells are unavailable. Blank values and the original availability markers do not mean zero sales.
Scroll horizontally to see all columns.
| Type of sensitivity check | Conditional rounding assumption | Lower implied outside contribution (%) | Upper implied outside contribution (%) |
|---|---|---|---|
| Post-result worst-case arithmetic rounding sensitivity, not confidence interval or preregistered analysis | Each published source level rounded to the nearest CAD 0.1 million; each temporal difference within CAD 0.1 million | 97.35 | 97.76 |
Canada, surveyed portion of the book-publisher industry; smallest firms excluded. Nominal CAD millions; net sales of own and exclusive-agency titles. 2024 preliminary. Primary comparison 2022–2024; descriptive observations 2016, 2018, 2020, 2022 and 2024. Post-result rounding sensitivity under nearest CAD 0.1 million source-rounding assumption; not a sampling confidence interval.
Evidence & method
How we calculated it
- Use the approved frozen Statistics Canada source release of 5 February 2026, retrieved on 28 October 2026. The primary comparison is reference years 2022 and 2024; 2016, 2018 and 2020 provide descriptive context from the same release. Use revised earlier values together with preliminary 2024 values rather than mixing releases.
- Select Canada totals for the surveyed portion of the book-publisher industry, excluding the smallest firms. Read total ebook, online-print and other-print revenue from Table 21-10-0205-01 and the matching Canada-only categories from Table 21-10-0042-01. Retain source-vector identifiers, source units and the three distinct format categories.
- Check the actual 2024 questionnaire and source programme definitions before subtracting. Total ebook sales include Canada and exports, including sales through other companies and websites; the domestic customer-category question covers ebook sales through any channel in Canada. Both concern the specified net-sales scope for own and exclusive-agency titles. Publisher location, country of control and author nationality remain separate concepts.
- For each of 15 format-year observations, calculate implied outside-Canada sales as total publisher sales minus sales in Canada. Calculate the implied outside share by dividing that residual by the same format and year total and multiplying by 100. Retain the published CAD-million scale and the full derived values in the downloadable tables.
- For each format, subtract 2022 levels from 2024 levels. The total change equals the domestic change plus the implied outside change. For ebooks, divide the implied outside change by the total change to obtain its arithmetic contribution. Compare destination shares using percentage points; calculate revenue growth relative to the corresponding 2022 revenue level.
- Check all-book controls against Table 21-10-0202-01. Fifteen cross-table checks across five years compare totals and domestic values and reconcile the all-book residual with explicitly published all-book exports within rounding tolerance. These checks support scope compatibility, not an independent audit of the agency survey. They do not create a published ebook-export statistic.
- Treat source rounding separately from sampling uncertainty. Under rounding to the nearest CAD 0.1 million, two rounded inputs allow up to CAD 0.1 million of residual-level uncertainty and four allow up to CAD 0.2 million in a two-year residual change. The later exploratory sensitivity calculation gives approximately 97.35%–97.76% for the outside contribution; it is not a confidence interval or a preregistered result.
- The source-motivated analysis plan was recorded after reading the agency release and headline rows, before acquiring the domestic data and calculating the decomposition. It is not presented as preregistration. Reproduction uses the supplied code, selected source identifiers, full derived tables and documented assumptions. No inflation adjustment, standard-error reconstruction or unit-sales estimate is performed.
What the data cannot tell us
- The surveyed portion excludes the smallest publisher firms. It does not represent all authors, self-publishers, platform sellers or retail purchases, and the tables do not identify particular retailers, genres or authors.
- 2024 is preliminary. The source includes revisions to earlier observations. Publication and retrieval in 2026 do not make these 2026 sales; calendar or qualifying twelve-month fiscal reporting periods apply.
- Amounts are nominal net publisher revenue in CAD millions, not inflation-adjusted consumption, book counts, readership, royalties, income or affordability.
- Outside-Canada format amounts are implied differences of rounded aggregates. They are not separately published ebook-export cells, do not identify individual destination countries and do not establish a cause of growth.
- Printed zeros reflect the published precision. The rounding sensitivity is conditional arithmetic, not a bound on survey error. Response error, imputation and future revisions are not captured by that range.
- The NAICS industry code changes from 511130 to 513130 from reference year 2022. Older points are descriptive; unchanged coverage across the boundary has not been independently established. Unavailable 2014 domestic format cells are excluded, not zero.
- The all-book control reconciliation supports comparisons across published tables. It does not validate each original business response or establish statistical significance for any change.
Original sources
- Statistics Canada, Book publishers, electronic sales (21-10-0205-01)
Book publishers, electronic sales (21-10-0205-01): total revenue by selected format. https://doi.org/10.25318/2110020501-eng Adapted from Statistics Canada, Book publishers, electronic sales (21-10-0205-01); Book publishers, net value of book sales by customer category (21-10-0042-01); and Book publishers, detailed financial statistics by country of control (21-10-0202-01). Reference years 2016–2024; source release 5 February 2026. This does not constitute an endorsement by Statistics Canada of this product. Original calculations and explanatory analysis: Alisson Bento. Canada, surveyed portion of the book-publisher industry; smallest firms excluded. 2024 preliminary. Nominal CAD millions. Outside-Canada figures are derived differences of rounded aggregates, not separately published ebook-export cells.
Accessed October 28, 2026
- Statistics Canada, Book publishers, net value of book sales by customer category (21-10-0042-01)
Book publishers, net value of book sales by customer category (21-10-0042-01): matching sales in Canada, excluding exports. https://doi.org/10.25318/2110004201-eng
Accessed October 28, 2026
- Statistics Canada, Book publishers, detailed financial statistics by country of control (21-10-0202-01)
Book publishers, detailed financial statistics by country of control (21-10-0202-01): all-book total, domestic and export controls. https://doi.org/10.25318/2110020201-eng
Accessed October 28, 2026
- Statistics Canada, Book publishing industry, 2024 (5 February 2026)
Statistics Canada, Book publishers, 2024, released 5 February 2026: the agency already reported total ebook growth of 15.0% and Canada-only growth of 0.6%. The present contribution is the residual decomposition and matched print comparison. https://www150.statcan.gc.ca/n1/daily-quotidien/260205/dq260205b-eng.htm
Accessed October 28, 2026
- Statistics Canada, Survey of Service Industries: Book Publishers, record 3105
Statistics Canada, Book Publishers survey programme, record 3105: population, coverage, reporting-period and methodology context. https://www23.statcan.gc.ca/imdb/p2SV.pl?Function=getSurvey&SDDS=3105
Accessed October 28, 2026
- Statistics Canada, Book Publishers 2024 questionnaire
Statistics Canada, 2024 questionnaire for Book Publishers: own and exclusive-agency titles, net sales, all-geography ebook sales and Canada-only customer channels. https://www.statcan.gc.ca/en/statistical-programs/instrument/3105_Q4_V4
Accessed October 28, 2026
- Statistics Canada Open Licence
Statistics Canada Open Licence: adapted reuse remains subject to accurate source attribution and the required no-endorsement notice. https://www.statcan.gc.ca/en/terms-conditions/open-licence
Accessed October 28, 2026
Cite & reuse this study
Alisson Bento. Canadian publisher ebook growth: sales in Canada and the implied outside share. Primary reference years 2022–2024; descriptive years 2016–2024. Adapted from Statistics Canada source release of 5 February 2026, retrieved 28 October 2026. https://alissonbento.com/research/canada-publisher-ebook-domestic-outside-sales/
Original analysis, expression and arrangement by Alisson Bento are licensed under CC BY 4.0, https://creativecommons.org/licenses/by/4.0/; original code uses the MIT licence in CODE-LICENSE.txt. Source data remain subject to the Statistics Canada Open Licence, https://www.statcan.gc.ca/en/terms-conditions/open-licence. These original-work licences do not replace source acknowledgement, accuracy, no-endorsement or other source conditions. Keep source-and-reuse-notice.txt with reused data, retain the complete adapted-from notice on value-added products, credit the original calculations and identify changes. Preserve the surveyed portion, smallest-firm exclusion, nominal units, implied-residual status, preliminary 2024 data, reference and release dates, unavailable 2014 cells and the distinction between rounding sensitivity and sampling uncertainty. Public downloads contain original calculations, structured derived tables, code and explanatory documentation. Raw source HTML and ZIP files, agency logos, confidential records and individual records are excluded. This does not constitute an endorsement by Statistics Canada of this product.
Corrections or editorial questions