
A shared return needs an explicit denominator
A library expenditure total and an enrollment figure can carry the same institutional identifier while describing different reporting sets. A university may submit library data for itself and another institution, yet have its own published enrollment row. Dividing those two fields is an easy spreadsheet operation. Before interpreting the result, the reader needs to establish whose expenditure the numerator includes and which enrollment records the denominator represents. The identifier joins the rows; the component definitions determine whether their coverage matches.
This analysis traces five finite, two-institution cases in final or revised IPEDS files. In each case, it holds the library-reporting parent's published expense total constant and compares two constructed denominators: the FTE row at the parent's identifier and the combined FTE of the two explicitly covered institutions. The resulting ratio reductions range from 3.47% to 79.07%. That range describes these five accounting comparisons. It does not estimate a national error rate or demonstrate that an official NCES indicator is incorrect.
The useful finding is the variation behind that range. Each selected library return covers two institutions, but adding the second institution expands the enrollment denominator by very different amounts. The source's allocation entries also differ from the enrollment proportions. Following all five cases therefore reveals decisions that a simple institution-to-institution join can conceal. It provides a reproducible way to explain a comparison before using it in a library report, a resource table or a discussion of institutional provision.
Follow the component-specific reporting links
The source is the 2023–24 collection of the Integrated Postsecondary Education Data System, using revised Academic Libraries and instructional-activity files. The directory and response-status files each contain 6,163 unique institutional identifiers, UNITID, with identical identifier sets. The revised library file has 3,696 rows and the revised instructional-activity file has 5,959. These are different component frames. Their differing row totals do not authorize treating an absent record as a zero or assuming that every component has the same reporting unit.
FLAGS2023 explicitly identifies library reporting parents through PRCH_AL and connects children to a parent's UNITID through IDX_AL. The inspected files contain 87 such parents and 273 children. Every child links to an existing parent, and the resulting groups are disjoint. No library child has its own raw Academic Libraries row in these selected files. These are documented institutional reporting relationships, rather than groups inferred from similar names, a university system, a postal address or membership of a library consortium.
Enrollment has its own links, PRCH_E12 and IDX_E12, which must be checked separately. Its one consolidated parent-child relationship is outside all 87 explicit library groups in these files. Each of the five retained cases instead uses two distinct institutional enrollment rows. The library field LBRANCH answers another question: it counts branch or independent library outlets at an institution. It is not a list of separate IPEDS institutions and cannot supply the missing membership of a shared institutional return.
Keep the strict five-case frame visible
The selection starts with all 87 explicit library-parent groups, not with unusually high expenditure ratios. A fixed rule requires valid group links, an eligible detailed-expense return, appropriate response-status fields and complete enrollment coverage. It also requires numeric, nonnegative values for undergraduate, graduate and doctoral-professional-practice FTE in each included enrollment row. Five groups satisfy every condition. All five contain two institutions. This is a fully enumerated finite case audit under that strict rule, not a representative sample of academic libraries.
Twelve groups fail the expense-threshold or expense-value gate. Two others lack complete enrollment coverage because four member institutions have no own EFIA row and carry LOCK_E12=-2. These are not observed cross-boundary enrollment consolidations. The separate enrollment hierarchy does not intersect the explicit library groups. The general safeguard against a crossing hierarchy remains important, but inventing such a crossing as the explanation for these actual exclusions would misdescribe the evidence.
The remaining 68 exclusions involve 335 nonnumeric component cells, all carrying A, the source's Not applicable flag. They are not a collection of unknown answers or demonstrated reporting defects. The strict rule leaves them unconverted, rather than reconstructing zeros after inspecting the results. A different, justified applicability model might support another denominator definition, but it would require a separately stated design. These exclusions explain the boundary of the five cases; they are not themselves an estimate of poor metadata or a separate missingness finding.
Understand what the published FTE represents
The retained denominator adds FTEUG, FTEGD and FTEDPP within each enrollment row, then combines distinct reporting units once each. These are published full-time-equivalent measures tied to instructional activity and institutional reporting. They are not counts of unique people, enrolled readers or library visitors. Adding the two institutions' FTE values aligns the institutional reporting set for this accounting exercise; it does not establish the number of individuals entitled to use a library or the amount of service they actually receive.
Across the ten selected institution rows, the 30 component values carry 17 G flags, 12 R flags and one Z flag. The dictionary identifies these as generated from other values, reported and implied zero, respectively. The published undergraduate and graduate fields can fall back to estimated FTE when an institution does not supply its own estimate. Consequently, even a field described as reported cannot be presented here as uniformly direct observation. The numerical Z zero is retained; no A-coded blank is changed to zero.
The library component concerns fiscal year 2023, while the instructional-activity component covers July 2022 through June 2023. The collection labels alone do not prove identical fiscal calendars or a single service cohort. Those period limits remain after the reporting identifiers have been reconciled. The calculations compare source-defined accounting representations across these periods, without claiming an exact count of the people served throughout the expenditure year.
Alaska: a modest expansion despite a shared return
University of Alaska Anchorage reports the library total for a group that also includes Alaska Pacific University. The fixed parent LEXPTOT is 6,128,511. The published FTE row at Anchorage's identifier totals 6,753; Alaska Pacific contributes another 477, producing a matched denominator of 7,230. The expansion factor is about 1.0706. Holding the expenditure numerator fixed, the ratio using the pair's FTE is 6.60% lower than the ratio using only the parent's row.
The allocation entries add another distinction. The parent-supplied PCAL_F values are 100 for Anchorage and zero for Alaska Pacific, summing to 100. Yet the second institution has a positive published FTE total. Those two observations can coexist because an allocation entry and an enrollment measure are different source facts. A zero allocation entry does not establish that the second institution has no enrollment or no library users. This analysis neither explains the allocation decision nor redistributes the expense using it.
For a reader inspecting only the shared-return flag, this case shows why the number of institutional members is insufficient to predict the size of the denominator change. There are two members, but the additional published FTE is small relative to the parent's row. A shared reporting boundary can therefore matter without producing the largest proportional adjustment in a finite comparison. The calculation is informative precisely because it uses the actual second row rather than replacing membership with an assumed equal split.
National: the same allocation pattern, a different scale
The source groups National University with Northcentral University, retaining their institutional names and identifiers as represented in this historical collection. The fixed library total is 3,426,152. National's published FTE row contributes 15,406, and Northcentral's contributes 6,926, bringing the matched denominator to 22,332. The factor is about 1.4496, and the fixed-numerator ratio falls by 31.01%. No claim about the institutions' present organizational arrangements is needed to reproduce this source-period calculation.
Like the Alaska pair, these records carry parent-supplied allocation entries of 100 and zero. The enrollment expansion, however, is much larger. Matching the allocation pattern across the two cases would not reproduce their different denominator factors. The contrast is useful for analysts tempted to read an allocation field as a ready-made student share. Here the source supplies both sets of entries, allowing that proposed substitution to be examined without assuming that either field measures actual library use.
The National pair remains fifth in both descending numerical orderings within the five-case panel. A substantial proportional ratio reduction does not necessarily change position when the other cases also change and begin at different levels. This illustrates why a percentage effect and an ordering effect answer different questions. Neither is a ranking of institutional merit, and the unchanged position does not make the reporting-boundary choice irrelevant to the value being displayed.
Indiana Wesleyan and Notre Dame: larger relative shifts
Indiana Wesleyan University-Marion is the library-reporting parent for a pair including Indiana Wesleyan University-National & Global. Its fixed library total is 2,291,506. The parent's FTE is 2,500; the second institution contributes 7,681, giving 10,181 for the pair. The matched denominator is 4.0724 times the parent's row, and the corresponding ratio is 75.44% lower. The large proportional effect follows from the additional FTE being more than three times the parent's own published row, not from any expenditure change.
The Notre Dame of Maryland University group includes Loyola University Maryland. The parent library amount is 4,539,731. Notre Dame's FTE of 1,323 combines with Loyola's 4,997 to produce 6,320. The resulting factor, about 4.7770, is the largest of these five cases; the fixed-numerator ratio falls by 79.07%. This is a statement about a particular consolidated return and two published enrollment rows. It does not establish that either institution received too much or too little library provision.
The source allocation entries are 25/75 for the Indiana Wesleyan pair and 21/79 for the Notre Dame/Loyola pair. Their numerical resemblance to some enrollment proportions cannot validate an allocation rule or establish its cause. The entries were supplied by parents, while the FTE values arise through a different component. Keeping those origins separate lets the reader trace the large denominator effects without converting a coincidental numerical relationship into evidence of how money, access or service was actually divided.
Oregon State: the largest FTE total, the smallest effect
Oregon State University is paired with Oregon State University-Cascades Campus. The fixed parent library amount is 15,694,747. The parent's FTE row is 28,790, and Cascades adds 1,035, giving 29,825. This is the largest matched FTE denominator among the five selected groups, but its expansion factor is the smallest, about 1.0359. The resulting ratio reduction is 3.47%. Absolute scale and proportional sensitivity are therefore distinct even within this deliberately small panel.
The parent-supplied allocation entries are 99 and one, again summing to 100. They are retained as provenance, not used as expenditure multipliers. Replacing the parent amount with an allocated amount would change the numerator and answer another question. The present comparison holds that amount constant and asks only what happens when the denominator includes the second explicitly linked institution. That fixed-numerator condition is what makes the five cases comparable as accounting exercises despite their different sizes.
Together with Alaska, Oregon State demonstrates that a two-institution return need not produce a several-fold denominator expansion. Indiana Wesleyan and Notre Dame demonstrate the opposite end of this panel. National lies between them. The observed contrast comes from the actual published FTE relationships inside the documented pairs. It cannot be inferred from the mere existence of a child institution, and it does not license extrapolation to differently structured groups excluded by the strict rule.
Numerical order changes within the same five cases
Using parent-row FTE, the descending ratio order is Notre Dame, Indiana Wesleyan, Alaska Anchorage, Oregon State and National. Using the matched pair denominators, it becomes Alaska Anchorage, Notre Dame, Oregon State, Indiana Wesleyan and National. Four cases change position. These are two orderings of the same five constructed ratios, with every expenditure numerator and the comparison frame held fixed. No institution is added because it happens to alter the result.
Of the ten unordered case pairs, three reverse numerical order and seven retain their strict order. There are no ties in these actual cases; the calculation nevertheless specifies average occupied ranks for exact ties. The ten comparisons are linked because each case appears in several pairs. They are not ten independent observations, and the reversal fraction is not a population probability. Its value is descriptive: it shows that reporting-boundary choices can affect relative presentation as well as the size of an individual ratio.
This ordering exercise should not become a league table of libraries or colleges. Expenditure per published workload equivalent does not measure reading opportunity, service quality, collection suitability, student learning or efficiency. The panel also excludes most explicit library-parent groups under its strict component rule. A reader may use the order changes to question the construction of a comparison, but cannot use them as evidence that the higher-ranked institution offers a better library.
Keep the source trail and arithmetic separate
Release selection matters before any division. The Academic Libraries archive contains an original member and a revised member; the revised member is used. The instructional-activity archive likewise contains a revised member, which supplies the enrollment inputs. The retained index identifies January 2026 revisions for library data and September 2025 revisions for instructional activity, with January 2026 updates for the directory and status files. The original archives and selected members are fingerprinted separately. Those choices keep the analysis tied to a definite source vintage rather than allowing a later download, or a more convenient original value, to alter an individual case without notice.
Response and item flags require similarly careful treatment. The selected parent expenditure totals all carry R, Reported. The eligibility rule also requires the complete/final-lock code and the source's Not applicable code for its listed nonresponse-imputation method. Those conditions describe the published return's status; they do not independently verify the expenditure or certify that every underlying entry was directly observed. Enrollment component flags still include generated values and the one published implied zero. A complete numerical row can therefore be usable under the declared rule without being a set of independently measured people, and a source-coded inapplicable component can remain outside the rule without being judged defective.
The calculations retain exact fractions until display. For National, the denominator factor is 11166/7703, while the percentage ratio reduction is 173150/5583. Rounding these yields about 1.450 and 31.01%, respectively. A roughly 45% expansion of the denominator is not a 45% fall in the ratio: the numerator is divided by the larger quantity. Keeping the exact inputs and both formulas in the downloads makes that distinction inspectable. The same discipline preserves exact ties for the ordering procedure and prevents independently rounded display values from deciding a case's numerical position. It also lets a reader reproduce a summary without treating the chosen number of decimal places as additional observational precision.
Allocation, official indicators and a reviewable conclusion
NCES already provides LEXPTOTF, a library expenditure-per-FTE indicator, and derived files can contain child-campus values produced through allocation. This analysis does not reproduce an official displayed indicator and then declare it wrong. It constructs E/B and E/D directly from specified raw fields, where E is the same consolidated parent amount, B the parent's published FTE row and D the complete selected pair's FTE. No DRVAL values are mixed into either side, and PCAL_F never reallocates the numerator.
For a reader preparing an institutional resource table, the practical checks are specific. Identify the component's reporting parent and every explicitly linked member; check whether the enrollment component uses the same reporting set; preserve generated, reported, implied-zero and inapplicable distinctions; and state the time periods. A row join on UNITID alone cannot perform those checks. The compact downloads expose the five parent amounts and ten underlying institution rows so that the arithmetic can be repeated without redistributing complete source archives.
The resulting contribution is a finite accounting-boundary audit: five traceable pairs, contrasting denominator effects, and a clearly limited ordering sensitivity. Its median factor is about 1.450, with a median ratio reduction of 31.01%, but neither summary estimates a national pattern. The evidence supports explaining how these particular representations change. It stops short of identifying unique people, actual users, an ideal funding allocation or a universally correct expenditure denominator. Keeping that boundary explicit makes the comparison usable without asking it to answer a different question.
Published FTE: parent row and covered pair
IPEDS · Library fiscal year 2023 · FTE 2022–23 · Five finite cases
Full chart and source

Scroll horizontally to inspect the chart. ↔
Chart and values
Scroll horizontally to see all columns.
| Reporting pair | Parent identifier | Other identifier | Fixed parent LEXPTOT | Parent-row FTE | Matched-pair FTE | Additional FTE |
|---|---|---|---|---|---|---|
| Alaska Anchorage + Alaska Pacific | UNITID 102553 | UNITID 102669 | 6,128,511 | 6,753 | 7,230 | 477 |
| National + Northcentral | UNITID 119605 | UNITID 444130 | 3,426,152 | 15,406 | 22,332 | 6,926 |
| Indiana Wesleyan Marion + National & Global | UNITID 151801 | UNITID 488679 | 2,291,506 | 2,500 | 10,181 | 7,681 |
| Notre Dame of Maryland + Loyola Maryland | UNITID 163578 | UNITID 163046 | 4,539,731 | 1,323 | 6,320 | 4,997 |
| Oregon State + Cascades | UNITID 209542 | UNITID 440828 | 15,694,747 | 28,790 | 29,825 | 1,035 |
Final/revised IPEDS collection, five strictly eligible two-institution cases. Fixed LEXPTOT amounts retain source monetary units; currency code was not separately verified from retained documentation. No currency conversion or inflation adjustment. FTE means published workload equivalents, not people or library users. Historical source names and identifiers are retained; no present-day organizational claim.

Same numerator, different ratio
IPEDS · Library fiscal year 2023 · FTE 2022–23 · Five finite cases
Full chart and source
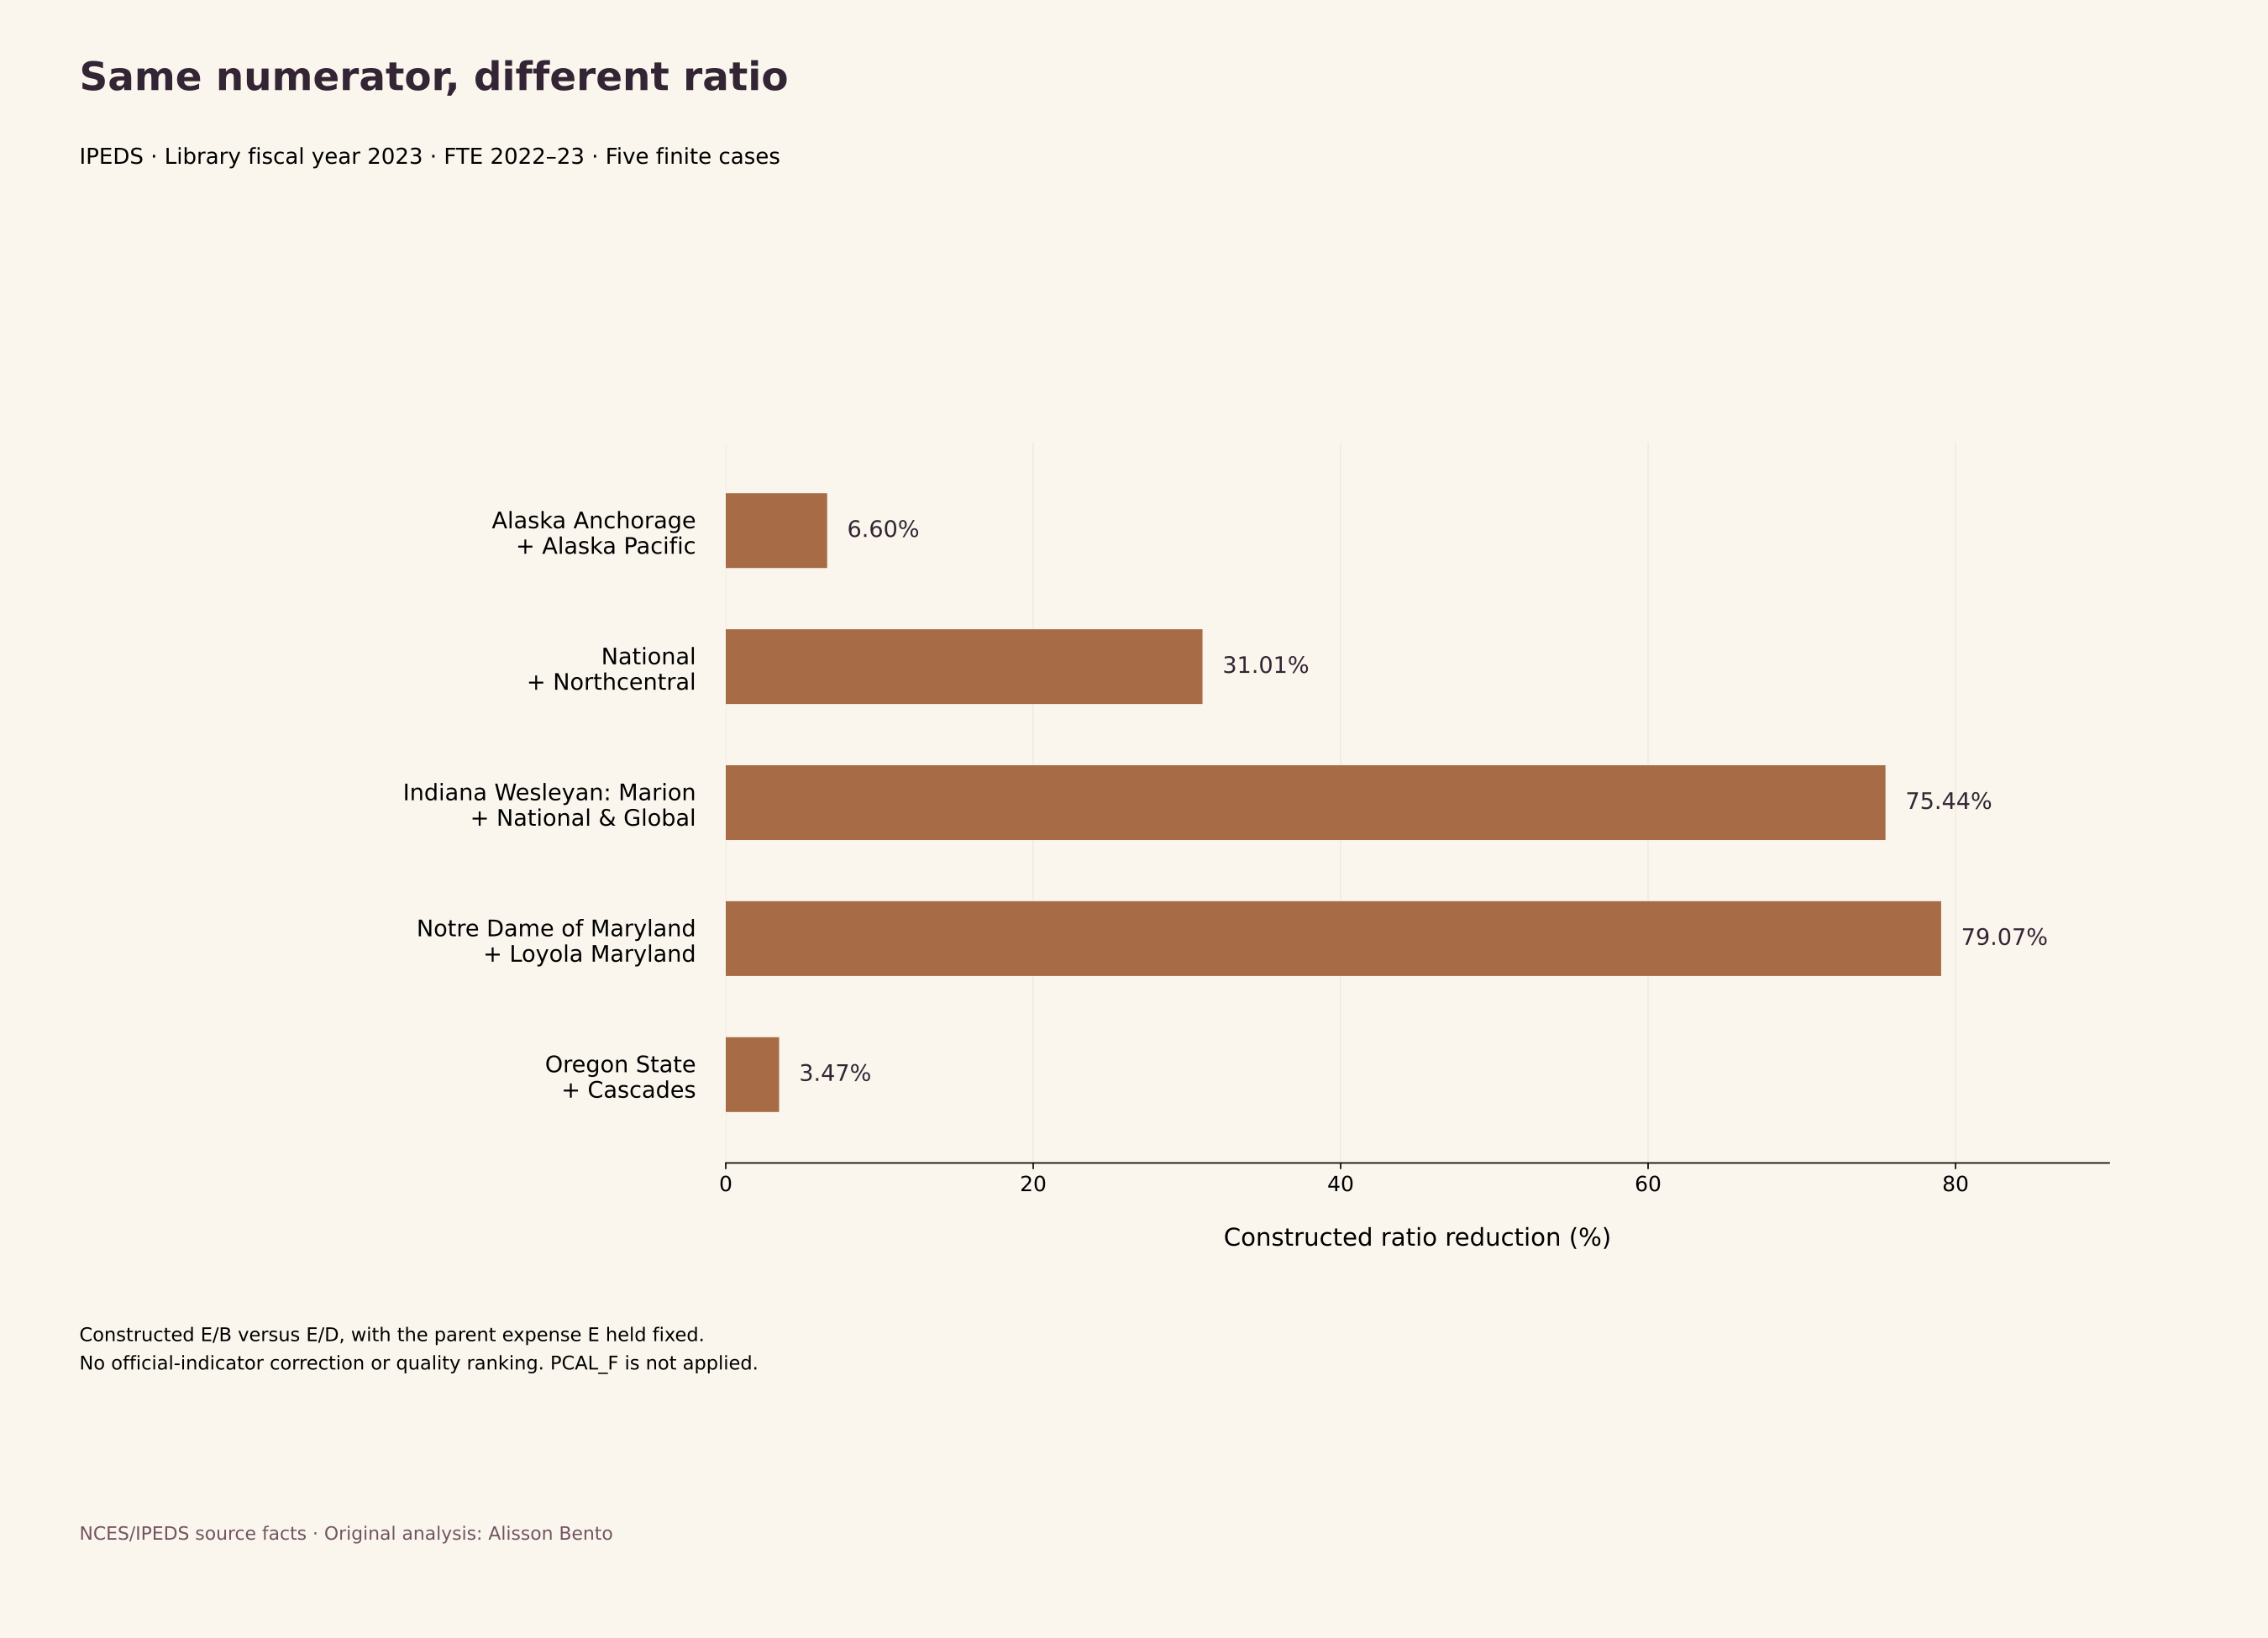
Scroll horizontally to inspect the chart. ↔
Chart and values
Scroll horizontally to see all columns.
| Reporting pair | Parent-row ratio E/B (source monetary units / FTE) | Matched-pair ratio E/D (source monetary units / FTE) | Denominator factor D/B | Ratio reduction (%) | Baseline position | Matched position |
|---|---|---|---|---|---|---|
| Alaska Anchorage + Alaska Pacific | 907.52 | 847.65 | 1.0706 | 6.60 | 3 | 1 |
| National + Northcentral | 222.39 | 153.42 | 1.4496 | 31.01 | 5 | 5 |
| Indiana Wesleyan Marion + National & Global | 916.60 | 225.08 | 4.0724 | 75.44 | 2 | 4 |
| Notre Dame of Maryland + Loyola Maryland | 3431.39 | 718.31 | 4.7770 | 79.07 | 1 | 2 |
| Oregon State + Cascades | 545.15 | 526.23 | 1.0359 | 3.47 | 4 | 3 |
E/B versus E/D, with the same parent monetary amount E. Level ratios use source monetary units per published FTE; currency code was not separately verified from retained documentation. No conversion or inflation adjustment. Ratios round to two decimals, factors to four, reductions to two. Positions are descending numerical order within these five cases only, not institutional quality or an asserted error in an official NCES displayed indicator.

Data & downloads
Scroll horizontally to see all columns.
| Reporting pair | Parent identifier | Other identifier | Fixed parent LEXPTOT | Parent-row FTE | Matched-pair FTE | Additional FTE |
|---|---|---|---|---|---|---|
| Alaska Anchorage + Alaska Pacific | UNITID 102553 | UNITID 102669 | 6,128,511 | 6,753 | 7,230 | 477 |
| National + Northcentral | UNITID 119605 | UNITID 444130 | 3,426,152 | 15,406 | 22,332 | 6,926 |
| Indiana Wesleyan Marion + National & Global | UNITID 151801 | UNITID 488679 | 2,291,506 | 2,500 | 10,181 | 7,681 |
| Notre Dame of Maryland + Loyola Maryland | UNITID 163578 | UNITID 163046 | 4,539,731 | 1,323 | 6,320 | 4,997 |
| Oregon State + Cascades | UNITID 209542 | UNITID 440828 | 15,694,747 | 28,790 | 29,825 | 1,035 |
Final/revised IPEDS collection, five strictly eligible two-institution cases. Fixed LEXPTOT amounts retain source monetary units; currency code was not separately verified from retained documentation. No currency conversion or inflation adjustment. FTE means published workload equivalents, not people or library users. Historical source names and identifiers are retained; no present-day organizational claim.
Scroll horizontally to see all columns.
| Reporting pair | Parent-row ratio E/B (source monetary units / FTE) | Matched-pair ratio E/D (source monetary units / FTE) | Denominator factor D/B | Ratio reduction (%) | Baseline position | Matched position |
|---|---|---|---|---|---|---|
| Alaska Anchorage + Alaska Pacific | 907.52 | 847.65 | 1.0706 | 6.60 | 3 | 1 |
| National + Northcentral | 222.39 | 153.42 | 1.4496 | 31.01 | 5 | 5 |
| Indiana Wesleyan Marion + National & Global | 916.60 | 225.08 | 4.0724 | 75.44 | 2 | 4 |
| Notre Dame of Maryland + Loyola Maryland | 3431.39 | 718.31 | 4.7770 | 79.07 | 1 | 2 |
| Oregon State + Cascades | 545.15 | 526.23 | 1.0359 | 3.47 | 4 | 3 |
E/B versus E/D, with the same parent monetary amount E. Level ratios use source monetary units per published FTE; currency code was not separately verified from retained documentation. No conversion or inflation adjustment. Ratios round to two decimals, factors to four, reductions to two. Positions are descending numerical order within these five cases only, not institutional quality or an asserted error in an official NCES displayed indicator.
Scroll horizontally to see all columns.
| Reporting pair | Parent PCAL_F | Other PCAL_F | Factor sum | Parent share of pair FTE (%) | FTE component flags G / R / Z |
|---|---|---|---|---|---|
| Alaska Anchorage + Alaska Pacific | 100 | 0 | 100 | 93.40 | 4 / 2 / 0 |
| National + Northcentral | 100 | 0 | 100 | 68.99 | 2 / 4 / 0 |
| Indiana Wesleyan Marion + National & Global | 25 | 75 | 100 | 24.56 | 4 / 1 / 1 |
| Notre Dame of Maryland + Loyola Maryland | 21 | 79 | 100 | 20.93 | 4 / 2 / 0 |
| Oregon State + Cascades | 99 | 1 | 100 | 96.53 | 3 / 3 / 0 |
PCAL_F is parent-supplied provenance, in original source units; all five pairs sum to 100. No expense is multiplied or redistributed by these entries. FTE shares are a separate accounting quantity. G=generated from other values; R=reported; Z=implied zero. Component flags cover the six FTE inputs in each pair.
Scroll horizontally to see all columns.
| Stage | Library-parent groups | Source-based explanation |
|---|---|---|
| Starting explicit library-parent frame | 87 | 87 parents and 273 linked children; disjoint groups with no orphan links |
| Expense threshold/value exclusions | 12 | Fail the fixed detailed-expense threshold or valid-value gate |
| Unresolved enrollment coverage | 2 | Four member institutions lack own EFIA rows; LOCK_E12=-2 |
| Strict numeric-component exclusions | 68 | 335 component cells are A=Not applicable; no zero substitution |
| Five retained finite cases | 5 | Ten institution rows; 30 FTE components: G17/R12/Z1 |
The first row is the starting frame. The remaining rows are mutually exclusive dispositions totaling 87. The two coverage failures are absent own EFIA rows, not observed cross-boundary enrollment consolidations. A means Not applicable, not unknown, unanswered or erroneous. No A-coded blank is reconstructed as zero.
Evidence & method
How we calculated it
- Use revised al2023_rv.csv and efia2023_RV.csv, plus the sole FLAGS2023 and HD2023 members, from the exact official linked archives. Original source bytes, dictionaries, index release labels and member hashes are preserved; no release was chosen for a favorable outcome.
- Verify unique nonempty UNITID in all four files, identical FLAGS/directory identifier sets, and explicit library parent/child links. Reconstruct the separate 12-month enrollment hierarchy. No memberships are inferred from names, addresses, branches, systems or consortia.
- Apply the fixed strict rules to 87 library-parent groups: valid complete reporting links, detailed-expense/status gates, complete enrollment coverage and three numeric nonnegative FTE components in every included row. Retain all five eligible pairs. The 2 coverage exclusions are absent own EFIA rows; the 68 component exclusions contain 335 A=Not applicable cells, not unknown answers.
- Use published FTEUG+FTEGD+FTEDPP. The selected 30 components have flags G17/R12/Z1; the five LEXPTOT flags are R. Estimated/generated fallback values remain published workload equivalents, not uniformly direct reports. Preserve the source Z zero, and never reconstruct an A-coded blank as zero.
- Hold each parent raw LEXPTOT amount E fixed. Compare E/B with E/D, using parent-row FTE B and exact matched-pair FTE D. Compute D/B and 100 (1−B/D) with exact rational arithmetic. PCAL_F is provenance only, never an expense multiplier; no DRVAL value is mixed into the calculation.
- Summarize the five fixed cases with inclusive quartiles and exact fractions. For secondary descending numerical order, give ties the average of occupied one-based ranks; no actual ties occur. Compare all 10 linked unordered pairs without treating them as independent observations or assigning inferential confidence intervals.
- The plan was fixed after metadata awareness and before the institutional ratio/rank computation; no claim of complete outcome blindness is made. A separate raw-source implementation verified the graph, selected frame and exact arithmetic. Computational agreement does not establish actual users, service coverage or expenditure quality.
What the data cannot tell us
- LEXPTOT monetary values retain source units. A currency code was not separately verified from retained documentation; no currency conversion or inflation adjustment is applied. Level ratios are source monetary units per published FTE. Relative reductions and denominator factors cancel the fixed monetary numerator.
- The five strictly eligible two-institution cases are a finite accounting panel, not a national sample, an omission-rate estimate or a ranking of colleges or libraries.
- The strict three-numeric-component rule excludes 68 groups with 335 source A=Not applicable cells. This is not evidence of unknown values, poor reporting or the only legitimate alternative FTE definition. No relaxed frame or zero reconstruction is used.
- Two unresolved coverage groups have four members without own EFIA rows and with LOCK_E12=-2. No observed E12 consolidation crosses a library-group boundary in these files.
- Published FTE is an instructional-activity/reporting equivalent, not unique people or actual library users. Generated, reported and implied-zero flags differ; complete/final lock and IMP=-2 do not certify uniformly direct observations.
- Library fiscal year 2023 and instructional activity July 2022–June 2023 are not independently aligned to an exact fiscal calendar or service cohort.
- PCAL_F entries are parent-supplied allocation provenance, not independent user or enrollment shares. Their sum 100 in each selected pair does not authorize multiplying or reallocating the fixed expense numerator.
- The baseline and matched ratios are constructed raw-field comparisons, not a verified before/after correction of NCES displayed LEXPTOTF. No service quality, efficiency, learning, accessibility or college recommendation is inferred.
- Numerical order and pair reversals apply only to the same five cases. The ten case-pair comparisons are linked, not independent observations; names and identifiers refer to the historical source collection, not verified current organizational arrangements.
Original sources
- NCES/IPEDS complete official data-file index
NCES/IPEDS complete official data-file index: Official index for the component archives and dictionaries used in this study. Academic Libraries is revised January 2026; EFIA is revised September 2025; FLAGS and the directory are updated January 2026. https://nces.ed.gov/ipeds/datacenter/DataFiles.aspx?year=-1
Accessed October 30, 2026
- NCES/IPEDS 2023–24 final/revised Access database metadata
NCES/IPEDS 2023–24 final/revised Access database metadata: FLAGS2023 explicitly defines separate Academic Libraries and 12-month enrollment parent/child UNITID links and allocation factors. No institutional membership inferred from names or branches. https://nces.ed.gov/Ipeds/tablefiles/tableDocs/IPEDS202324Tablesdoc.xlsx
Accessed October 30, 2026
- NCES/IPEDS AL2023 official source archive
NCES/IPEDS AL2023 official source archive: Selected source member: al2023_rv.csv. Compact relevant factual inputs and original derived outputs are supplied, not the complete source archive. SHA256 db160c79b15851c4a8d9cdf68c69be821242fc040e5bb29a6394c83278517a17. https://nces.ed.gov/ipeds/complete-data-files/AL2023.zip
Accessed October 30, 2026
- NCES/IPEDS AL2023 official data dictionary
NCES/IPEDS AL2023 official data dictionary: Actual variable definitions, source value labels, applicability and imputation codes checked. SHA256 856fe06d2ccd3f8f9b0409c2962e9a376237aa76ebb70f3361dd00f54de4376c. https://nces.ed.gov/ipeds/complete-data-files/AL2023_Dict.zip
Accessed October 30, 2026
- NCES/IPEDS FLAGS2023 official source archive
NCES/IPEDS FLAGS2023 official source archive: Selected source member: flags2023.csv. Compact relevant factual inputs and original derived outputs are supplied, not the complete source archive. SHA256 77f23ec720ab080284ad48448ccdd819da990efe0e152990054fc0d22e5a601e. https://nces.ed.gov/ipeds/complete-data-files/FLAGS2023.zip
Accessed October 30, 2026
- NCES/IPEDS FLAGS2023 official data dictionary
NCES/IPEDS FLAGS2023 official data dictionary: Actual variable definitions, source value labels, applicability and imputation codes checked. SHA256 3b76f91d6ebf55d8abf32259e73915cbaaf3f553c8482776e30a642b425be75d. https://nces.ed.gov/ipeds/complete-data-files/FLAGS2023_Dict.zip
Accessed October 30, 2026
- NCES/IPEDS EFIA2023 official source archive
NCES/IPEDS EFIA2023 official source archive: Selected source member: efia2023_RV.csv. Compact relevant factual inputs and original derived outputs are supplied, not the complete source archive. SHA256 872bad96a104c0754e80786fa053d135ee32e15f39ae54cfd7b814722f30aa12. https://nces.ed.gov/ipeds/complete-data-files/EFIA2023.zip
Accessed October 30, 2026
- NCES/IPEDS EFIA2023 official data dictionary
NCES/IPEDS EFIA2023 official data dictionary: Actual variable definitions, source value labels, applicability and imputation codes checked. SHA256 dd9a02b9fff4b8c50079fbbd2626af01503cc1845d1b60e81390b935a4536eab. https://nces.ed.gov/ipeds/complete-data-files/EFIA2023_Dict.zip
Accessed October 30, 2026
- NCES/IPEDS HD2023 official source archive
NCES/IPEDS HD2023 official source archive: Selected source member: hd2023.csv. Compact relevant factual inputs and original derived outputs are supplied, not the complete source archive. SHA256 7865dec01a81ec0550aba7d862a49983de8bce45a603aee45af36e6c9692110b. https://nces.ed.gov/ipeds/complete-data-files/HD2023.zip
Accessed October 30, 2026
- NCES/IPEDS HD2023 official data dictionary
NCES/IPEDS HD2023 official data dictionary: Actual variable definitions, source value labels, applicability and imputation codes checked. SHA256 11ec52daa38e39fd78bc0f2c18e8232b3c92e1ac0fdef7bed3f06391424c79c5. https://nces.ed.gov/ipeds/complete-data-files/HD2023_Dict.zip
Accessed October 30, 2026
- US Copyright Office: What Does Copyright Protect?
US Copyright Office: What Does Copyright Protect?: Narrow basis for compact factual numeric outputs and original analysis, not a blanket licence for source compilations or article. Source records/dictionaries/logos are not republished wholesale. https://www.copyright.gov/help/faq/faq-protect.html
Accessed October 30, 2026
Cite & reuse this study
Alisson Bento. One Library Return, Two FTE Rows. 2026, original research. https://alissonbento.com/research/ipeds-library-reporting-boundaries-five-cases-2023/
NCES/IPEDS supplies the public source facts used here. Downloads contain compact selected numeric inputs, institutional identifiers, original calculations/code and source references, not complete original archives or source documentation. The U.S. Copyright Office distinguishes facts from protected expression; that narrow factual-output basis is not a CC0 or blanket licence for NCES content or this complete article. Original analysis and explanation: Alisson Bento. No institutional endorsement or actual-user validation is implied.
Corrections or editorial questions