
A clearer picture of how reading material reaches people
A digital reading percentage describes a format. A free-access percentage describes how someone mainly obtained the material they read. Bringing the answers together shows where those characteristics overlap. It also makes room for combinations that a simple digital-versus-print account can hide: a reader may use both formats, receive digital material as a gift or loan, or buy a new publication in digital form.
This analysis pairs answers from the same people in Mexico’s 2025 Módulo sobre Lectura, or MOLEC. Its central result is a complete profile crossing three reported format combinations with the four main acquisition routes in the questionnaire. The downloadable tables retain the denominators, sample counts, approximate analytical intervals and reliability flags needed to read that profile responsibly.
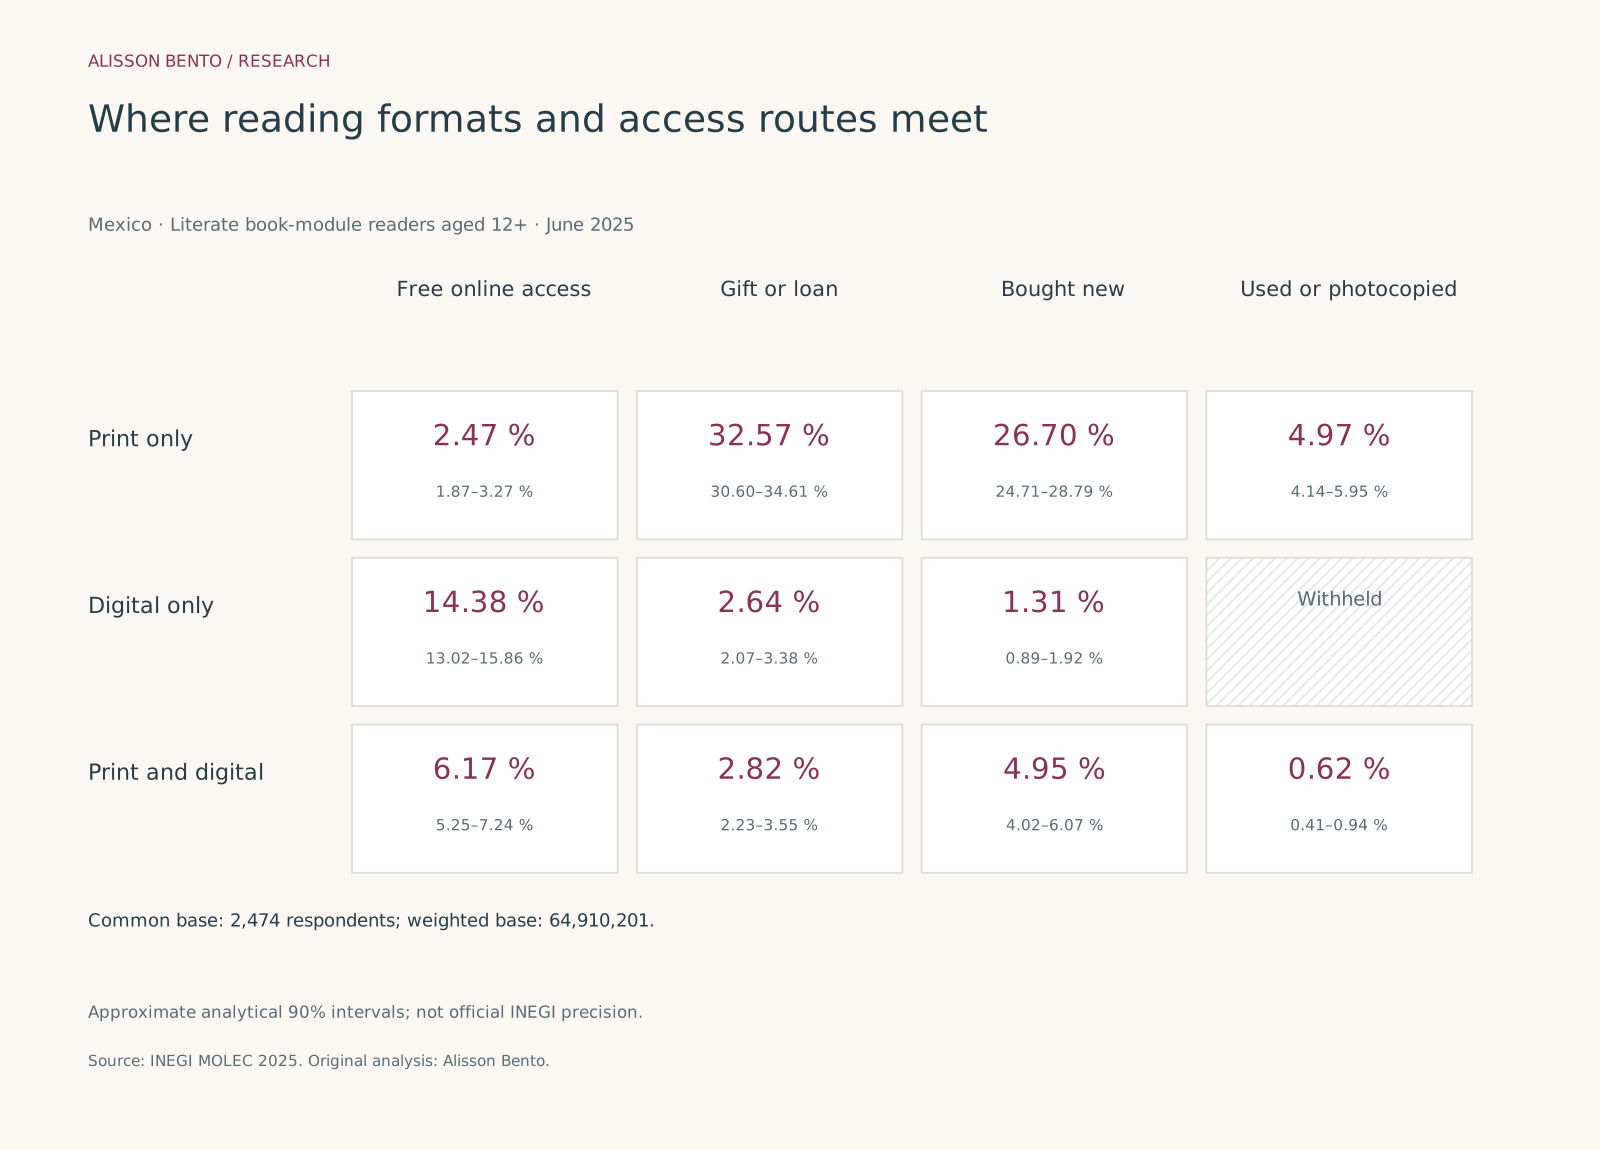
The largest highlighted combination is print-only reading with gifts or loans as the main acquisition route: 32.57% of the eligible book-reader population in the weighted analysis. This is a description of readers’ answers. It does not count the books circulated, identify the people or institutions providing them, or measure their monetary value.
Two questions, two denominators
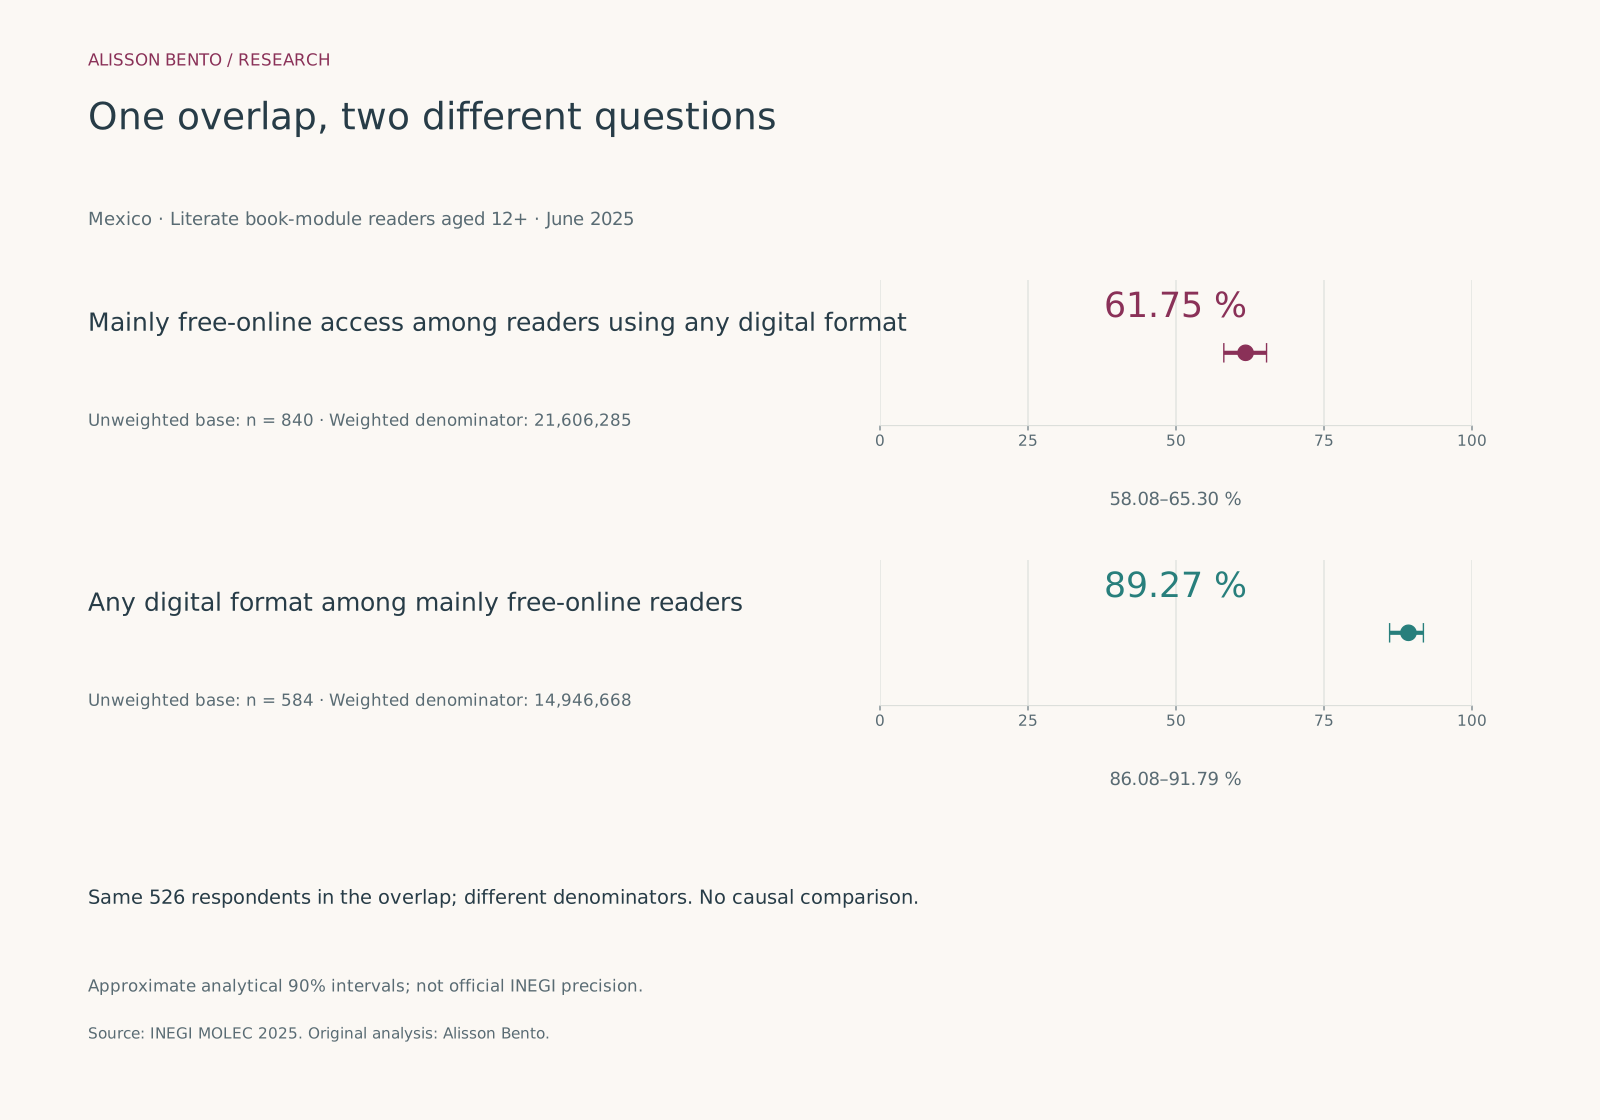
Start by selecting the respondents who reported using a digital format, including those who also read in print. This group contains 840 respondents and has a weighted population estimate of 21,606,285. Within that group, the share reporting free online access as their main acquisition route is 61.75%.
Now select the respondents whose main acquisition route was a free download or free online consultation. This group contains 584 respondents, with a weighted population estimate of 14,946,668. Within this second group, 89.27% reported a digital format. The overlap contains the same 526 sampled respondents in both calculations, but it is divided by a different weighted denominator.
The estimates therefore serve different editorial questions. The first helps describe access routes among digital readers. The second describes formats among readers mainly using free online access. Neither can replace the other in a headline. Subtracting them would not measure an effect of digital reading, a change over time or the proportion of books distributed free.
Which readers the analysis describes
MOLEC’s 2025 fieldwork took place from 2 to 27 June. The redesigned survey covers Mexico nationally, including urban and rural areas, and usual residents aged twelve or over in occupied private dwellings. The book-reading domain here contains 2,474 literate respondents. Their final survey weights expand to an estimated 64,910,201 people; that is a survey estimate rather than a census count.
Eligibility follows the instrument’s direct book question and its verification route. The latter can recover reading of an unfinished book, a manual or a document after an initial negative answer. Keeping that route is necessary to preserve the population defined by the questionnaire. The results are consequently broader than leisure reading, completed books, fiction or commercial book customers.
The full released selected-person file has 4,240 records. People outside the book-reader domain are retained with zero contributions when calculating the working-design variance. This national analysis does not provide an estimate for Mexico City, any individual state or an individual city in the separate 32-city aggregate. The observations remain about 2025 even when the analysis is consulted later.
Three format combinations and four main access routes
The format question records digital and print separately. A respondent can answer yes to either or both. We therefore distinguish print only, digital only, and print together with digital. Combining digital-only readers with those using both formats answers the broader question about any digital reading; it should not be labelled exclusive digital reading.
The acquisition question accepts one answer about the main way the respondent obtained most of the books, manuals or documents read. Its four categories are free download or online consultation; gift or loan; purchase of new material; and purchase of used or photocopied material. Gifts and loans are combined, as are used and photocopied copies. New purchases include paid digital publications.
These definitions prevent a tempting but unsupported breakdown. The gift-or-loan group cannot become a library-borrowing total. The used-or-photocopied group cannot become a second-hand retail market share. Free online access does not identify a platform, establish the legal status of a source or distinguish particular kinds of online service.
How to read the full overlap table
Each cell in the joint table uses the same denominator: all eligible book readers. Its print-only, gift-or-loan cell, for example, accounts for 32.57% of that common population. The table preserves the full set of format and acquisition combinations so readers can see the surrounding pattern instead of treating two highlighted statistics as an exhaustive description.
The companion table changes the perspective to acquisition within each format group. Those rows have different denominators, which are shown alongside the estimates. A percentage of all book readers and a percentage within digital-only readers answer different questions even if their labels mention the same access route. The table captions identify which interpretation applies.
One sparse format–access combination is withheld under the declared reliability rule. Its absence from a numerical display is not evidence that the combination never occurs. The underlying source contains responses; the analysis withholds the estimate because the predeclared sample and precision conditions are not met. Displayed rounded cells should not be forced to total 100% by filling the gap with zero or silently rescaling the others.
A separate profile for readers who include literature
A secondary table describes the main acquisition routes reported by people who said their reading included literature, such as novels, short stories, science fiction or poetry. Among these 1,048 respondents, 40.03% reported new purchases as their main route for the material covered by the book section. The table retains the corresponding profile for readers who did not report literature.
This comparison stays at the person level. A respondent may report several kinds of books, while the acquisition answer concerns the main route for the material overall. The questionnaire does not connect a particular novel to a purchase, gift, loan or free download. It would therefore be inaccurate to describe 40.03% as the share of literary books bought new.
For publishers and reading organizations, the profile offers context for understanding readers beyond a single retail channel. It cannot supply sales volumes, customer conversion, author income or the impact of a distribution programme. Those questions require different observations and, in some cases, a different research design.
What the calculation does
The estimates are ratios of sums of the final selected-person weight, FAC_ELE. The numerator sums the weights of respondents with the stated combination; the denominator sums the weights of the population named in that row. Household weights are not substituted for person weights. All primary fields come from the same selected-person table, so no household join is needed to create the overlap.
Before the new joint estimates were calculated, the analysis rules fixed the population, category coding, denominators, uncertainty methods and numerical-release thresholds. Source and questionnaire margins were already known at that stage; this was not a blinded experiment. The analysis reproduces seven published marginal percentages at their displayed rounding and reconciles the joint profile to the complete eligible base.
The public files provide aggregate results and an offline calculation recipe. They do not redistribute the respondent rows, identification keys or open-text answers. Reproduction uses the separately obtained official source file and its recorded checksum, so a changed source version cannot silently enter the same calculation.
What the approximate intervals cover
The uncertainty calculation uses a declared working approximation to the survey design: final weights are treated as fixed, while the released strata and primary sampling units are retained. The full frame contains 99 strata and 1,201 primary sampling units. One stratum has a single observed unit, so its variance contribution cannot be estimated by the ordinary within-stratum formula.
The primary calculation uses a documented singleton adjustment. Separate sensitivity results use an average contribution from estimable strata and a zero-singleton-component stress test. The latter does not establish that the unit was sampled with certainty. These alternatives make the assumption visible; they are not bounds proving that every plausible uncertainty model is covered.
The displayed intervals are approximate analytical 90% intervals calculated on the logit scale for interior proportions. For the 61.75% estimate, the primary interval is 58.08–65.30%; for 89.27%, it is 86.08–91.79%. They are not official INEGI precision measures or an exact reconstruction of calibration-aware variance. Weight-construction uncertainty and finite-population corrections are not reconstructed, and the intervals do not capture all reporting, recall or nonresponse error.
Why some estimates are withheld
The declared release rule requires an unweighted denominator of at least 100 respondents, at least twenty responses in both the numerator and its complement, and a primary coefficient of variation no greater than 30%. Boundary proportions also require caution rather than a misleading zero-width interval. A large weighted population estimate does not replace an adequate observed sample.
Across the 34 declared estimates, 32 are released numerically and two are withheld. The two withheld estimates describe the same sparse format–access combination under different denominators. This is an analytical-reliability decision, not proof that the source has been formally anonymized or that every future use will protect confidentiality.
No p-values, significance tests or causal effects are reported. Differences between table cells should not be declared statistically significant merely because their separate intervals appear to overlap or not overlap. The analysis provides a descriptive reference with explicit uncertainty choices, rather than a ranking of better access routes or better kinds of readers.
Using the results as a source
A concise citation should retain the population, observation year and denominator. For example: “In an analysis of INEGI’s MOLEC 2025 microdata, 61.75% of literate book readers aged twelve or over who reported any digital format identified free online access as their main acquisition route.” If an interval is included, label it an approximate analytical interval under this study’s stated working design.
INEGI already publishes important acquisition margins and cross-tabulations by characteristics such as sex, reading motive and frequency. The contribution here is the same-respondent format–access profile, its two reverse conditional questions and the accompanying reproducible uncertainty treatment. A bounded reading of prior work does not establish that no one has ever examined a similar question.
Credit INEGI for the source data and Alisson Bento for the original analysis and graphics. The original text and graphics may be reused under CC BY 4.0, and the original code under MIT, with their attribution preserved. These licences do not replace INEGI’s own free-use terms. The analysis and transformations are independent work and do not imply INEGI approval or endorsement.
One overlap, two different questions
Mainly free-online access among readers using any digital format: 61.75%. Any digital format among mainly free-online readers: 89.27%. Same 526 respondents in the overlap; different denominators. No causal comparison. Approximate analytical 90% intervals; not official INEGI precision.
Full chart and source
Scroll horizontally to inspect the chart. ↔
Chart and values
Scroll horizontally to see all columns.
| Conditional question | Weighted share (%) | Lower · Approximate analytical 90% interval (%) | Upper · Approximate analytical 90% interval (%) | Respondents in denominator | Weighted denominator | Respondents in cell |
|---|---|---|---|---|---|---|
| Any digital format among mainly free-online readers | 89.27 | 86.08 | 91.79 | 584 | 14,946,668 | 526 |
| Mainly free-online access among readers using any digital format | 61.75 | 58.08 | 65.30 | 840 | 21,606,285 | 526 |
The same 526 sampled respondents contribute to both numerators; different weighted denominators produce different estimates. Same 526 respondents in the overlap; different denominators. No causal comparison. Approximate analytical 90% intervals; not official INEGI precision.

Where reading formats and access routes meet
Where reading formats and access routes meet. Common base: 2,474 respondents; weighted base: 64,910,201. Approximate analytical 90% intervals; not official INEGI precision. Withheld: analytical-reliability rule.
Full chart and source
Scroll horizontally to inspect the chart. ↔
Chart and values
Scroll horizontally to see all columns.
| Reported format | Main acquisition route | Weighted share (%) | Lower · Approximate analytical 90% interval (%) | Upper · Approximate analytical 90% interval (%) | Respondents in denominator | Respondents in cell |
|---|---|---|---|---|---|---|
| Print only | Free online access | 2.47 | 1.87 | 3.27 | 2,474 | 58 |
| Print only | Gift or loan | 32.57 | 30.60 | 34.61 | 2,474 | 777 |
| Print only | Bought new | 26.70 | 24.71 | 28.79 | 2,474 | 670 |
| Print only | Used or photocopied | 4.97 | 4.14 | 5.95 | 2,474 | 129 |
| Digital only | Free online access | 14.38 | 13.02 | 15.86 | 2,474 | 360 |
| Digital only | Gift or loan | 2.64 | 2.07 | 3.38 | 2,474 | 61 |
| Digital only | Bought new | 1.31 | 0.89 | 1.92 | 2,474 | 35 |
| Digital only | Used or photocopied | Withheld | — | — | 2,474 | <20 |
| Print and digital | Free online access | 6.17 | 5.25 | 7.24 | 2,474 | 166 |
| Print and digital | Gift or loan | 2.82 | 2.23 | 3.55 | 2,474 | 78 |
| Print and digital | Bought new | 4.95 | 4.02 | 6.07 | 2,474 | 110 |
| Print and digital | Used or photocopied | 0.62 | 0.41 | 0.94 | 2,474 | 20 |
One common denominator: all 2,474 eligible book readers. A withheld cell is not zero. Intervals are approximate analytical working-design results. Common base: 2,474 respondents; weighted base: 64,910,201. Approximate analytical 90% intervals; not official INEGI precision.

The access profile changes with the denominator
The access profile changes with the denominator. Approximate analytical 90% intervals; not official INEGI precision. Withheld: analytical-reliability rule.
Full chart and source

Scroll horizontally to inspect the chart. ↔
Chart and values
Scroll horizontally to see all columns.
| Reported format | Main acquisition route | Weighted share (%) | Lower · Approximate analytical 90% interval (%) | Upper · Approximate analytical 90% interval (%) | Respondents in denominator | Respondents in cell |
|---|---|---|---|---|---|---|
| Print only | Free online access | 3.70 | 2.80 | 4.88 | 1,634 | 58 |
| Print only | Gift or loan | 48.83 | 46.11 | 51.54 | 1,634 | 777 |
| Print only | Bought new | 40.02 | 37.21 | 42.91 | 1,634 | 670 |
| Print only | Used or photocopied | 7.45 | 6.22 | 8.89 | 1,634 | 129 |
| Digital only | Free online access | 76.79 | 72.48 | 80.60 | 466 | 360 |
| Digital only | Gift or loan | 14.11 | 11.16 | 17.70 | 466 | 61 |
| Digital only | Bought new | 6.99 | 4.83 | 10.03 | 466 | 35 |
| Digital only | Used or photocopied | Withheld | — | — | 466 | <20 |
| Print and digital | Free online access | 42.41 | 37.07 | 47.93 | 374 | 166 |
| Print and digital | Gift or loan | 19.35 | 15.46 | 23.94 | 374 | 78 |
| Print and digital | Bought new | 33.99 | 28.61 | 39.82 | 374 | 110 |
| Print and digital | Used or photocopied | 4.26 | 2.79 | 6.46 | 374 | 20 |
Each format group has its own denominator. Combined acquisition categories follow the questionnaire. Withheld cells are not silently rescaled. Approximate analytical 90% intervals; not official INEGI precision.

Reusable sharing card
Mainly free-online access among readers using any digital format: 61.75%. Any digital format among mainly free-online readers: 89.27%. Same 526 respondents in the overlap; different denominators. No causal comparison. Approximate analytical 90% intervals; not official INEGI precision.
Full chart and source

Scroll horizontally to inspect the chart. ↔
Chart and values
Scroll horizontally to see all columns.
| Conditional question | Weighted share (%) | Lower · Approximate analytical 90% interval (%) | Upper · Approximate analytical 90% interval (%) | Respondents in denominator | Weighted denominator | Respondents in cell |
|---|---|---|---|---|---|---|
| Any digital format among mainly free-online readers | 89.27 | 86.08 | 91.79 | 584 | 14,946,668 | 526 |
| Mainly free-online access among readers using any digital format | 61.75 | 58.08 | 65.30 | 840 | 21,606,285 | 526 |
The same 526 sampled respondents contribute to both numerators; different weighted denominators produce different estimates. Same 526 respondents in the overlap; different denominators. No causal comparison. Approximate analytical 90% intervals; not official INEGI precision.

Data & downloads
Scroll horizontally to see all columns.
| Reported format | Main acquisition route | Weighted share (%) | Lower · Approximate analytical 90% interval (%) | Upper · Approximate analytical 90% interval (%) | Respondents in denominator | Respondents in cell |
|---|---|---|---|---|---|---|
| Print only | Free online access | 2.47 | 1.87 | 3.27 | 2,474 | 58 |
| Print only | Gift or loan | 32.57 | 30.60 | 34.61 | 2,474 | 777 |
| Print only | Bought new | 26.70 | 24.71 | 28.79 | 2,474 | 670 |
| Print only | Used or photocopied | 4.97 | 4.14 | 5.95 | 2,474 | 129 |
| Digital only | Free online access | 14.38 | 13.02 | 15.86 | 2,474 | 360 |
| Digital only | Gift or loan | 2.64 | 2.07 | 3.38 | 2,474 | 61 |
| Digital only | Bought new | 1.31 | 0.89 | 1.92 | 2,474 | 35 |
| Digital only | Used or photocopied | Withheld | — | — | 2,474 | <20 |
| Print and digital | Free online access | 6.17 | 5.25 | 7.24 | 2,474 | 166 |
| Print and digital | Gift or loan | 2.82 | 2.23 | 3.55 | 2,474 | 78 |
| Print and digital | Bought new | 4.95 | 4.02 | 6.07 | 2,474 | 110 |
| Print and digital | Used or photocopied | 0.62 | 0.41 | 0.94 | 2,474 | 20 |
One common denominator: all 2,474 eligible book readers. A withheld cell is not zero. Intervals are approximate analytical working-design results. Common base: 2,474 respondents; weighted base: 64,910,201. Approximate analytical 90% intervals; not official INEGI precision.
Scroll horizontally to see all columns.
| Reported format | Main acquisition route | Weighted share (%) | Lower · Approximate analytical 90% interval (%) | Upper · Approximate analytical 90% interval (%) | Respondents in denominator | Respondents in cell |
|---|---|---|---|---|---|---|
| Print only | Free online access | 3.70 | 2.80 | 4.88 | 1,634 | 58 |
| Print only | Gift or loan | 48.83 | 46.11 | 51.54 | 1,634 | 777 |
| Print only | Bought new | 40.02 | 37.21 | 42.91 | 1,634 | 670 |
| Print only | Used or photocopied | 7.45 | 6.22 | 8.89 | 1,634 | 129 |
| Digital only | Free online access | 76.79 | 72.48 | 80.60 | 466 | 360 |
| Digital only | Gift or loan | 14.11 | 11.16 | 17.70 | 466 | 61 |
| Digital only | Bought new | 6.99 | 4.83 | 10.03 | 466 | 35 |
| Digital only | Used or photocopied | Withheld | — | — | 466 | <20 |
| Print and digital | Free online access | 42.41 | 37.07 | 47.93 | 374 | 166 |
| Print and digital | Gift or loan | 19.35 | 15.46 | 23.94 | 374 | 78 |
| Print and digital | Bought new | 33.99 | 28.61 | 39.82 | 374 | 110 |
| Print and digital | Used or photocopied | 4.26 | 2.79 | 6.46 | 374 | 20 |
Each format group has its own denominator. Combined acquisition categories follow the questionnaire. Withheld cells are not silently rescaled. Approximate analytical 90% intervals; not official INEGI precision.
Scroll horizontally to see all columns.
| Conditional question | Weighted share (%) | Lower · Approximate analytical 90% interval (%) | Upper · Approximate analytical 90% interval (%) | Respondents in denominator | Weighted denominator | Respondents in cell |
|---|---|---|---|---|---|---|
| Any digital format among mainly free-online readers | 89.27 | 86.08 | 91.79 | 584 | 14,946,668 | 526 |
| Mainly free-online access among readers using any digital format | 61.75 | 58.08 | 65.30 | 840 | 21,606,285 | 526 |
The same 526 sampled respondents contribute to both numerators; different weighted denominators produce different estimates. Same 526 respondents in the overlap; different denominators. No causal comparison. Approximate analytical 90% intervals; not official INEGI precision.
Scroll horizontally to see all columns.
| Reported literature | Main acquisition route | Weighted share (%) | Lower · Approximate analytical 90% interval (%) | Upper · Approximate analytical 90% interval (%) | Respondents in denominator |
|---|---|---|---|---|---|
| Reported literature | Free online access | 20.62 | 18.24 | 23.22 | 1,048 |
| Reported literature | Gift or loan | 32.80 | 29.85 | 35.90 | 1,048 |
| Reported literature | Bought new | 40.03 | 36.92 | 43.23 | 1,048 |
| Reported literature | Used or photocopied | 6.55 | 5.24 | 8.15 | 1,048 |
| Did not report literature | Free online access | 24.85 | 22.53 | 27.33 | 1,426 |
| Did not report literature | Gift or loan | 41.99 | 39.20 | 44.84 | 1,426 |
| Did not report literature | Bought new | 27.61 | 25.09 | 30.27 | 1,426 |
| Did not report literature | Used or photocopied | 5.56 | 4.41 | 6.98 | 1,426 |
Person-level profiles only. No acquisition route is linked to a particular literary title. Approximate analytical 90% intervals; not official INEGI precision.
Scroll horizontally to see all columns.
| Source indicator | Reproduced (%) | Source displayed (%) |
|---|---|---|
| Free online access | 23.03 | 23.0 |
| Gift or loan | 38.03 | 38.0 |
| Bought new | 32.96 | 33.0 |
| Used or photocopied | 5.98 | 6.0 |
| Any digital format | 33.29 | 33.3 |
| Any print format | 81.27 | 81.3 |
| Reported literature | 43.07 | 43.1 |
Reproduced at the source’s displayed rounding. These checks are not new joint findings or official uncertainty estimates.
Scroll horizontally to see all columns.
| Conditional question | Singleton method | SE (percentage points) | Lower · Approximate analytical 90% interval (%) | Upper · Approximate analytical 90% interval (%) |
|---|---|---|---|---|
| Any digital format among mainly free-online readers | Singleton adjust (primary) | 1.7252 | 86.08 | 91.79 |
| Any digital format among mainly free-online readers | Average stratum contribution (sensitivity) | 1.7340 | 86.06 | 91.80 |
| Any digital format among mainly free-online readers | Zero singleton component (stress test; certainty unverified) | 1.7252 | 86.08 | 91.79 |
| Mainly free-online access among readers using any digital format | Singleton adjust (primary) | 2.1975 | 58.08 | 65.30 |
| Mainly free-online access among readers using any digital format | Average stratum contribution (sensitivity) | 2.2082 | 58.06 | 65.31 |
| Mainly free-online access among readers using any digital format | Zero singleton component (stress test; certainty unverified) | 2.1971 | 58.08 | 65.30 |
Approximate analytical 90% intervals under three stated conventions. The zero-component option does not establish certainty sampling. Approximate analytical 90% intervals; not official INEGI precision.
Evidence & method
How we calculated it
- Use the frozen official MOLEC 2025 selected-person file, retain the literacy filter and both book-screening routes, and pair P 5 digital/print answers with the single P 10 main-acquisition answer on the same row.
- Calculate ratios using final FAC_ELE person weights. Keep all 4,240 sampled records and the original 99 strata/1,201 PSUs for variance, with zero scores outside each domain.
- Report a fixed-final-weight, with-replacement ultimate-cluster approximation with singleton adjust as the primary method; disclose average and zero-component sensitivities separately. No official calibration-aware precision or verified certainty claim.
- Use predeclared 90% logit-delta analytical intervals and release estimates only when denominator, cell/complement counts and primary CV pass the stated rule. Preserve withheld cells and all denominators.
What the data cannot tell us
- Person-level retrospective answers about the main route for books, manuals or documents; no copy-, title-, transaction- or genre-specific acquisition linkage.
- Gift/loan and used/photocopied remain combined categories. Free online access identifies neither legal status nor a particular platform or library service.
- National literate-reader domain aged 12+ in private dwellings, June 2025; no city/state estimate, causal claim, historical trend, sales total, savings estimate or reading-quality comparison.
- Intervals are approximate analytical working-design results, not official INEGI uncertainty. Calibration/FPC and uncertainty in constructing final weights are not reconstructed; nonsampling errors remain.
- The singleton sensitivities do not establish actual certainty sampling, unbiased singleton variance, guaranteed coverage or comprehensive robustness.
Original sources
- Official public selected-person microdata ZIP
Official selected-person microdata: TMOLEC, final FAC_ELE weights and released design fields. The frozen source hash is recorded in the downloadable ledger; respondent rows are not redistributed.
Accessed October 28, 2026
- MOLEC 2025 file descriptor
The official file descriptor defines the format indicators, main-acquisition answer, literacy filter and selected-person design fields used in this analysis.
Accessed October 28, 2026
- MOLEC 2025 questionnaire
The questionnaire defines the direct and verification book routes, including manuals/documents, and the combined gift/loan and used/photocopied acquisition categories.
Accessed October 28, 2026
- MOLEC 2025 results
The official results report supplies prior published margins and cross-tabulations. This study’s new format–access joint estimates and analytical intervals are independent transformations, not official INEGI tables.
Accessed October 28, 2026
- MOLEC 2025 RNM metadata
The RNM metadata identify the national urban/rural target aged 12+, fieldwork on 2–27 June 2025 and the source version. Observation dates are distinct from this article’s publication date.
Accessed October 28, 2026
- MOLEC 2025 sample design
INEGI’s sample-design document describes weighting, calibration and ultimate-cluster calculations. This analysis uses an explicitly approximate fixed-final-weight working design and does not reconstruct official precision.
Accessed November 1, 2026
- INEGI free-use terms
INEGI’s free-use terms require source credit, preserved metadata, clear identification of transformations and no implied endorsement. Original source rights remain in force.
Accessed November 1, 2026
- Primary survey package documentation, version 4.5
Primary survey-package documentation, version 4.5, informs the stated singleton and domain conventions. It does not provide official MOLEC precision; its source and manual are not redistributed.
Accessed November 1, 2026
Cite & reuse this study
Alisson Bento. 2026. How free access overlaps with print and digital book reading in Mexico. Original analysis of INEGI MOLEC 2025 microdata. https://alissonbento.com/research/mexico-book-format-main-access-2025/
Source: INEGI. Módulo sobre Lectura (MOLEC) 2025. Bases de datos. Original analysis, text and graphics: Alisson Bento, CC BY 4.0; original code: MIT. The original source remains governed by INEGI’s free-use terms. No INEGI endorsement or approval is implied.
Corrections or editorial questions