
What the records show
A library owns a book, but the borrowing transaction does not always happen under that same library code. In the public file labelled as Pankow’s 2024 circulation data, 50,080 ordinary A-coded events have two different usable numeric codes for the owning and issuing libraries. That is 5.50% of all 911,020 ordinary events in the file. Another 855,057 events have the same code in both fields. The remaining 5,883 cannot be assigned to either relationship under the deliberately strict code rules used here.
Those figures describe recorded relationships between two administrative fields. They do not count readers travelling between districts, books transported in delivery vehicles, successful interlibrary requests, or unique works. The official documentation explains that a medium can be ordered between libraries and borrowed at a different library. The difference between the fields therefore has a real service meaning. A code mismatch nevertheless does not establish what happened physically during a particular transaction.
The distinction matters when someone uses a branch’s activity to describe the reach of its own collection. Counting by owning code answers where the recorded item belongs. Counting by issuing code answers which recorded location processed the event. These are related roles, and the downloadable matrix keeps them separate. Neither role identifies a reader’s home library or address.
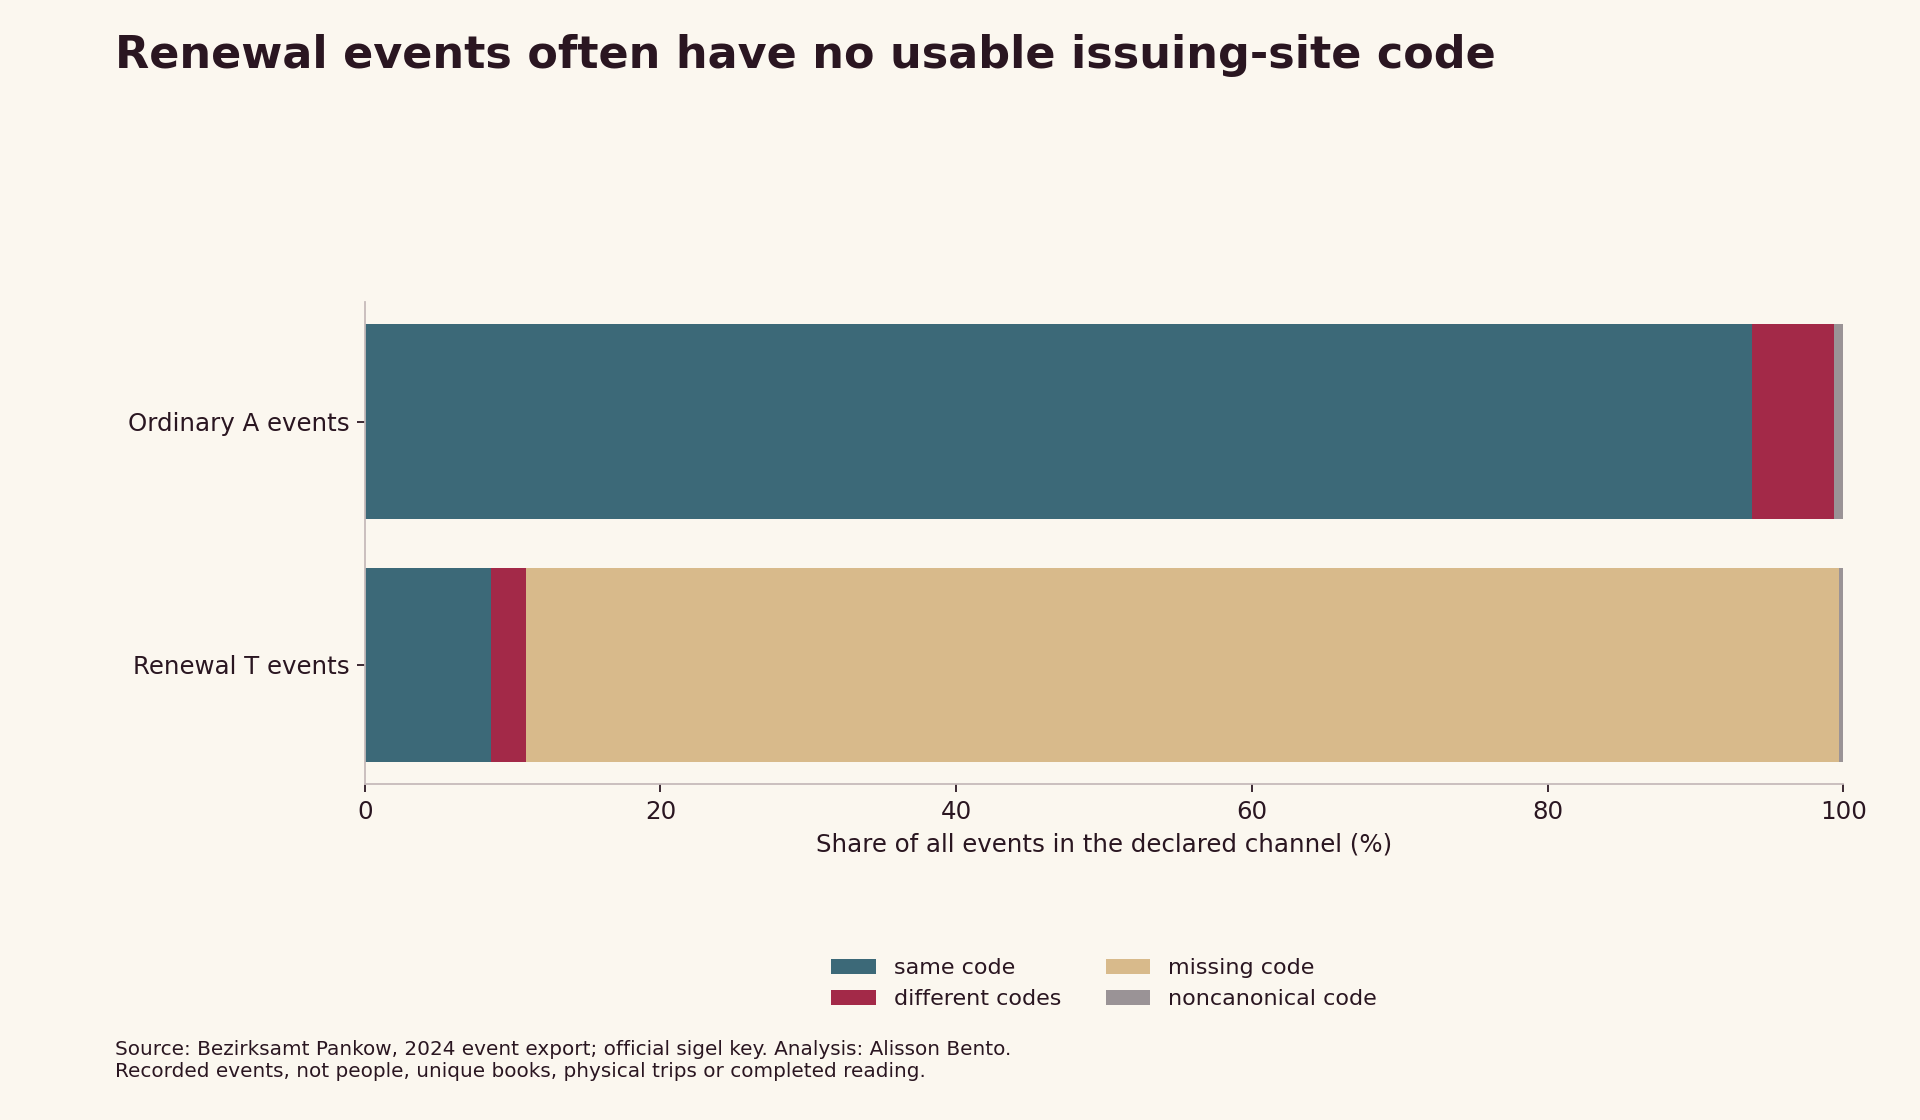
The strongest methodological warning appears in the renewal records. Of 731,076 T-coded renewal events, 649,142 have a missing code in at least one of the required fields, and another 2,113 have a noncanonical code. In these records the unusable field is the issuing code. A complete-case renewal table would cover only a small, selected part of the channel. Comparing its apparent geography directly with ordinary borrowing would confuse availability of a location code with behaviour.
Why a local shelf is an incomplete unit of description
A neighbourhood branch is a convenient place for a reader to start. It is also a convenient unit for an annual report. A networked library system complicates that convenience. The collection credited to a branch and the transactions processed there need not have identical boundaries. A statement about the collection should therefore say which boundary it uses.
Imagine a purely illustrative report with an item owned under code X and issued under code Y. An owning-code total adds the event to X. An issuing-code total adds it to Y. Adding both totals would count the same event twice. Using only X would omit the issuing role; using only Y would hide the collection’s recorded ownership. This example explains the accounting problem without estimating transport, reader demand or the quality of either branch.
The Pankow file makes that distinction inspectable because it includes both fields. In the ordinary-event table, all usable owning codes map to Pankow in the accompanying official key. Usable issuing codes appear both within Pankow and in other mapped Berlin districts. That observation characterises this export. It is not a claim that the file is a complete census of Berlin borrowing, every transaction involving a Pankow resident, or every service through which Pankow-owned material could be used.
The relevant practical decision is how to label a map, table or local story. A map based on owning codes can be described as the ownership side of the recorded events. A map based on issuing codes can describe their processing side. It cannot be described as a map of where borrowers live unless separate, appropriate evidence establishes that geography. This study intentionally does not use the reader-linked fields contained in the source.
The source and its time boundaries
The primary source is the dataset published by Bezirksamt Pankow through Berlin Open Data, covering 2022, 2023 and 2024. This analysis uses only the 2024 CSV. Its 348,162,105 bytes have the frozen SHA-256 fingerprint 0d1994ba15217b381ba5ab1455433b7f7aea5dde07e2da943c688833664ab5c9. The portal records an update on 1 July 2025 and assigns Creative Commons Zero to the dataset. It describes both successful and failed borrowing operations, which is why the complete source must not be labelled a count of completed loans.
The supplied short documentation is dated 23 January 2023. It explains the owning-library code, issuing-library code and event classes. The accompanying library key was obtained through the exact resource link advertised on the official dataset page. Its fingerprint is recorded separately. Some entries in that key contain historical names, composite codes or closure notes. It is a coding reference, not a verified directory of current operating branches.
The analysis does not assume that a historical key certifies that every named site was open throughout 2024, remains open today, or had a particular service model. A numeric code not matched by the conservative key procedure remains unmapped. It is not assigned a district by resemblance, a guessed branch name or a current search result. This preserves the difference between an observed numeric relationship and a geographically interpreted relationship.
Only six declared non-patron fields are permitted in extraction: medium type, owning code, issuing code, material-audience label, event type and month. The location analysis itself uses the first three and the event class. It does not examine title, author, copy number, user group, age, sex, residential area or the additional time field present in the 2024 export. The public outputs contain aggregated institutional codes and counts rather than row-level transactions.
Ordinary events, renewals and reversals remain separate
The complete CSV contains 1,701,989 rows. Its event classes comprise 911,020 A-coded ordinary events, 731,076 T-coded renewals, 30,726 O-coded undo operations and 29,167 retry events coded 9. The official documentation explains that an undo can arise when a borrowing operation is reversed because an RFID chip was not written, and that code 9 follows an undo. These operational distinctions are material to interpretation.
The principal ownership-versus-issue matrix is restricted to A. T has a separate matrix used to inspect coverage and sensitivity. O and 9 remain visible in the full event accounting but are not folded into the main relationship denominator. This avoids an invented netting rule: the export does not supply an event-pair identifier that would allow this study to match a particular undo to a particular retry.
Even the A-only analysis retains the careful term “ordinary events.” It does not deduplicate copies, readers or titles. If the same item appears in several ordinary events, those events remain several rows. If an operation’s administrative classification does not perfectly describe its final outcome, this analysis cannot independently correct that classification. Its contribution is transparent aggregation of the published source rather than a reconstruction of the library’s internal transaction ledger.
The renewal coverage result deserves particular attention. Removing unusable codes from A excludes about 0.65% of that channel (5,883 of 911,020 events). Removing them from T excludes about 89% of the channel (651,255 of 731,076 events). A comparison limited to complete cases therefore applies very different selection rules in practice, despite using the same formula. A familiar-looking percentage can be misleading when its observable denominator changes this much.
How the code comparison is calculated
Code handling is deliberately narrow. Surrounding whitespace is removed. A string of digits, optionally followed by an exact .0, is converted to its integer-string representation. Blank values and the recorded missing-value spellings are missing. Other strings are noncanonical. The method does not infer that two unusual strings are aliases, expand composite entries automatically, or treat an unusable code as the owning branch.
For each A event with usable codes, equality of the two canonical strings determines a same-code relationship. Inequality determines a different-code relationship. Missing and noncanonical records stay in separate categories. The primary all-event mismatch percentage divides observed different-code events by every A event, including those whose relationship cannot be classified. It is therefore a clearly labelled observed proportion, not an estimate that silently assigns unknown records.
A second, complete-code proportion can be calculated from the same table: 50,080 divided by the sum of 50,080 different-code and 855,057 same-code events. Its denominator is smaller. Both proportions can be useful if their labels remain explicit, but they answer different questions. The first says what share of the full ordinary-event export is observed to have different codes. The second conditions on the availability of usable codes.
The upper identification bound assigns every unclassifiable A event to a different-code relationship. The lower bound assigns none of them to that relationship. This interval expresses the arithmetic consequence of the unresolved code cases under the two extreme assignments. It is not a confidence interval, a sampling-error estimate or a prediction about where the unknown records belong. It does not address errors in otherwise canonical source codes.
Media categories change the comparison
The full downloadable table preserves all observed source medium-type categories. The compact media chart displays the four categories with the largest A-event counts, selected by count rather than by the size of their mismatch percentage. These are the source’s book, CD, DVD and periodical categories. Category labels follow the export and should not be stretched into a complete taxonomy of publishing formats.
For books, the table contains 30,681 observed different-code A events among 615,833 book events. The corresponding DVD counts are 10,278 among 91,085. Thus the observed all-event mismatch proportions differ across these source categories. A larger proportion does not demonstrate that one medium is harder to find locally, more popular, transported farther or better served by interlibrary lending. The export contains neither a stock denominator nor the number of requests that could not be met.
There are several plausible reasons why category profiles could differ: collection organisation, centralised holdings, borrowing rules, particular branch specialisms, or administrative coding. This study does not choose among them. It provides an auditable starting point for a librarian or reporter who can investigate the relevant service arrangements directly. Explanations should be added only when supported by additional source material or an accurately attributed response.
The identification ranges beside the media points follow the same extreme-assignment rule as the overall table. A narrow range means few records in that category lack a usable relationship under this parser. It does not mean that the category’s underlying service is more reliable. Nor does a wider range justify replacing the missing cases with the most convenient story.
Reading the ownership profiles
The ownership profile chart uses one bar for each of the eight usable Pankow owning codes observed in the ordinary-event file. Each bar sums to its own recorded A-event total. It separates same-code events, another mapped Pankow issuing code, another mapped district, an unmapped numeric issuing code and an unusable code. The axis is a percentage composition rather than a ranking of service quality.
This organisation prevents several forms of double counting. Another Pankow site is not simultaneously placed in the outside-district segment. A numeric but unmapped code is not silently treated as an outside district. An unusable field is not placed in whichever segment makes a bar easier to explain. The small unresolved segment is part of the result and remains visible in the table.
The full owner-to-issuer matrix supports readers who need exact institutional totals rather than the summary bars. Library names are included only through the supplied key, with its historical limitations retained. Comparisons between bars should consider that the underlying collections and services differ. A branch with a small collection, a specialised medium or a particular administrative role is not directly interchangeable with another branch merely because both have a numeric identifier.
For an editor, the most defensible visual caption is consequently modest: the chart shows how A-coded events attached to each owning code are distributed across recorded issuing relationships in this export. It cannot show how far any person travelled. Lines connecting two library points on a map would easily suggest a physical route that these data do not establish; the matrix and composition bars avoid that unsupported implication.
What is added to the existing public dashboard
Pankow’s official ODIS dashboard already demonstrates that library transaction data can support useful public analysis. Its visible 2022 panels cover overall borrowing and renewal totals, medium categories, selected title and author tables, personal-characteristic summaries, monthly activity and publication years. This study credits that existing work and makes no first-ever claim about analysing Pankow circulation.
The additional question is the relationship between the owning and issuing fields in the 2024 export, together with the availability of those fields by event channel. The supplied matrix, conservative code handling and unresolved-case bounds make that question reproducible. The finding that renewal issuing codes are frequently absent is especially important because it limits a superficially attractive comparison rather than producing a dramatic league table.
The analysis has been prepared as a bounded secondary use of administrative data. It is not a new survey, a service audit conducted in branches, an assessment endorsed by the library authority or a measure of individual behaviour. Its usefulness lies in helping a reader choose the appropriate administrative unit before turning a count into a claim.
Reuse and interpretation
The aggregate CSV files, accessible HTML tables, figures and calculation instructions are intended to be read together. Reusers should retain the 2024 observation year, the A-event principal denominator, the separate renewal coverage warning and the distinction between code mismatch and physical movement. Alisson Bento is credited for the original analysis; Bezirksamt Pankow and the official documentation remain credited as the source.
This release does not redistribute the raw transaction CSV, reader-linked attributes or row-level records. The source licence supports reuse of the official dataset, but minimising unnecessary disclosure remains appropriate. A reader who needs to reproduce extraction can obtain the exact source through its official public route and verify the recorded fingerprint before using the declared six-field projection.
A future update could become more informative if the authority supplies an authoritative code-version history or explains how remote renewals are represented. Such information would warrant a dated methodological amendment, not silent reassignment of unknown cases. Until then, the right conclusion is precise: the file records a measurable distinction between collection ownership and issuing location, while its missing-code pattern sets a substantial boundary on renewal comparisons.
Renewal events often have no usable issuing-site code
Recorded institutional code relationships; no reader movement or physical route inferred. Recorded events, not people, unique books, physical trips or completed reading.
Full chart and source
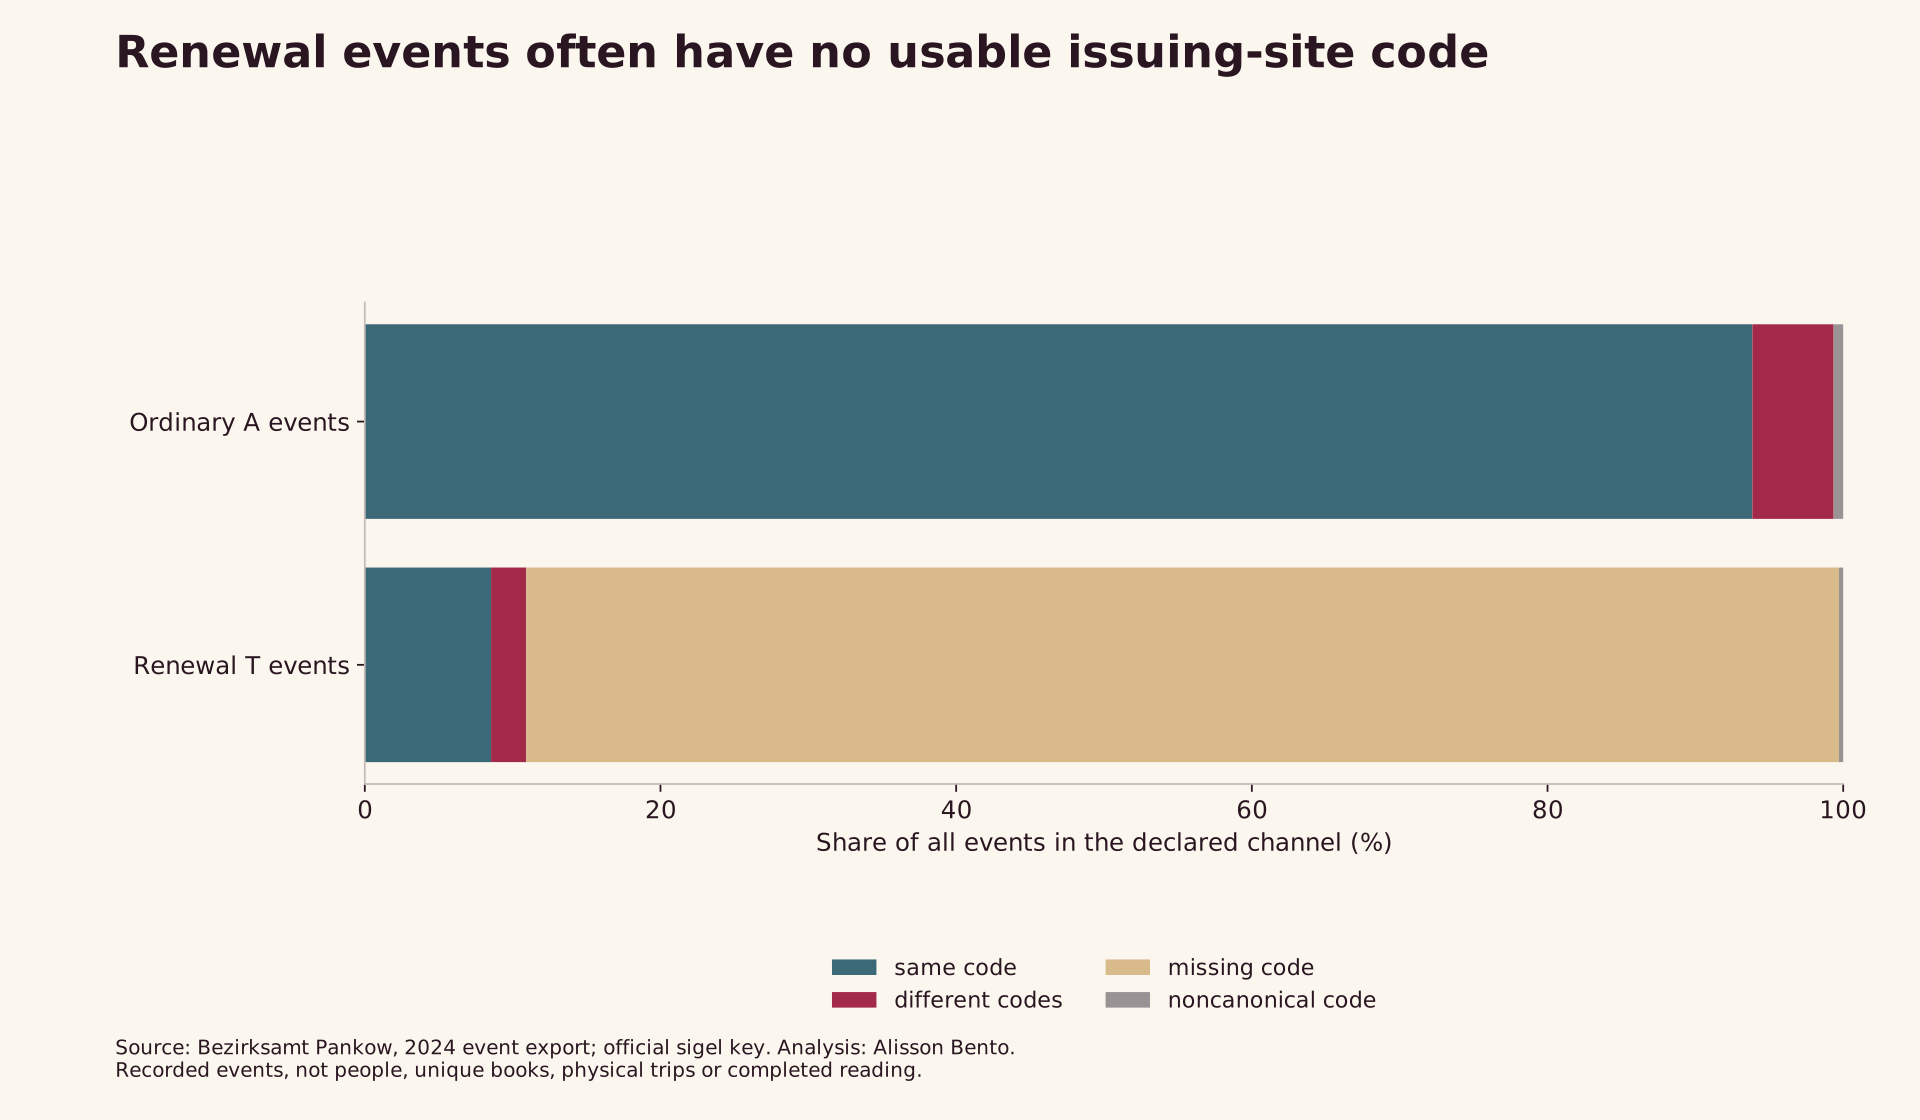
Scroll horizontally to inspect the chart. ↔
Chart and values
Scroll horizontally to see all columns.
| Event channel | Recorded code relationship | Events | Share of all channel events (%) |
|---|---|---|---|
| Ordinary A events | Same usable code | 855,057 | 93.86 |
| Ordinary A events | Different usable codes | 50,080 | 5.50 |
| Ordinary A events | Missing required code | 1 | 0.00 |
| Ordinary A events | Noncanonical required code | 5,882 | 0.65 |
| Renewal T events | Same usable code | 62,442 | 8.54 |
| Renewal T events | Different usable codes | 17,379 | 2.38 |
| Renewal T events | Missing required code | 649,142 | 88.79 |
| Renewal T events | Noncanonical required code | 2,113 | 0.29 |
Recorded events, not people, unique books, physical trips or completed reading.
A different issuing code is not equally common across media
Recorded institutional code relationships; no reader movement or physical route inferred. Sand range: all unresolved cases assigned as mismatches; identification bound, not a confidence interval.
Full chart and source

Scroll horizontally to inspect the chart. ↔
Chart and values
Scroll horizontally to see all columns.
| Source medium type | Events | Different usable codes | Share of all ordinary A events in the category (%) | Extreme-assignment upper bound (%) |
|---|---|---|---|---|
| Book | 615,833 | 30,681 | 4.98 | 5.55 |
| CD | 111,430 | 4,559 | 4.09 | 4.61 |
| DVD | 91,085 | 10,278 | 11.28 | 12.79 |
| Periodical | 42,217 | 1,751 | 4.15 | 4.49 |
The four source categories with the largest ordinary A-event counts; complete downloads retain every category. Sand range: all unresolved cases assigned as mismatches; identification bound, not a confidence interval. Technical aggregate exports in English retain exact source codes, counts and precision. The accompanying article and figure labels are localized.

Owning a collection and issuing it are different roles
Recorded institutional code relationships; no reader movement or physical route inferred. Recorded events, not people, unique books, physical trips or completed reading.
Full chart and source

Scroll horizontally to inspect the chart. ↔
Chart and values
Scroll horizontally to see all columns.
| Owning code | Same code | Other Pankow code | Other mapped district | Unmapped numeric code | Unusable code | Events |
|---|---|---|---|---|---|---|
| 457 | 115,909 | 5,674 | 7,979 | 27 | 1,547 | 131,136 |
| 462 | 251,991 | 3,050 | 7,000 | 333 | 1,549 | 263,923 |
| 471 | 39,728 | 1,034 | 1,555 | 22 | 319 | 42,658 |
| 650 | 112,751 | 2,971 | 3,672 | 17 | 814 | 120,225 |
| 655 | 55,232 | 521 | 1,388 | 7 | 206 | 57,354 |
| 971 | 118,262 | 2,929 | 3,240 | 29 | 639 | 125,099 |
| 972 | 52,990 | 1,387 | 1,480 | 8 | 225 | 56,090 |
| 975 | 108,194 | 2,787 | 2,954 | 16 | 583 | 114,534 |
Counts of ordinary A events by owning code and issuing relationship, not percentages. One A event with a missing owning code is excluded from these eight rows. Chart percentages use each row total. Recorded events, not people, unique books, physical trips or completed reading.

Data & downloads
Scroll horizontally to see all columns.
| Event channel | Recorded code relationship | Events | Share of all channel events (%) |
|---|---|---|---|
| Ordinary A events | Same usable code | 855,057 | 93.86 |
| Ordinary A events | Different usable codes | 50,080 | 5.50 |
| Ordinary A events | Missing required code | 1 | 0.00 |
| Ordinary A events | Noncanonical required code | 5,882 | 0.65 |
| Renewal T events | Same usable code | 62,442 | 8.54 |
| Renewal T events | Different usable codes | 17,379 | 2.38 |
| Renewal T events | Missing required code | 649,142 | 88.79 |
| Renewal T events | Noncanonical required code | 2,113 | 0.29 |
Recorded events, not people, unique books, physical trips or completed reading.
Scroll horizontally to see all columns.
| Owning code | Same code | Other Pankow code | Other mapped district | Unmapped numeric code | Unusable code | Events |
|---|---|---|---|---|---|---|
| 457 | 115,909 | 5,674 | 7,979 | 27 | 1,547 | 131,136 |
| 462 | 251,991 | 3,050 | 7,000 | 333 | 1,549 | 263,923 |
| 471 | 39,728 | 1,034 | 1,555 | 22 | 319 | 42,658 |
| 650 | 112,751 | 2,971 | 3,672 | 17 | 814 | 120,225 |
| 655 | 55,232 | 521 | 1,388 | 7 | 206 | 57,354 |
| 971 | 118,262 | 2,929 | 3,240 | 29 | 639 | 125,099 |
| 972 | 52,990 | 1,387 | 1,480 | 8 | 225 | 56,090 |
| 975 | 108,194 | 2,787 | 2,954 | 16 | 583 | 114,534 |
Counts of ordinary A events by owning code and issuing relationship, not percentages. One A event with a missing owning code is excluded from these eight rows. Chart percentages use each row total. Recorded events, not people, unique books, physical trips or completed reading.
Scroll horizontally to see all columns.
| Source medium type | Events | Different usable codes | Share of all ordinary A events in the category (%) | Extreme-assignment upper bound (%) |
|---|---|---|---|---|
| Book | 615,833 | 30,681 | 4.98 | 5.55 |
| CD | 111,430 | 4,559 | 4.09 | 4.61 |
| DVD | 91,085 | 10,278 | 11.28 | 12.79 |
| Periodical | 42,217 | 1,751 | 4.15 | 4.49 |
The four source categories with the largest ordinary A-event counts; complete downloads retain every category. Sand range: all unresolved cases assigned as mismatches; identification bound, not a confidence interval. Technical aggregate exports in English retain exact source codes, counts and precision. The accompanying article and figure labels are localized.
Evidence & method
How we calculated it
- Frozen official 2024 CSV SHA-256 verified before extraction; the published data’s 2023 documentation defines event and medium fields. Source updated 1 July 2025.
- Only the six declared non-patron fields are projected. Missing, noncanonical, same-code and different-code cases remain distinct. Canonicalization strips whitespace and only an exact .0 numeric suffix.
- Exact numeric entries in the accompanying official sigel key supply names and districts; composite or ambiguous entries are not automatically expanded. Historical names and closures do not establish current operation.
- Principal denominator is all ordinary A events. T renewals are separate; O undo and 9 retry rows remain in event accounting. Extreme unknown-case assignments are identification bounds, not confidence intervals.
What the data cannot tell us
- An administrative event is not a unique reader, copy, work, successful request, transport trip or completed reading. The export does not establish stock, demand, cost or service-quality denominators.
- Most T renewal records lack a usable issuing code. Conditioning on complete codes is not a representative geographical comparison of all renewals.
- Official code key can contain historical labels and composite entries; unmatched codes remain unresolved. Source completeness and internal transaction corrections are not independently certified.
- Observed 2024 source roles do not establish residents’ geography, present opening hours or future availability. The 2022 official dashboard is prior work; no first-ever claim.
Original sources
- Bezirksamt Pankow, Berlin Open Data: 2024 circulation export
Bezirksamt Pankow, public dataset 2022–2024; the analysis uses the exact 2024 CSV only. Official portal assigns CC0 and records update 1 July 2025.
Accessed October 31, 2026
- Pankow short data documentation, 23 January 2023
Official short data documentation dated 23 January 2023 defines A ordinary operations, T renewals, O undo and 9 retry; material-audience labels concern the medium, not the person.
Accessed October 31, 2026
- Official Bibliotheks Sigel key
Official resource key obtained 31 October 2026. Exact numeric entries interpreted conservatively; historical names and composite entries do not establish current operational branches.
Accessed October 31, 2026
- ODIS public Pankow dashboard, 2022
ODIS public Pankow dashboard describes 2022 counts, categories and monthly activity; credited prior analysis. The bounded 2024 extension does not establish first-ever analysis or an official endorsement.
Accessed October 31, 2026
Cite & reuse this study
Alisson Bento. A Library Collection Has Two Addresses: Pankow owning and issuing code profiles, 2024. Original secondary analysis of Bezirksamt Pankow’s open data. https://alissonbento.com/research/pankow-owning-issuing-library-codes-2024/
Reuse original aggregate analysis and figures with attribution to Alisson Bento and Bezirksamt Pankow. Retain the 2024 date, event denominators, missing-code bounds and absence of a physical-transport inference. No raw transactions or reader-linked fields are redistributed.
Corrections or editorial questions