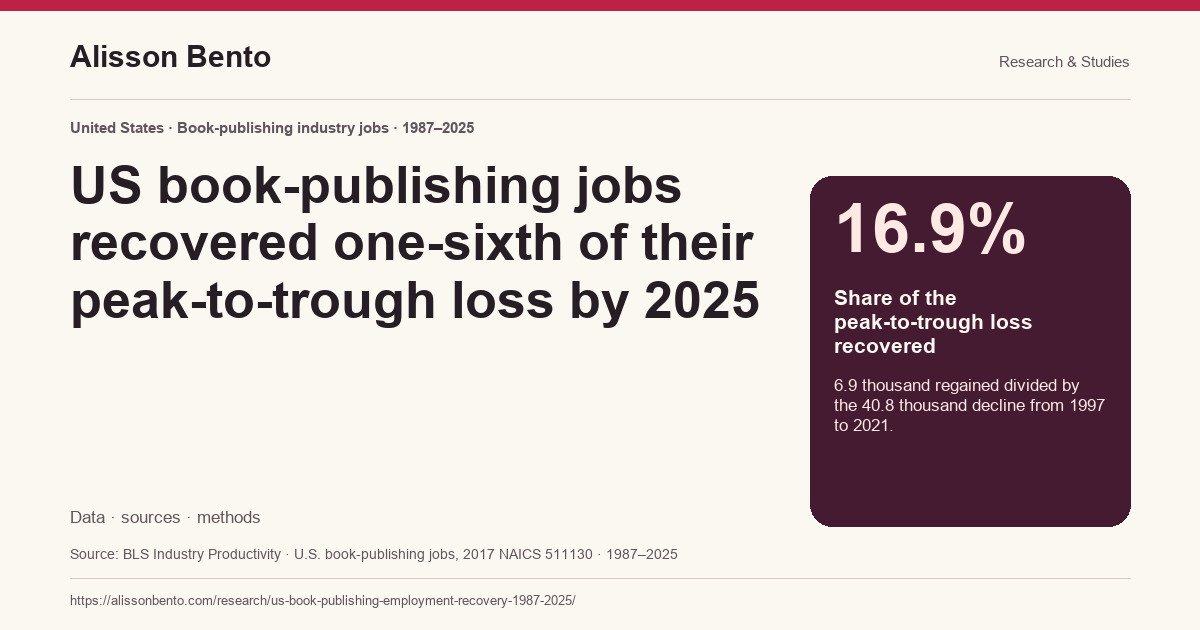
A recovery of about one-sixth of the observed decline
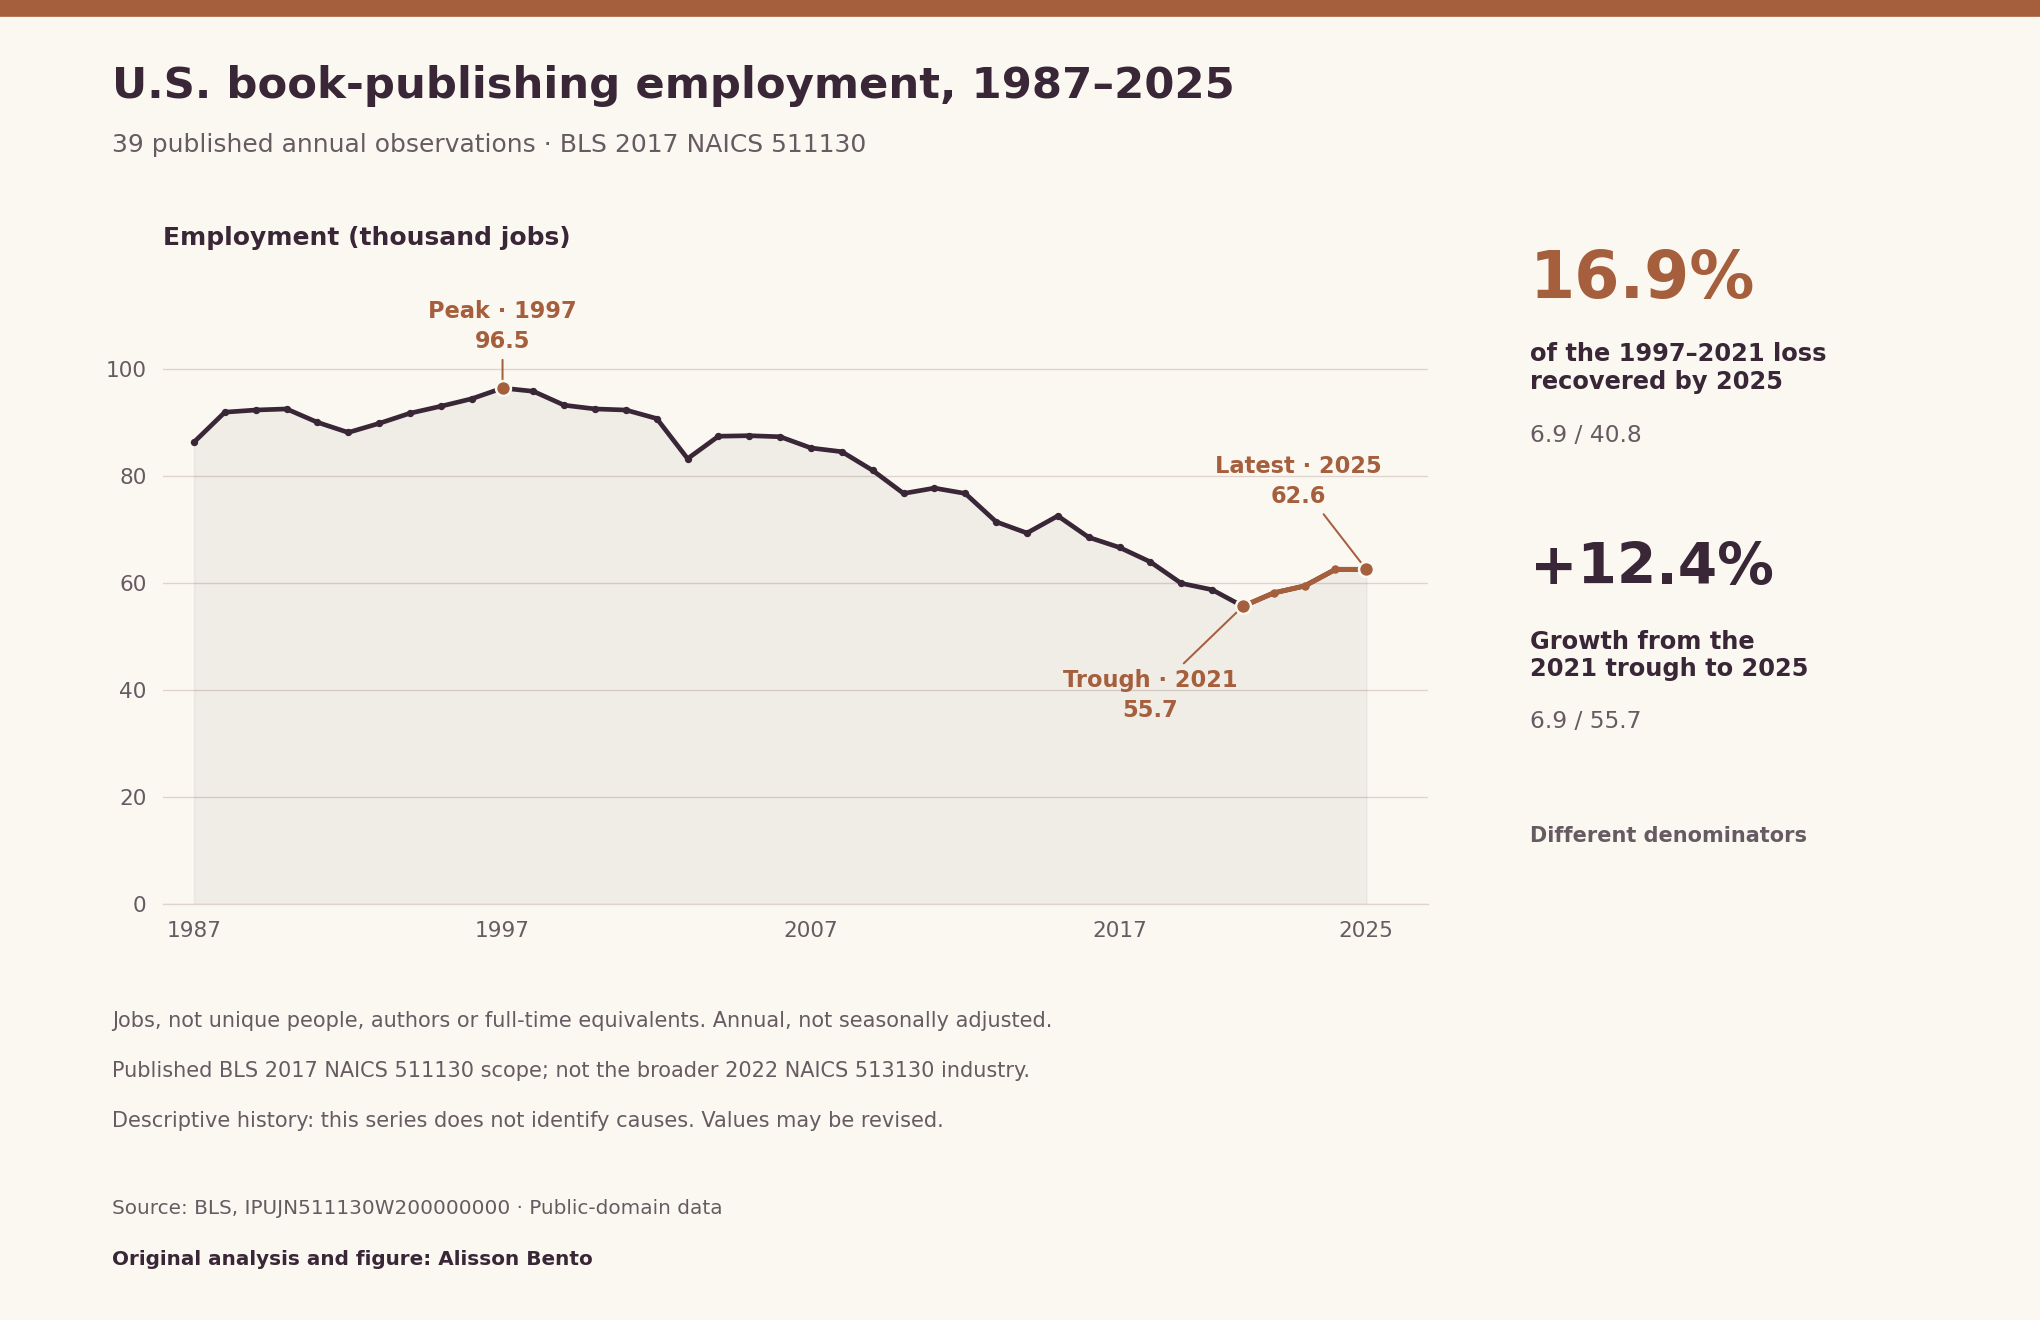
US book-publishing industry employment recovered part of its long decline by 2025, but the distance back to the observed peak remained substantial. In the Bureau of Labor Statistics series examined here, employment reached 96.5 thousand jobs in 1997 and fell to 55.7 thousand in 2021. The 2025 observation was 62.6 thousand. The rise from the low was therefore 6.9 thousand jobs, compared with a peak-to-trough reduction of 40.8 thousand. Dividing the increase by that earlier reduction gives 16.9%: approximately one-sixth of the decline had been reversed. The remaining gap to the peak was 33.9 thousand jobs. These statements describe the same published series rather than a combination of several employment datasets.
The question is deliberately narrower than whether publishing has recovered as a business or cultural activity. Employment is one dimension of an industry, and the number of jobs does not determine its revenue, output, profitability or contribution to readers. A smaller workforce can accompany many different business conditions; this analysis does not distinguish them. What the annual series does establish is that the improvement after its observed low had not restored most of the earlier employment loss. The complete 1987–2025 record is retained below so that the headline can be checked against every observation, not just two favorable endpoints. All references to a peak or trough concern this 39-year window, not an assertion about the industry’s entire history.
Why 16.9% recovered and 12.4% growth are both correct
The two most useful percentages answer different questions. Growth from the 2021 low compares the increase of 6.9 thousand jobs with the 2021 employment level of 55.7 thousand. That calculation produces 12.4%. Recovery of the earlier loss instead compares the same increase with the 40.8 thousand jobs separating the 1997 peak from the 2021 low. It produces 16.9%. Neither number can replace the other. Saying that employment grew 16.9% after 2021 would be incorrect, as would saying that a 12.4% share of the peak-to-trough loss had been regained. Every percentage needs its own denominator, especially when a narrative switches between growth and recovery.
The endpoint arithmetic also explains why percentage declines and later percentage increases are not symmetric. The drop from 96.5 thousand to 55.7 thousand was 42.3% of the peak level. The subsequent increase operates on the smaller low-point base. Adding the rounded decline percentage to the rounded growth percentage would not reproduce the remaining gap to the peak. The direct comparison is clearer: 62.6 thousand in 2025 was 35.1% below 96.5 thousand in 1997. The recovery-share calculation avoids that particular confusion by measuring both lost and regained jobs in the same units before dividing. It is an accounting description of the observed path, not a model of how quickly employment should recover or a forecast that it will eventually return to the peak.
What changes when the reference year changes
The same 2025 observation looks different against other reference years. Compared with 2019, when the series recorded 60.0 thousand jobs, the increase was 2.6 thousand, or 4.3%. Compared with 2015, when it recorded 72.6 thousand, the decrease was 10.0 thousand, or 13.8%. Compared with the first observation in 1987, at 86.4 thousand, the decrease was 23.8 thousand, or 27.5%. These are compatible results, not competing estimates of one effect. They show how a relatively recent improvement can coexist with a workforce substantially smaller than at earlier dates. The endpoint-comparison table therefore includes the reference level and absolute change as well as the percentage.
The year 1997 was selected because it is the maximum in the complete supplied series; 2021 is its minimum. They are descriptive extrema identified after examining the observations, not independently specified treatment dates. The 2019 and 2015 comparisons offer recognizable recent and longer reference points without implying that either year provides a causal counterfactual. The 1987 comparison uses the beginning of the available window rather than claiming a natural starting point for publishing. Retaining all these comparisons reduces the risk that a single baseline does the work of an argument. It does not remove the need to interpret the data’s scope. In particular, none of the comparisons estimates what employment would have been under a different technology, business strategy or public-health history.
Jobs are not people, authors or full-time equivalents
The source labels this measure annual employment in thousands of jobs. That unit is important. A jobs total is not necessarily a count of unique individuals: a person can hold more than one job. It is also not a full-time-equivalent measure that converts different working schedules into a common number of full-time positions. Consequently, a difference of 6.9 thousand jobs should not be described as precisely 6,900 additional people or 6,900 full-time workers. Converting thousands into individual units changes the display, not the underlying precision or concept. The source values should remain visibly approximate when translated into prose.
Industry and occupation are separate classifications. A book-publishing industry measure concerns jobs associated with establishments in that industry, across their occupations. It is not a count of authors regardless of where they work, and it does not measure everyone who writes or publishes a book. Nor does it identify which occupations contributed to the observed increase or decrease. An employment total cannot show whether editors, sales staff, production workers, managers or other occupational groups changed in the same way. Independent writers and self-publishing activity cannot be read directly from this industry total. Although the BLS methodology includes self-employed and unpaid-family-worker information in its employment construction, that does not turn the resulting series into a census of authors. The distinction prevents an industry-level change from being recast as a statement about the number of people pursuing a literary career.
How BLS constructs the employment measure
The BLS technical note describes industry employment and hours as drawing primarily on the Current Employment Statistics survey and the Current Population Survey. CES supplies wage-and-salary job information from nonfarm establishments. CPS information on self-employed and unpaid family workers supplements those data in estimating industry employment. BLS also explains that some industries use additional sources or further disaggregation, including the Quarterly Census of Employment and Wages and Census Bureau information. The relevant methodological claim is therefore that this is a constructed official industry measure drawing on specified statistical sources, not a direct count extracted from a single universal list of publishing employees.
The analysis uses the employment level published by the Industry Productivity program. The program name does not mean that employment itself measures productivity. Labor productivity relates output to hours worked, while this study extracts only a jobs series. It does not divide output by employment, infer productivity gains from workforce reductions or estimate work intensity. Nor does it recreate the agency’s combination of underlying surveys from microdata. Using the official aggregate avoids pretending that the supplementary information and industry-specific adjustments can be reconstructed from the small download accompanying this article. The method remains transparent at the level actually analyzed: identify one series, preserve its annual observations, calculate changes and state the boundaries of interpretation. Readers interested in the construction of hours or output should consult the technical note rather than treating employment as a substitute for those different measures.
Keep the 2017 industry definition rather than silently changing codes
The current BLS service-industry release identifies its classification as 2017 NAICS. The employment series examined here is explicitly labeled book publishers under NAICS 511130. Its identifier, IPUJN511130W200000000, remains the same across all 39 observations in the extracted file. The current series catalog confirms the 1987 beginning and 2025 ending year, annual period and US-total geography. Preserving that published series is essential to the comparison. This study does not attach a newer industry code to the numbers, append a differently defined series or construct its own bridge between classifications.
The Census Bureau’s 2022 NAICS concordance shows why a code replacement would not be harmless. The newer book-publisher code, 513130, combines the former 511130 category with the Internet-book-publisher portion of the former 519130 category. It therefore represents more than a change in digits. The BLS series used here should not be advertised as complete coverage of that broader newer definition. At the same time, the presence of one identifier and a full annual sequence is not proof that statistical methods have never changed. Historical estimates can be revised and underlying data systems can evolve. The defensible continuity claim is specific: the comparisons use one continuous published BLS series, with no researcher-created splice and no row or series footnotes in the extracted snapshot. That supports this bounded descriptive analysis, not an assertion of perfect measurement invariance over nearly four decades.
What the displayed precision permits—and what it does not
The observations are published to one decimal place in thousands of jobs. A displayed value of 62.6 thousand has a resolution of one-tenth of a thousand, rather than a claim to identify every individual job. Both 2024 and 2025 display 62.6 thousand. The appropriate statement is that employment was unchanged at published precision. The equality does not establish that no underlying change occurred, that hiring and departures stopped, or that the same jobs remained in place. Annual aggregate levels cannot reveal the gross flows of jobs or workers that may sit behind similar totals.
All percentages in this article are calculated from those published rounded levels and displayed to one decimal place. More digits in the calculation files make reproduction possible but should not be interpreted as more accurate measurement. Official rates calculated from more detailed inputs can differ slightly from rates recomputed from the displayed levels. The extracted observations do not provide sampling variances or confidence intervals, and this analysis does not manufacture them. It makes no claim that one difference is statistically significant or that the 2024–2025 equality demonstrates statistical equivalence. Rounding, sampling error and nonsampling error are different issues; a small rounding unit does not establish a small total error. The historical comparisons are useful descriptions of the official series, provided that their precision is not confused with certainty about the underlying labor market.
A reproducible snapshot is not a permanently final history
The data and metadata used here were accessed on October 30, 2026. The latest observation in the selected series is 2025. Those dates refer to different things: access in 2026 does not make the employment observation a 2026 figure. Likewise, the presence of a 2025 estimate does not establish that every earlier value will remain fixed. BLS explains that productivity programs incorporate revisions to underlying sources, and its general revisions policy describes how new information can change published estimates. The absence of a footnote attached to these extracted rows should not be translated into a guarantee that their values are final.
For this reason, the reproducibility materials identify the source files and record cryptographic hashes for the frozen inputs and small analytical outputs. A future user can distinguish a calculation error from a different data vintage. If BLS revises the series, the correct update is to extract the full history again and recalculate the peak, trough, endpoint changes and recovered share together. Simply adding a new endpoint to an old historical extraction could mix vintages and make the result harder to interpret. The selected maximum or minimum could also change after revision. An updated article should describe such changes rather than implying that earlier calculations were based on the later information. Reproducibility means showing which observations produced a result; it does not require pretending that an official statistical series is immune to subsequent improvement.
What this result says about publishing—and what it leaves open
The strongest supported conclusion is that the recent rise was modest relative to the preceding peak-to-trough employment reduction in this industry definition. That conclusion is informative without identifying a cause. The annual totals do not establish that artificial intelligence, electronic books, other digital technologies, the pandemic or a particular publisher strategy produced either the decline or the increase. A temporal coincidence is not a controlled comparison. The analysis contains no firm-level treatment indicator, counterfactual group or model separating several simultaneous influences. Assigning the observed path to one explanation would go beyond the evidence analyzed here.
Several other questions also remain separate. Employment is not a measure of books sold, titles released, reading participation, revenue, worker pay or royalty income. It does not reveal job quality, working conditions, occupational composition or the distribution of work between large and small publishers. Nor is this a study of bookstores: retail establishments selling books belong to a different industry context, and establishment counts answer a different question from publishing jobs. A within-year comparison of publishing firms by size would also have a different estimand from this aggregate historical trajectory. Keeping those boundaries intact makes the result more useful, not less. It identifies a verified labor-market fact that later research could investigate, while preventing the employment chart from becoming a general verdict on the health of books, reading or authorship.
How to inspect and reproduce the analysis
The first table preserves all 39 annual employment observations, and the second presents seven endpoint comparisons, including the peak-to-trough loss. The downloadable annual CSV contains only the selected series in a compact form. The accompanying Python script uses standard-library decimal arithmetic to recalculate the comparisons, locate the maximum and minimum and compute the recovered share. It also offers a raw-input verification mode: readers who separately obtain the BLS bulk file can check its frozen-snapshot hash, filter the exact identifier and compare every selected row with the analytical CSV. The complete multi-industry bulk file is not redistributed in the download package.
The source manifest identifies the official data, catalog, dictionaries, methodological explanation, classification evidence and reuse policy. This separates original source information from the selection and arithmetic performed for this article. BLS is credited for the employment data; the Census Bureau is credited for the classification concordance; Alisson Bento is credited for the secondary analysis and explanation. BLS states that its published materials are public domain except previously copyrighted photographs and illustrations, and requests source attribution. This package uses numeric data and does not reproduce an agency emblem or imply official endorsement. That source-data permission is not a blanket license declaration for the article. The result can be checked without a paid account or a large redistributed archive: the essential evidence is the series identity, the retained annual values, explicit denominators and calculations that return the reported rounded findings.
U.S. book-publishing employment, 1987–2025
39 published annual observations · BLS 2017 NAICS 511130. Employment (thousand jobs).
Full chart and source
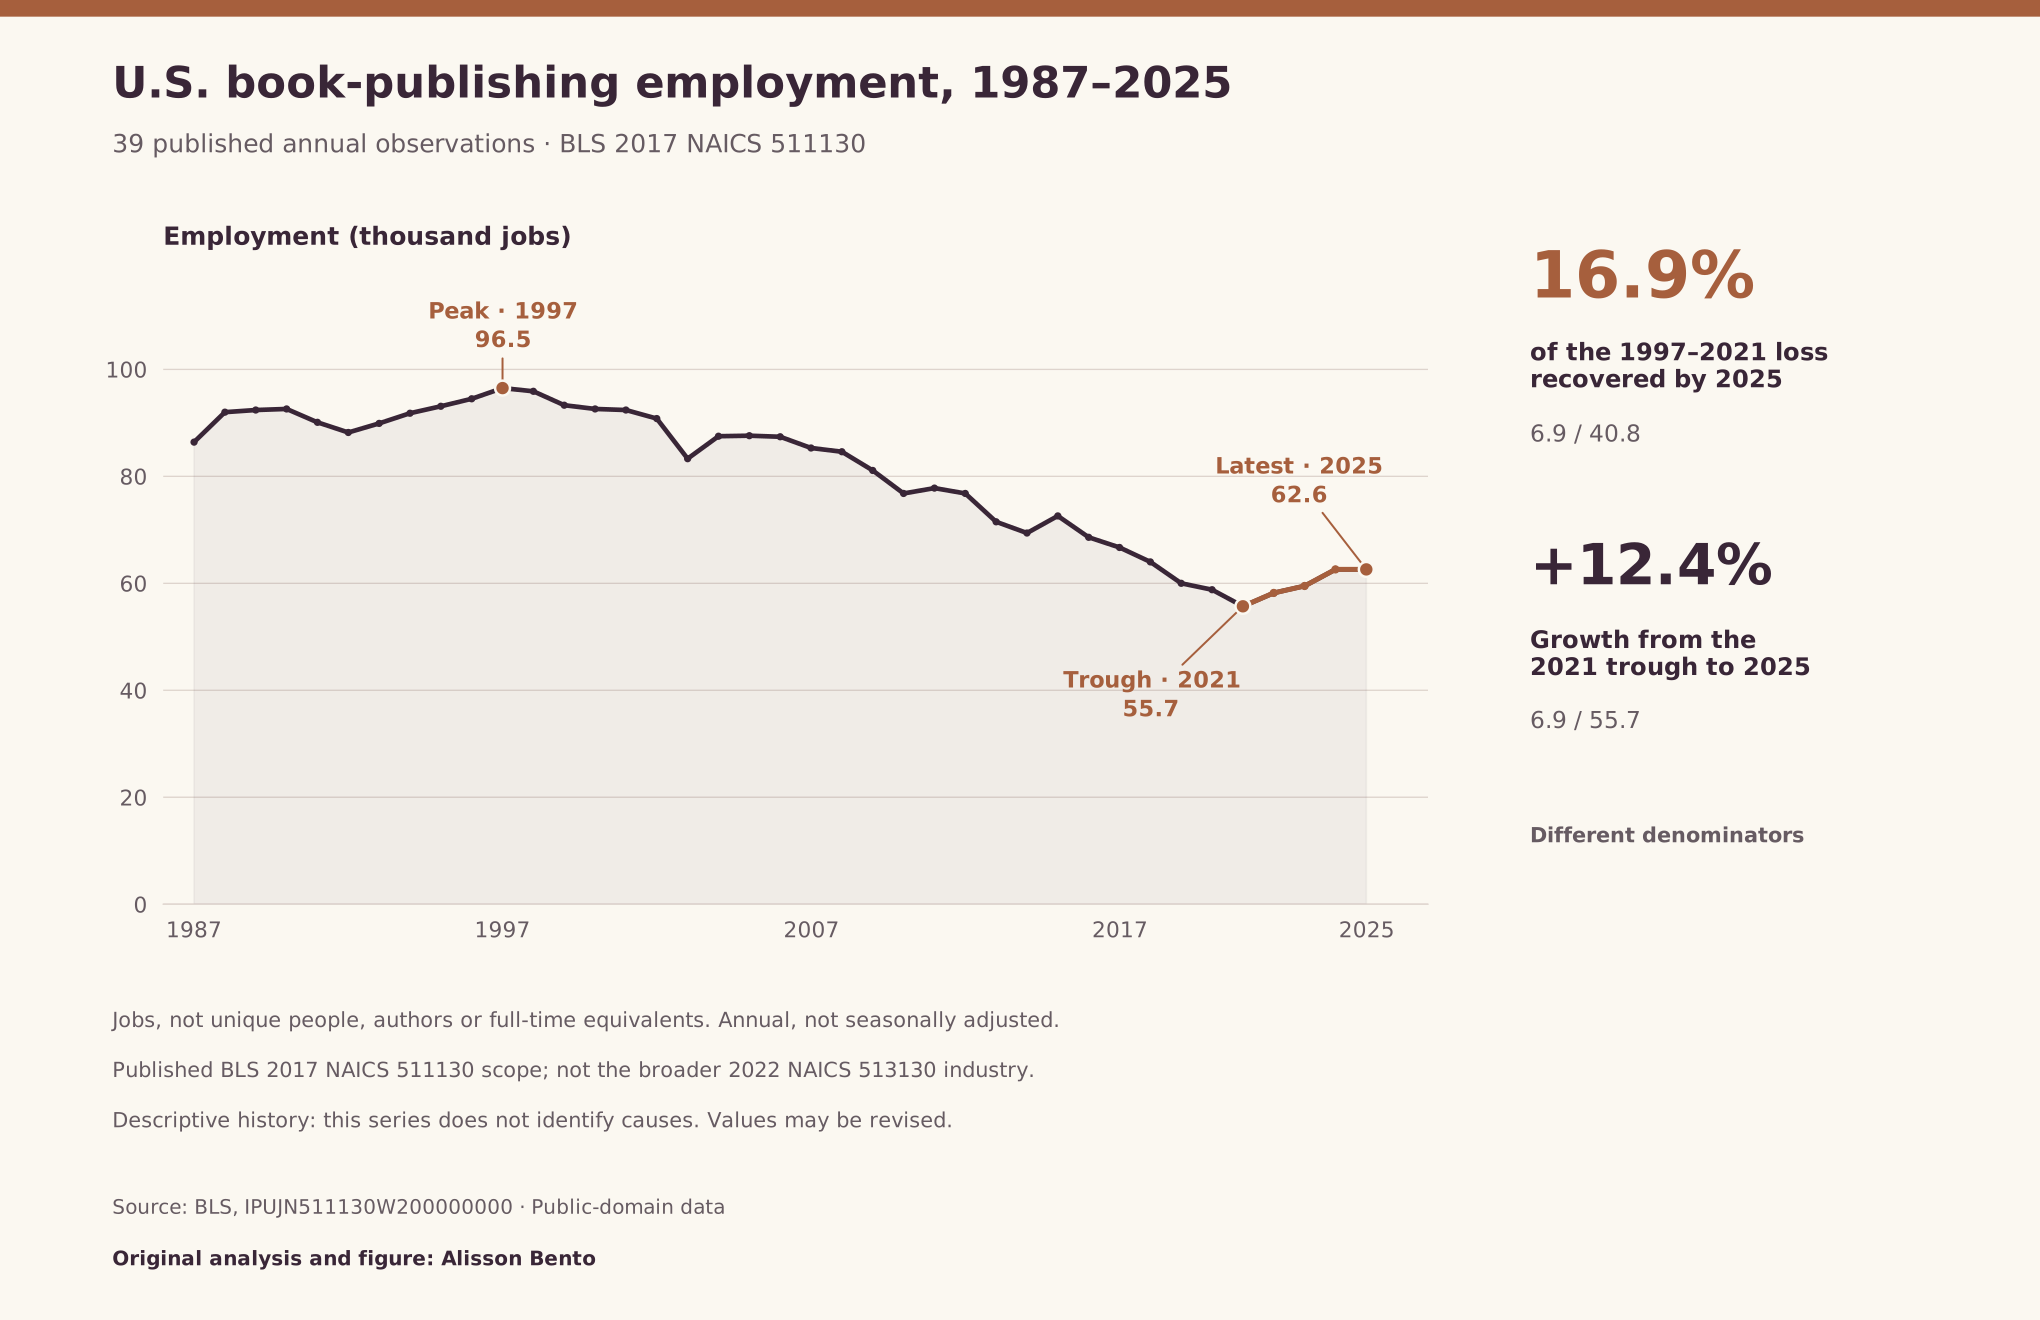
Scroll horizontally to inspect the chart. ↔
Chart and values
Scroll horizontally to see all columns.
| Year | Employment (thousand jobs) |
|---|---|
| 1987 | 86.4 |
| 1988 | 92.0 |
| 1989 | 92.4 |
| 1990 | 92.6 |
| 1991 | 90.1 |
| 1992 | 88.2 |
| 1993 | 89.9 |
| 1994 | 91.8 |
| 1995 | 93.1 |
| 1996 | 94.5 |
| 1997 | 96.5 |
| 1998 | 95.9 |
| 1999 | 93.3 |
| 2000 | 92.6 |
| 2001 | 92.4 |
| 2002 | 90.8 |
| 2003 | 83.3 |
| 2004 | 87.5 |
| 2005 | 87.6 |
| 2006 | 87.4 |
| 2007 | 85.3 |
| 2008 | 84.6 |
| 2009 | 81.1 |
| 2010 | 76.8 |
| 2011 | 77.8 |
| 2012 | 76.8 |
| 2013 | 71.5 |
| 2014 | 69.4 |
| 2015 | 72.6 |
| 2016 | 68.6 |
| 2017 | 66.7 |
| 2018 | 64.0 |
| 2019 | 60.0 |
| 2020 | 58.8 |
| 2021 | 55.7 |
| 2022 | 58.2 |
| 2023 | 59.5 |
| 2024 | 62.6 |
| 2025 | 62.6 |
BLS series IPUJN511130W200000000; U.S. total; 2017 NAICS 511130; annual, not seasonally adjusted; published rounded levels. Jobs, not persons or full-time equivalents.
Data & downloads
Scroll horizontally to see all columns.
| Year | Employment (thousand jobs) |
|---|---|
| 1987 | 86.4 |
| 1988 | 92.0 |
| 1989 | 92.4 |
| 1990 | 92.6 |
| 1991 | 90.1 |
| 1992 | 88.2 |
| 1993 | 89.9 |
| 1994 | 91.8 |
| 1995 | 93.1 |
| 1996 | 94.5 |
| 1997 | 96.5 |
| 1998 | 95.9 |
| 1999 | 93.3 |
| 2000 | 92.6 |
| 2001 | 92.4 |
| 2002 | 90.8 |
| 2003 | 83.3 |
| 2004 | 87.5 |
| 2005 | 87.6 |
| 2006 | 87.4 |
| 2007 | 85.3 |
| 2008 | 84.6 |
| 2009 | 81.1 |
| 2010 | 76.8 |
| 2011 | 77.8 |
| 2012 | 76.8 |
| 2013 | 71.5 |
| 2014 | 69.4 |
| 2015 | 72.6 |
| 2016 | 68.6 |
| 2017 | 66.7 |
| 2018 | 64.0 |
| 2019 | 60.0 |
| 2020 | 58.8 |
| 2021 | 55.7 |
| 2022 | 58.2 |
| 2023 | 59.5 |
| 2024 | 62.6 |
| 2025 | 62.6 |
BLS series IPUJN511130W200000000; U.S. total; 2017 NAICS 511130; annual, not seasonally adjusted; published rounded levels. Jobs, not persons or full-time equivalents.
Scroll horizontally to see all columns.
| Period | Start (thousand jobs) | End (thousand jobs) | Change (thousand jobs) | Total change (%) |
|---|---|---|---|---|
| 1987–2025 | 86.4 | 62.6 | −23.8 | −27.5 |
| 1997–2021 | 96.5 | 55.7 | −40.8 | −42.3 |
| 1997–2025 | 96.5 | 62.6 | −33.9 | −35.1 |
| 2015–2025 | 72.6 | 62.6 | −10.0 | −13.8 |
| 2019–2025 | 60.0 | 62.6 | 2.6 | 4.3 |
| 2021–2025 | 55.7 | 62.6 | 6.9 | 12.4 |
| 2024–2025 | 62.6 | 62.6 | 0.0 | 0.0 |
Cumulative changes, not annualized rates. All levels and absolute changes are thousands of jobs. Recovery of the 1997–2021 loss is a separate ratio: 6.9 / 40.8 = 16.9%.
Evidence & method
How we calculated it
- Secondary descriptive analysis of BLS Industry Productivity series IPUJN511130W200000000; 39 consecutive annual observations, 1987–2025; accessed October 30, 2026.
- Independently extract the exact identifier, check metadata, unique years, A01 period and empty footnotes; compare all values with the analytical CSV. Preserve BLS 2017 NAICS 511130 without splicing 2022 NAICS 513130.
- Cumulative change = 100 × (end − start) / start. Recovered loss = 100 × (employment 2025 − employment 2021) / (employment 1997 − employment 2021). Extrema are descriptive within the available window.
- Use decimal arithmetic on published levels; no modeling, imputation, smoothing or inferential testing. Download script reproduces calculations and optionally validates a separately obtained frozen raw file.
What the data cannot tell us
- Industry jobs are not unique people, authors, full-time equivalents, bookstore establishments or a census of self-publishing.
- 2017 NAICS 511130 is not the broader 2022 513130 category, which also incorporates Internet book publishers from 519130. A continuous identifier does not prove invariant source methods.
- Rounded 0.1-thousand-job levels do not convey uncertainty intervals. Equal 2024 and 2025 displays do not establish exact equality. Data may be revised.
- No causal effect of AI, digital technology, ebooks, the pandemic or strategy is identified. No revenue, sales, profitability, royalties, worker-pay or job-quality conclusion follows.
Original sources
- BLS Industry Productivity bulk observations
BLS Industry Productivity bulk observations: Series IPUJN511130W200000000; 39 annual observations, 1987–2025; snapshot hash retained separately.
Accessed October 30, 2026
- BLS series catalog
BLS series catalog: Annual employment, thousands of jobs; 2017 NAICS 511130; U.S. total; current metadata independently rechecked.
Accessed October 30, 2026
- BLS industry dictionary
BLS industry dictionary: N511130 maps to book publishers, NAICS 511130.
Accessed October 30, 2026
- BLS measure dictionary
BLS measure dictionary: W20 denotes employment in thousands of jobs.
Accessed October 30, 2026
- BLS technical note, selected service industries
BLS technical note, selected service industries: Employment draws primarily on CES jobs supplemented with CPS self-employed and unpaid-family-worker information; additional sources for some industries.
Accessed October 30, 2026
- BLS service-industry table 2
BLS service-industry table 2: Current release labels its industry classification as 2017 NAICS.
Accessed October 30, 2026
- U.S. Census Bureau, 2022 NAICS manual
U.S. Census Bureau, 2022 NAICS manual: Concordance p. 617 maps 2022 513130 to 2017 511130 plus the Internet-book-publisher portion of 519130.
Accessed October 30, 2026
- BLS revisions policy
BLS revisions policy: Revisions can reflect updated source data and statistical definitions; do not assume a frozen vintage is permanently final.
Accessed October 30, 2026
- BLS linking and copyright information
BLS linking and copyright information: BLS public-domain materials may be reused with attribution; copyrighted photographs and illustrations excluded; no emblem or endorsement implied.
Accessed October 30, 2026
Cite & reuse this study
Alisson Bento. US book-publishing jobs recovered one-sixth of their peak-to-trough loss by 2025. Secondary analysis of U.S. Bureau of Labor Statistics Industry Productivity data, 1987–2025. Sources accessed October 30, 2026. https://alissonbento.com/research/us-book-publishing-employment-recovery-1987-2025/
Employment data: U.S. Bureau of Labor Statistics, Industry Productivity; source numeric data are public domain under BLS reuse policy. Classification concordance: U.S. Census Bureau. Original selection, calculations and explanation: Alisson Bento. No agency emblem, endorsement or article-wide license is implied.
Corrections or editorial questions