
A reading total leaves the shape of the day unanswered
Two diary days can contain the same amount of personal-interest reading yet organize it differently. One might place all its reading-coded time together; another might distribute that time across periods separated by other primary-activity codes. A daily total treats those arrangements alike. The question here is narrower than how much Americans read: when a diary contains personal-interest reading, how concentrated is that coded time, and how often does the reading code return after another primary code? This makes the organization of the day visible without treating a time diary as a record of every mental shift.
The evidence comes from the 2024 American Time Use Survey, covering people aged 15 and older, including those aged 15–17. Among 7,669 respondent diaries, 1,574 contain positive time under the personal-interest-reading code. These observed reading-coded days form the conditional analytical sample for the main analysis. Each respondent supplies one recalled diary, spanning 4 a.m. to 4 a.m. The results therefore describe the weighted distribution of reading-coded days in 2024, not a repeatedly observed routine for any individual and not the proportion of people who habitually divide their reading.
For readers and libraries, this distinction changes the question worth asking. Instead of searching for a single ideal session length, the analysis separates the presence of several reading periods from the concentration of minutes within them. A day can contain multiple runs while still placing most reading-coded time in one large run. Conversely, a measure that gives greater influence to days with more reading minutes can reveal a less concentrated pattern. Neither arrangement establishes whether reading was satisfying, difficult, voluntary, or interrupted.
What counts as reading in this study
The analysis follows the official 2024 activity lexicon rather than substituting an everyday definition of reading. Code 120312, “Reading for personal interest,” includes books, newspapers, magazines, audiobooks, e-readers, personal research, and being read to, and library activities such as borrowing, checking out, returning, and browsing. That breadth is important for a library audience: some coded minutes may describe obtaining or exploring material rather than consuming a continuous text. Calling every run a book-reading session would narrow the source definition without evidence and give the resulting percentages a meaning they do not possess.
The code is also not a measure of all reading. Reading associated with work, school, children, or religious activity can fall elsewhere in the classification. Most secondary activity is outside this primary-activity measure. A person might engage with text or audio while another activity receives the diary's primary code, but these data do not supply a complete inventory of that engagement. The appropriate phrase throughout is therefore “reading-coded time,” with “personal-interest” specifying the official category rather than a judgment about the reader's motivation or experience.
These boundaries matter when connecting the findings to books and library services. The analysis cannot distinguish a novel from a newspaper, identify a genre, count completed books, or separate every format represented within the category. It also cannot determine which runs involved a library. What it can show is how time assigned to this broad reading-related category is arranged within a diary. That is useful evidence about temporal organization, provided the category remains visible rather than disappearing behind a more attractive but unsupported label such as sustained book reading.
From activity records to reported runs
A reported run is a maximal sequence of adjacent primary-activity records coded 120312. If two reading-coded records touch in the diary sequence, they are merged into one run. A new run begins only after at least one intervening record has another code. This definition avoids treating a coding split as evidence that reading stopped and later resumed. It also preserves the distinction between the survey's activity records and the analytical unit constructed from them. Neither a raw record nor a merged run is an additional respondent.
Across the reading-coded diaries, 2,291 raw reading-coded records become 2,274 merged runs. Seventeen observed days contain adjacent split records, and seven days would be classified as multi-run using raw records but not after merging. These are finite sample counts, not weighted population estimates. The affected groups do not meet the analysis's minimum support requirement for public percentage estimates. Their counts explain why adjacency is handled explicitly; they do not support a population headline about the frequency or impact of coding splits.
The word “run” should not be mistaken for uninterrupted cognition. A diary sequence does not reveal a glance away from a page, a brief conversation omitted from recall, or a change in concentration within a coded period. Likewise, two separated runs need not represent an unwanted interruption. Someone could deliberately read at different times. The observed fact is simply that another primary-activity code lies between reading-coded periods. Keeping the unit this modest allows the sequence analysis to answer a real question without turning coding continuity into a psychological measurement.
Most reading-coded days have one run, but many return to reading
Within the weighted distribution of reading-coded days, 72.006293% have one run, 19.964115% have two, and 8.029592% have three or more. The corresponding observed counts are 1,090, 335, and 149 days. Combining the latter two groups gives a multi-run share of 27.993707%, supported by 484 observed diaries. Its 95% interval is 25.248699% to 30.738715%. Thus, a single run is the majority arrangement, while returning to the reading code after another activity is a substantial minority arrangement within this conditional set.
The denominator is essential. These percentages do not describe all 7,669 diary days, nor all Americans, nor only adults aged 18 and older. They describe days on which the survey recorded some code-120312 time among people aged 15 and older. They also do not reveal whether the same person usually follows that arrangement. A respondent observed with two runs could have a different pattern on another day. The survey design supports a weighted daily description, not a classification of people into stable single-session and fragmented-reading types.
The three categories answer a count question rather than a duration question. A two-run day could contain one dominant period and a short return, or two more evenly sized periods; the count alone does not distinguish them. Similarly, the open-ended category of three or more runs does not establish how evenly minutes are distributed across those runs. This is why run counts and largest-run concentration belong together. The first describes recurrence within the coded sequence; the second asks how much of that day's reading-coded time remains gathered in its largest period.
The day-weighted view: one run usually holds most of the time
To measure concentration, the analysis first identifies each reading-coded day's largest run and divides its minutes by that day's total reading-coded minutes. A one-run day necessarily has a fraction of 100%. On a multi-run day, the fraction is smaller because some reading-coded minutes occur elsewhere. The day-weighted estimate averages these daily fractions using the survey's final weights. It is 88.789356%, with a 95% interval of 87.670100% to 89.908611%. The question it answers is: how concentrated is a reading-coded day when days are the objects being averaged?
This is not the claim that 88.79% of days have one dominant run under an additional threshold. No such threshold is introduced. It is an average of continuous daily fractions, combining the complete concentration of one-run days with the varying concentration of multi-run days. Nor does the estimate say that every reader devotes about nine-tenths of reading time to one sitting. Individual daily fractions vary, and the survey provides only one observed day per respondent. The statistic summarizes those weighted fractions rather than prescribing a personal pattern.
For an interested reader, this explains why the multi-run finding need not imply an evenly scattered day. Returning to reading and concentrating most reading-coded minutes in one run are compatible. A small additional run changes the count from one to two while leaving the largest-run fraction high. The evidence therefore resists a simple contrast between completely continuous reading and pervasive fragmentation. Its more useful distinction is between how often reading-coded time recurs and how strongly the largest run dominates the day's total.
The minute-weighted view tells a different, compatible story
The minute-weighted calculation uses the same 1,574 observed reading-coded days but asks a different question. It divides pooled weighted minutes in each day's largest run by pooled weighted reading-coded minutes overall. The resulting share is 77.763709%, with a 95% interval of 75.703107% to 79.824310%. Unlike the average of daily fractions, this ratio gives greater influence to days contributing more reading-coded minutes. It describes the allocation of the minute pool, not the concentration of a day selected through the day-weighted calculation.
The lower minute-weighted result is informative rather than contradictory. It indicates that allowing days with more reading-coded minutes to contribute more heavily reduces the measured concentration. The day-weighted estimate and minute-weighted estimate describe different aspects of the same observed support, not incompatible populations. They should not be averaged, stacked into a composition, or treated as competing estimates of one quantity. Nor should uncertainty for their difference be calculated by subtracting or independently combining their displayed standard errors: both are derived from the same respondent-day data.
The complement of the minute-weighted share is 22.236291%: reading-coded minutes outside one selected largest run per day. This is an alternative expression of the same ratio, not a separate discovery. It also is not the share of reading time interrupted by distractions. Those minutes remain reading-coded minutes, simply located in other runs. For readers comparing claims about concentration, the practical lesson is to ask what receives weight. A statement about a typical coded day can look more concentrated than a statement about where the pooled coded minutes occur, with both statements accurately describing their own denominator.
Between runs: elapsed separation, not a measured attention break
For the 484 observed multi-run days, the analysis examines records not coded 120312 lying between the first and last reading-coded runs. The mean is 8.9453 intervening records and 378.2263 intervening minutes per multi-run day. The 95% interval for total intervening minutes is 348.8572 to 407.5954. These are totals across the intervening portions of a day, not the average duration of a single gap. A diary with several returns to reading can contribute several intervening stretches to this one daily total.
The distinction prevents a particularly misleading interpretation: the result does not show that a typical reader takes a 378-minute break from a book. It concerns only days with multiple reading-coded runs, combines all time between those runs that is not assigned code 120312, and may span widely separated parts of the diary. Activities before the first run and after the last run are outside this calculation. The measure locates separation within the observed day; it does not identify a planned reading session that was suspended and then resumed.
“Not reading-coded” is also more accurate than “nonreading behavior.” Some intervening records belong to unknown or unclassifiable Data Codes, and other primary categories do not rule out every simultaneous encounter with text or audio. The sequence cannot establish what caused a run to end. A meal, travel record, or household activity occurring between reading-coded runs is evidence of temporal placement, not evidence that it displaced reading. For a library discussion of interruptions, the useful contribution is therefore a boundary: substantial separation is observable, while attention loss, frustration, and forced stopping are not.
What occupies the intervening coded time
The category table retains all 18 official first-tier categories rather than selecting only the largest or most striking entries. Its denominator is pooled weighted intervening time between first and last reading-coded runs, excluding code 120312 itself. Socializing, relaxing, and leisure accounts for 27.38% of those minutes; household activities account for 18.90%; eating and drinking, 11.06%; and personal care, 9.29%. These are shares of intervening minutes, not percentages of readers who undertook each activity and not shares of the entire diary day.
The category labels require care. The leisure category excludes the reading code under study, but its remaining minutes do not become evidence that leisure competes causally with reading. Work and work-related activities represent 8.80% of intervening minutes, while traveling represents 6.86%; neither figure explains why reading ended or what would happen if those activities changed. Observed support is shown separately because an activity's presence on many days and its contribution to the minute pool are different properties. One cannot substitute the support count for the weighted minute share.
Data Codes remain a separate category: 50 observed support days contribute 1.35675% of intervening minutes before table rounding. Those records are unknown or unclassifiable, not confirmed nonreading behavior. Several other categories have their weighted estimates withheld under the analyst's support and precision screen, while their names and counts remain visible. Consequently, readers should not fill in missing shares, infer that suppressed categories are absent, or expect the displayed reportable percentages alone to sum to 100%. Preserving the full category menu shows both the breadth of intervening activity and the limits of what can be estimated reliably.
A diary boundary is not necessarily a reading boundary
The survey's target day begins and ends at 4 a.m. A run touching either edge may be part of activity extending beyond the observed window, so the analysis includes a boundary sensitivity calculation. Twenty-seven observed reading-coded days touch a boundary. Excluding them leaves 1,547 reading-coded days, compared with 1,574 in the main analysis. The main frame remains the principal description; the smaller frame asks how the estimates look when edge-touching cases are omitted. It does not reconstruct the unobserved time outside the diary.
In the nonboundary subset, the multi-run estimate is 27.377105%, with a 95% interval of 24.607955% to 30.146255%. The day-weighted largest-run fraction is 89.05935%, and the minute-weighted largest-run share is 78.84581%. These values retain the broad descriptive pattern of majority single-run days and a more concentrated day-weighted than minute-weighted view. They are not a before-and-after comparison: the observed support changes. Similar-looking results do not prove the absence of boundary effects, and the analysis does not supply a causal estimate of what the boundary does.
The duration measure follows the official target window. One final activity not coded as reading has an unexplained 30-minute discrepancy between its raw extended clock and unbounded duration. Its bounded duration and cumulative 4 a.m.–4 a.m. sequence are consistent, so it is retained unchanged rather than repaired or excluded. This qualification matters because a valid 1,440-minute bounded sequence does not establish universal agreement among every extended-clock field. The analysis uses the source-defined bounded measure while leaving that separate raw-clock discrepancy explicitly unresolved.
Why a day-average duration is not a run-average duration
A further denominator check concerns mean run duration. One approach calculates each day's average run length and then averages those daily values with survey weights. It produces 72.16138 minutes. Another averages across runs, repeating the original diary weight for each run, and produces 74.88477 minutes. The first gives a day one daily mean to contribute; the second allows days with more runs to contribute more run observations. Both remain based on respondent-day sampling, so runs are not treated as independent survey respondents when uncertainty is calculated.
These supporting results should not become a new headline about a statistically significant duration difference. Their purpose is to make the unit of averaging visible. The table also reports unweighted sample means, which describe the observed sample rather than replacing the weighted population summaries. Neither average is a recommended reading-session length. The measured category is broader than books, and an average run does not reveal the length that suits a particular reader, format, task, or library setting. Turning it into a target would add a recommendation unsupported by the study.
Precision rules serve a different purpose from these denominator choices. Public estimates require at least 30 observed numerator-support days and a replicate relative standard error no greater than 30%. This is an analyst reliability screen, not a BLS publication rule or a disclosure-protection rule. It withholds the weighted adjacent-split percentage, the raw-versus-merged multi-run contrast, and boundary prevalence because their supports are too small. Displaying the corresponding counts explains the diagnostics without giving unstable weighted estimates an appearance of authority. The same screen is applied to the fixed intervening-category table.
What readers and libraries can take from the sequence
The contribution is a linked description of recurrence, concentration, and intervening coded time within 2024 reading-coded diaries. Most such days contain one run; a substantial minority contain returns to the code; and the pooled reading-minute view is less concentrated than the average daily-fraction view. Together these findings explain something a daily total cannot: reading-related time can be gathered into one dominant period while also appearing elsewhere in the day. The analysis does not establish a decline, compare years, or identify a new kind of reader.
This question builds on existing research rather than inventing temporal analysis. Bone and colleagues' 2025 study examines ATUS reading participation, duration, social context, location, and trends. Flood, Hill, and Genadek's work on daily temporal pathways uses activity timing and sequence to distinguish daily totals from temporal organization. Drago's 2011 work distinguishes secondary activity from short sequential episodes, a warning directly relevant to interpreting runs here. The present analysis applies these established distinctions to a bounded set of run and concentration measures; it makes no claim of methodological priority or comprehensive exclusion of earlier work.
For a library reading group or a reader examining their own schedule, the useful application is a better vocabulary for questions, not a behavioral prescription. One can distinguish a return to reading from an attention failure, a dominant daily run from an entire day devoted to reading, and the average day's concentration from the concentration of pooled minutes. A future study of book formats, reader preferences, or library use would need direct measures of those subjects. These diaries cannot supply them by implication. Their narrower contribution is still concrete: they show how the recorded personal-interest-reading category occupies and reappears within a day.
How many reading-coded runs occur in one diary day?
United States · ATUS 2024 · 1,574 observed reading-coded diary days
Full chart and source

Scroll horizontally to inspect the chart. ↔
Chart and values
Scroll horizontally to see all columns.
| Runs | Observed diary days | Weighted share (%) | 95% interval |
|---|---|---|---|
| One | 1,090 | 72.01 | 69.26–74.75 |
| Two | 335 | 19.96 | 17.37–22.56 |
| Three or more | 149 | 8.03 | 6.58–9.48 |
ATUS 2024, code 120312; not book-only reading. The three bins share the same weighted conditional denominator, supported by 1,574 observed reading-coded diary days. Normal 95% replicate intervals use diary-level weights, not independent-run sampling.

Largest-run concentration: two different denominators
United States · ATUS 2024 · 1,574 observed reading-coded diary days
Full chart and source
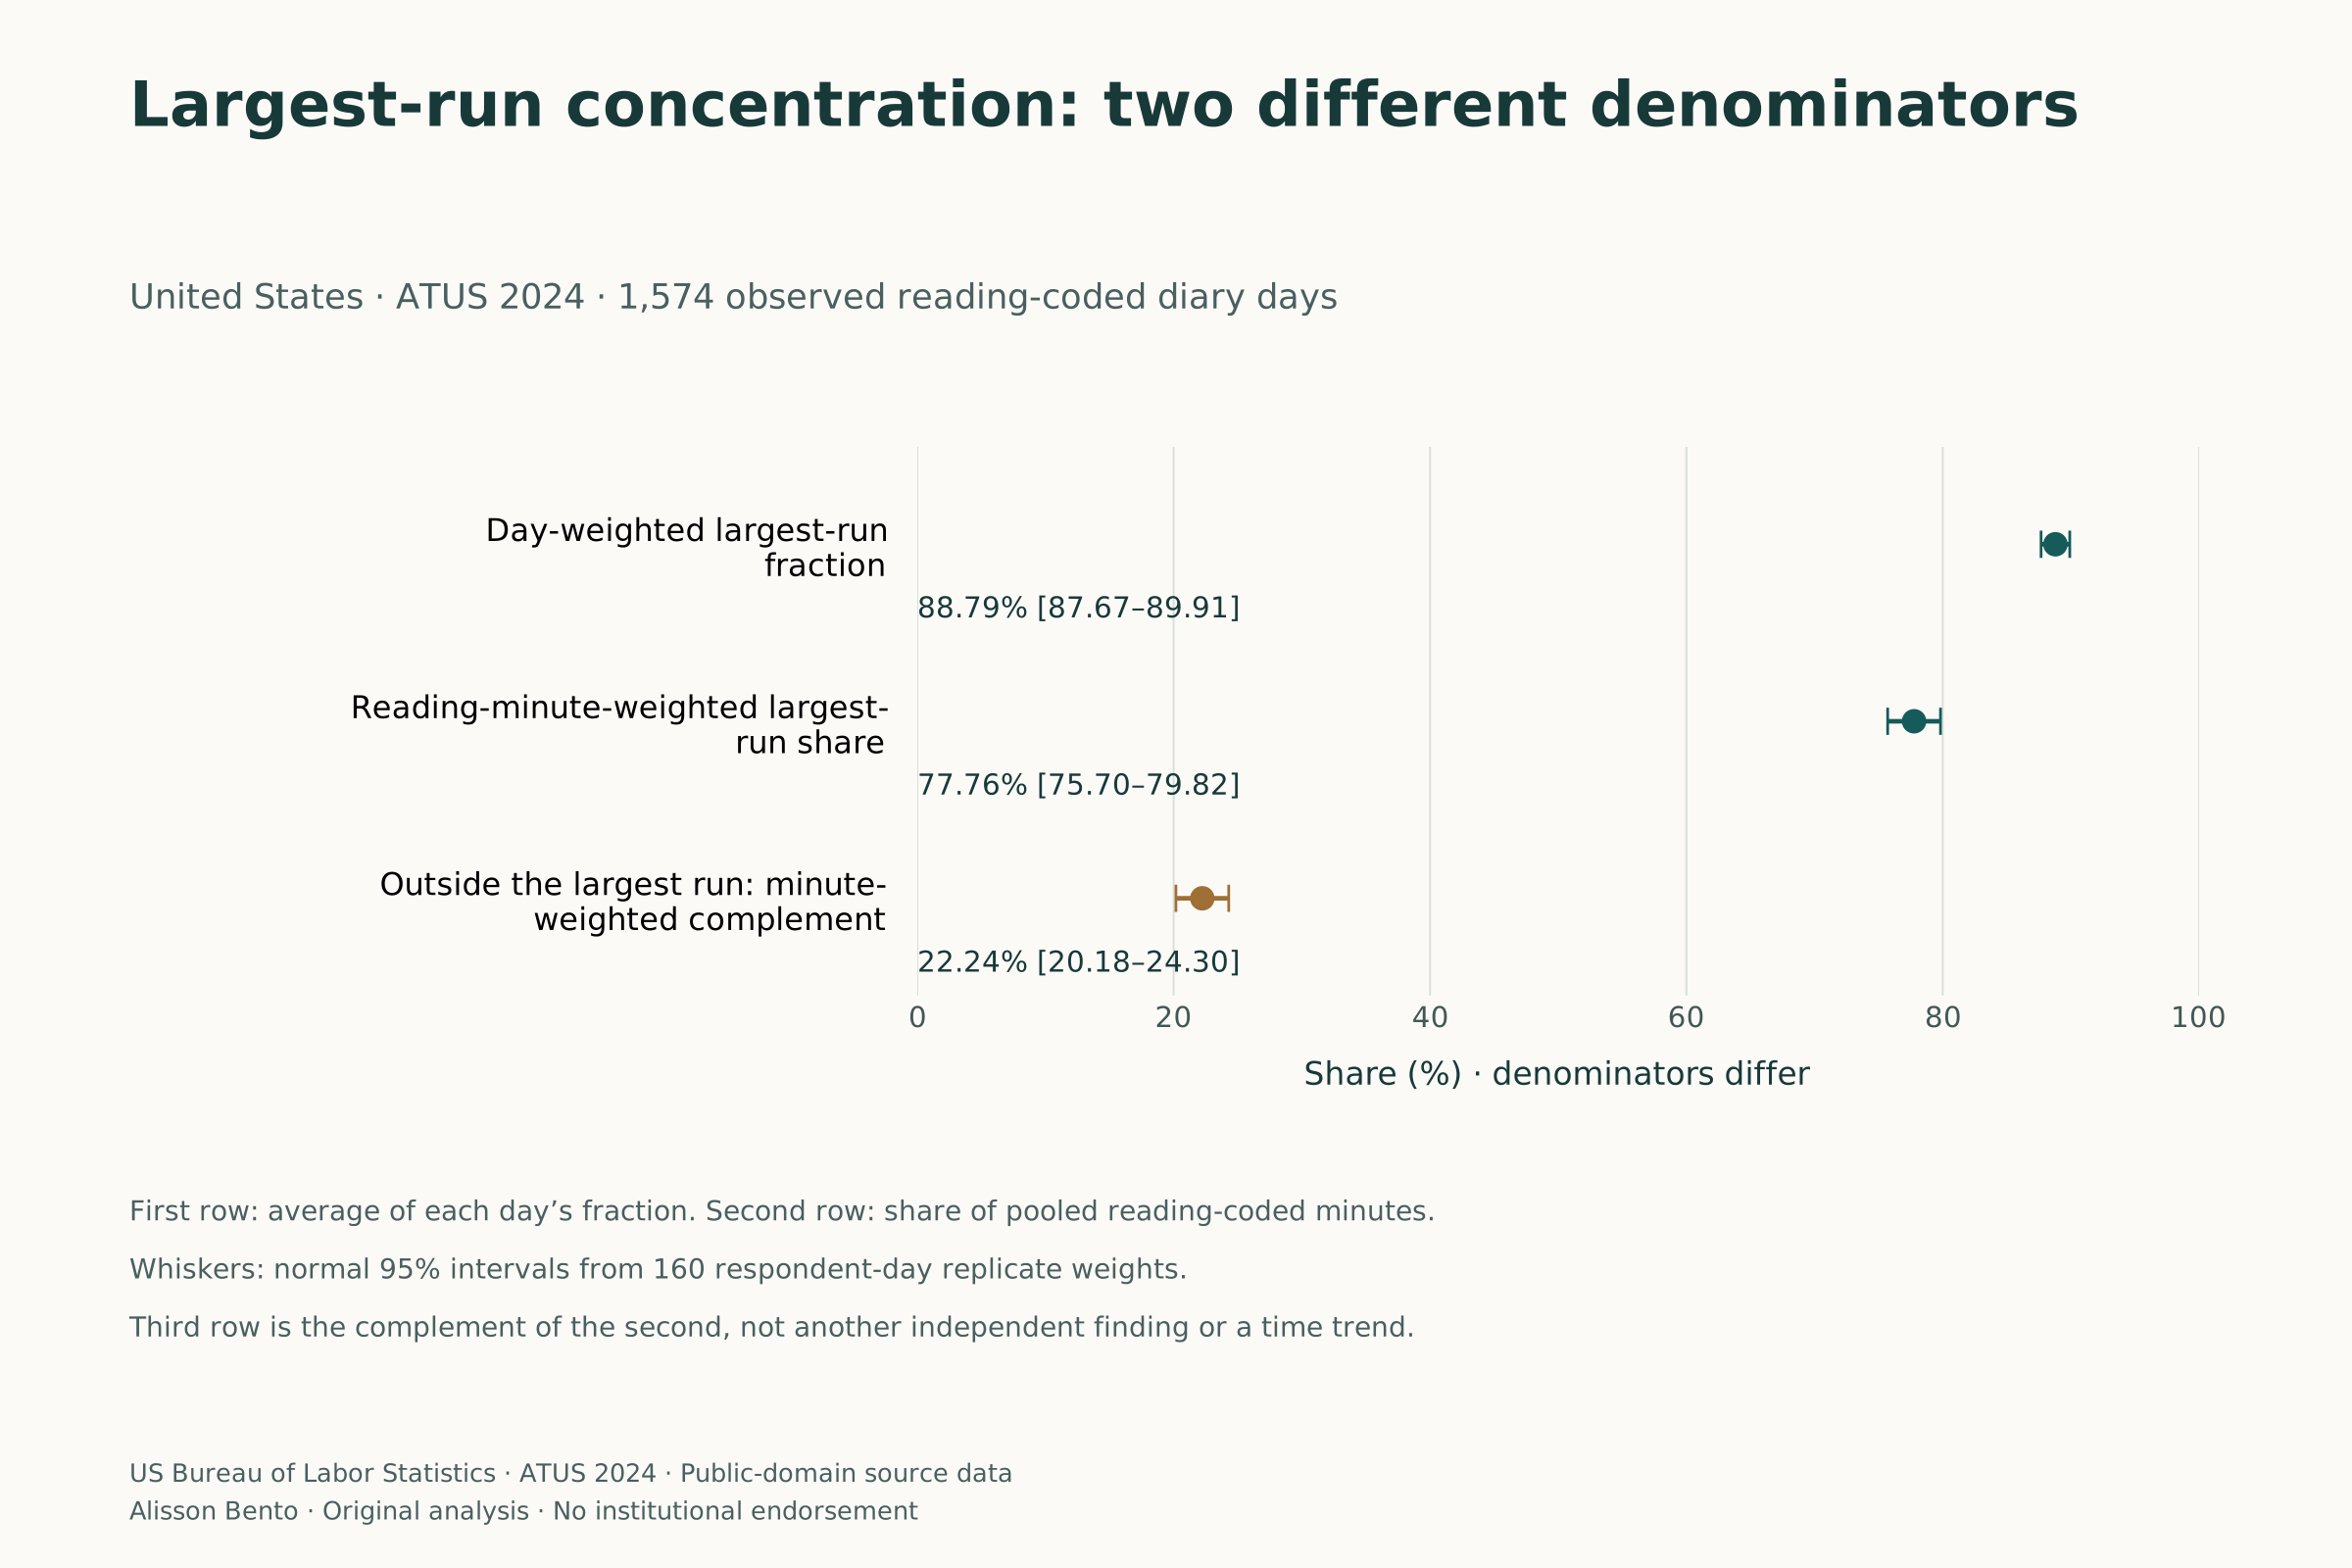
Scroll horizontally to inspect the chart. ↔
Chart and values
Scroll horizontally to see all columns.
| Measure | Estimate (%) | 95% interval | Observed positive-numerator days |
|---|---|---|---|
| Day-weighted largest-run fraction | 88.79 | 87.67–89.91 | 1,574 |
| Reading-minute-weighted largest-run share | 77.76 | 75.70–79.82 | 1,574 |
| Reading-coded minutes outside one largest run per day | 22.24 | 20.18–24.30 | 484 |
The same 1,574 observed reading-coded days support both denominators. Day weighting first forms each day’s largest-run fraction. Minute weighting divides pooled weighted largest-run minutes by pooled weighted total minutes. The final row is a complement, not an additional independent finding.

Data & downloads
Scroll horizontally to see all columns.
| Runs | Observed diary days | Weighted share (%) | 95% interval |
|---|---|---|---|
| One | 1,090 | 72.01 | 69.26–74.75 |
| Two | 335 | 19.96 | 17.37–22.56 |
| Three or more | 149 | 8.03 | 6.58–9.48 |
ATUS 2024, code 120312; not book-only reading. The three bins share the same weighted conditional denominator, supported by 1,574 observed reading-coded diary days. Normal 95% replicate intervals use diary-level weights, not independent-run sampling.
Scroll horizontally to see all columns.
| Measure | Estimate (%) | 95% interval | Observed positive-numerator days |
|---|---|---|---|
| Day-weighted largest-run fraction | 88.79 | 87.67–89.91 | 1,574 |
| Reading-minute-weighted largest-run share | 77.76 | 75.70–79.82 | 1,574 |
| Reading-coded minutes outside one largest run per day | 22.24 | 20.18–24.30 | 484 |
The same 1,574 observed reading-coded days support both denominators. Day weighting first forms each day’s largest-run fraction. Minute weighting divides pooled weighted largest-run minutes by pooled weighted total minutes. The final row is a complement, not an additional independent finding.
Scroll horizontally to see all columns.
| Measure | Estimate | 95% interval | Unit |
|---|---|---|---|
| Mean intervening records not coded as code 120312 | 8.95 | 8.16–9.73 | activity records |
| Mean intervening minutes not coded as code 120312 | 378.23 | 348.86–407.60 | minutes |
Among 484 observed multi-run diary days. Intervening time is not coded 120312 and includes Data Codes; it is not demonstrated distraction or a reason for stopping. Mean minutes are total intervening time per multi-run day, not the mean length of an individual break.
Scroll horizontally to see all columns.
| Tier | Official category | Observed days with such minutes | Weighted minute share (%) | 95% interval | Status |
|---|---|---|---|---|---|
| 01 | Personal care | 252 | 9.29 | 7.10–11.48 | reportable |
| 02 | Household activities | 363 | 18.90 | 16.75–21.06 | reportable |
| 03 | Caring for and helping household members | 39 | 2.17 | 1.03–3.30 | reportable |
| 04 | Caring for and helping nonhousehold members | 30 | Withheld: analyst precision screen | Withheld: analyst precision screen | withheld |
| 05 | Work and work-related activities | 48 | 8.80 | 5.24–12.36 | reportable |
| 06 | Education | 5 | Withheld: analyst precision screen | Withheld: analyst precision screen | withheld |
| 07 | Consumer purchases | 120 | 3.38 | 2.07–4.69 | reportable |
| 08 | Professional and personal care services | 21 | Withheld: analyst precision screen | Withheld: analyst precision screen | withheld |
| 09 | Household services | 9 | Withheld: analyst precision screen | Withheld: analyst precision screen | withheld |
| 10 | Government services and civic obligations | 3 | Withheld: analyst precision screen | Withheld: analyst precision screen | withheld |
| 11 | Eating and drinking | 403 | 11.06 | 9.84–12.28 | reportable |
| 12 | Socializing, relaxing, and leisure | 343 | 27.38 | 24.77–29.99 | reportable |
| 13 | Sports, exercise, and recreation | 102 | 3.74 | 2.74–4.74 | reportable |
| 14 | Religious and spiritual activities | 19 | Withheld: analyst precision screen | Withheld: analyst precision screen | withheld |
| 15 | Volunteer activities | 29 | Withheld: analyst precision screen | Withheld: analyst precision screen | withheld |
| 16 | Telephone calls | 72 | 2.24 | 1.44–3.04 | reportable |
| 18 | Traveling | 232 | 6.86 | 4.84–8.89 | reportable |
| 50 | Data codes | 50 | 1.36 | 0.84–1.87 | reportable |
All fixed first-tier categories for minutes between the first and last reading-coded runs, excluding code 120312. Category 12 excludes code 120312. Category 50 is Data Codes, including unknown or unclassifiable records, not confirmed nonreading behavior. The analyst reliability screen requires at least 30 observed positive-numerator days and relative SE no greater than 30%; it is not an official BLS rule. Reportable rows do not alone sum to 100% because estimates for seven categories are withheld.
Scroll horizontally to see all columns.
| Measure | Main estimate | Main 95% interval | Nonboundary estimate | Nonboundary 95% interval |
|---|---|---|---|---|
| At least two time-separated reported reading-coded runs | 27.99 | 25.25–30.74 | 27.38 | 24.61–30.15 |
| Day-weighted largest-run fraction | 88.79 | 87.67–89.91 | 89.06 | 87.92–90.20 |
| Reading-minute-weighted largest-run share | 77.76 | 75.70–79.82 | 78.85 | 76.77–80.92 |
The main frame is retained. Only this prespecified sensitivity excludes reading-coded days touching either 4 a.m. boundary, reducing observed support from 1,574 to 1,547. Boundary prevalence is withheld because only 27 observed days meet the condition. These differently supported summaries are not a causal before/after comparison.
Scroll horizontally to see all columns.
| Measure | Weighted minutes | 95% interval | Unweighted sample minutes |
|---|---|---|---|
| Day-weighted within-day mean run duration | 72.16 | 68.50–75.83 | 75.93 |
| Run-weighted mean run duration | 74.88 | 70.86–78.91 | 77.64 |
A supporting denominator diagnostic, not a claim of changing habits or a tested difference. Run averages repeat original diary weights per run; variance remains at respondent-day level. Unweighted values describe this finite sample only.
Scroll horizontally to see all columns.
| Diagnostic | Observed count | Estimate policy |
|---|---|---|
| Respondent diary days | 7,669 | All official 2024 records; positive weights |
| Reading-coded diary days | 1,574 | Conditional analysis support |
| Raw reading-coded activity records | 2,291 | Do not call these independent people |
| Merged reported reading-coded runs | 2,274 | Adjacent code-120312 records merged |
| Days with adjacent split records | 17 | Weighted percentage withheld |
| Raw-multi but not merged-multi days | 7 | Weighted percentage-point contrast withheld |
| Reading-coded days touching a boundary | 27 | Weighted prevalence withheld |
Unweighted finite-sample counts. Weighted adjacent-split and raw-minus-merged multi-run contrasts are withheld under the predeclared screen, with 17 and seven positive-numerator days respectively. Marginal standard errors must not be subtracted to invent uncertainty for the paired contrast. No respondent rows or identifiers are disclosed.
Evidence & method
How we calculated it
- Observation period: 2024 ATUS diaries for respondents aged 15 and older. Official source materials were retrieved on 2026-10-30; that retrieval date is not the observation year. Inputs comprise Respondent, Activity, Activity Summary, and 160-replicate-weight files.
- The full sample contains 7,669 diaries and 139,535 activity rows, with positive final weights. The conditional analysis uses 1,574 days with positive code-120312 minutes. Ordered activities use TUCASEID and TUACTIVITY_N; bounded TUACTDUR24 durations define the 1,440-minute target day.
- Runs merge maximal adjacent records coded 120312. Daily measures include run count, largest-run minutes divided by total reading-coded minutes, and intervening records and minutes between first and last runs. All 18 fixed first-tier categories are retained for intervening time.
- Estimates use TUFINLWGT. Every ratio is recalculated for each of FINLWGT001 through FINLWGT160 at the original respondent-day level. Variance is (4/160) times the sum of squared replicate departures from the full-sample estimate; normal 95% intervals equal the estimate plus or minus 1.96 standard errors.
- Day-weighted concentration averages daily largest-run fractions; minute-weighted concentration divides pooled weighted largest-run minutes by pooled weighted reading-coded minutes. Run-average duration repeats the diary weight per run, while uncertainty remains based on respondent-day replicates.
- The fixed analyst reporting screen requires numerator support of at least 30 observed days and replicate relative standard error no greater than 30%. A prespecified sensitivity excludes 27 boundary-touching reading-coded days but retains the main frame. Public reproduction materials are limited to aggregate sufficient statistics, support metadata, and source hashes, not respondent-level records.
What the data cannot tell us
- Code 120312 includes books, periodicals, audio, e-readers, personal research, and some library activities; it is neither book-only nor a measure of all reading.
- The age range is 15 and older, including ages 15–17. Main percentages are conditional on a reading-coded diary day, not percentages of all people or all diary days.
- One recalled 4 a.m.–4 a.m. diary per respondent cannot establish habits, individual change, or a person's usual reading arrangement.
- Adjacent primary-code runs do not measure uninterrupted attention, momentary interruptions, reading quality, content, genre, completion, or most simultaneous reading.
- Intervening totals cover all not-reading-coded time between first and last runs on multi-run days; they are not average gap lengths, proven distractions, or reasons for stopping. Data Codes remain explicitly unknown or unclassifiable.
- Different concentration weights answer different questions. Their estimates are dependent, and the complement of minute-weighted concentration is not an independent finding.
- Small-support diagnostics and imprecise category estimates are withheld under analyst rules, not BLS official publication rules. Boundary sensitivity changes observed support and is not a causal comparison.
- One final non-reading-coded activity has an unexplained 30-minute raw extended-clock discrepancy. Its bounded duration and target-window sequence are consistent; it is retained unchanged. The analysis makes no causal, trend, or methodological-priority claim.
Original sources
- BLS: 2024 ATUS official microdata files
BLS official 2024 annual files page, modified 26 June 2025: Respondent, Activity, Activity Summary, and 160-replicate-weight files. Retrieved 2026-10-30; raw microdata are not redistributed. https://www.bls.gov/tus/data/datafiles-2024.htm
Accessed October 30, 2026
- BLS: 2024 ATUS coding lexicon with activity examples
BLS 2024 coding lexicon, pp. 47–48: code 120312 includes books, periodicals, audio, e-readers, personal research, and library activities; Data Codes remain separate. Retrieved 2026-10-30. https://www.bls.gov/tus/lexicons/lexiconwex2024.pdf
Accessed October 30, 2026
- BLS: 2024 ATUS interview data dictionary
BLS 2024 interview dictionary, June 2025 edition: record ordering and bounded TUACTDUR24 versus unbounded TUACTDUR. One unexplained extended-clock discrepancy is retained unchanged outside the bounded measure. Retrieved 2026-10-30. https://www.bls.gov/tus/dictionaries/atusintcodebk24.pdf
Accessed October 30, 2026
- BLS: ATUS User’s Guide, September 2026
BLS ATUS User’s Guide, September 2026, chapter 7 and PDF pp. 44–45: 160 annual replicates and variance formula; one-day primary-activity design. Retrieved 2026-10-30. https://www.bls.gov/tus/atususersguide.pdf
Accessed October 30, 2026
- BLS: Linking and Copyright Information
BLS linking and copyright policy: publications are public domain except previously copyrighted artwork; no emblem use or implied endorsement. Retrieved 2026-10-30. https://www.bls.gov/bls/linksite.htm
Accessed October 30, 2026
- Bone et al. (2025): The decline in reading for pleasure over 20 years of the ATUS
Bone and colleagues, 2025, The decline in reading for pleasure over 20 years of the ATUS: prior research on participation, duration, context, location, and trends. Retrieved 2026-10-30. https://pmc.ncbi.nlm.nih.gov/articles/PMC12496190/
Accessed October 30, 2026
- Flood, Hill and Genadek: Daily Temporal Pathways
Flood, Hill and Genadek, Daily Temporal Pathways, online 2016/issue 2018: prior activity timing and sequence analysis using 2006–2007 ATUS. Retrieved 2026-10-30. https://pmc.ncbi.nlm.nih.gov/articles/PMC5793932/
Accessed October 30, 2026
- Drago (2011): Secondary Activities in the 2006 ATUS
Drago, 2011, Secondary Activities in the 2006 ATUS, BLS Working Paper 446: distinguishes simultaneous activity from short sequential episodes. Retrieved 2026-10-30. https://www.bls.gov/osmr/research-papers/2011/pdf/ec110040.pdf
Accessed October 30, 2026
Cite & reuse this study
Alisson Bento. One Run or Several? How Reading-Coded Time Fits Within a Day. 2026, original research. https://alissonbento.com/research/us-reading-coded-runs-and-concentration-2024/
Original article prose and calculations are credited to Alisson Bento. US Bureau of Labor Statistics publications are public domain except for previously copyrighted photographs and illustrations; credit BLS, do not use its emblem, and do not imply endorsement. That source policy does not grant rights to books mentioned by an activity category, transfer rights in third-party research, or establish a blanket licence for this article. Bone and colleagues, Flood, Hill and Genadek, and Drago retain their respective source authorship. Reproduction materials for this analysis contain aggregates, support metadata, and source hashes only; full source microdata, respondent rows, and identifiers are not redistributed.
Corrections or editorial questions