
The question behind an apparently contradictory result
Imagine looking at an audiobook report and seeing a smaller amount beside an existing title. That line alone cannot show whether its owner’s combined result also fell. A second eligible title belonging to the same owner can share the allocation and change the portfolio total. This article examines that narrow accounting relationship with a fixed hypothetical model. It does not describe an observed statement, measure the effect of publishing another audiobook or estimate what authors typically earn.
The policy context is ACX’s published 2026 membership model. Its current Pay-for-Production terms distinguish a title’s allocated membership value from the percentage applied to that value. We turn that structure into an openly reproducible ownership comparison: keep a synthetic member-period pool and the royalty rate fixed, change the composition of the eligible title set, and separately track the existing title and its owner’s combined titles.
The result is useful when interpreting a report, briefing a collaborator or checking a spreadsheet. A per-title decline and a portfolio decline are different statements. The model makes that difference inspectable without inventing a fixed credit value, importing a retail price as revenue, or presenting a preferred distribution arrangement. All amounts below are chosen common units. They are not dollar estimates, sampled accounts or promised payouts.
What the published structure supplies
The source is ACX’s Royalty Payment Terms and Procedures for Rights Holders, Pay-for-Production Deals, Version 3.1, dated 26 May 2026, read on 31 October 2026. The help page carries a separate publication date of 29 May. Its membership rows state a 50% contractual rate for exclusive distribution and 30% for non-exclusive distribution, applied to Average Member Value Per Unit. The dates identify the captured policy context; they do not establish how every individual title’s agreement is configured.
In those terms, a title’s allocated value depends on Member Value and its Price Weighted Consumption Share. The weight is its a-la-carte price divided by the combined a-la-carte prices of the relevant products selected or purchased through member credit transactions or consumed through Qualified Listens in the accounting period. An unqualified sample, a title merely present in the catalogue, and a new publication that nobody selects are therefore outside this model’s eligible set.
Member Value is itself a defined accounting quantity, with membership and applicable reserve-credit components. It is not assumed to equal the subscription’s advertised price or one book’s list price. The companion overview explains the general proportional structure, but the more detailed terms define the transaction set used here. We do not reconstruct actual plan calculations, reserve-credit valuations or statements. The synthetic pool is an explicit input whose value remains fixed during each comparison.
Separate the allocation from the contractual percentage
Let M be the fixed hypothetical Member Value for one member and period. Let A be the sum of positive a-la-carte price weights for the owner’s eligible titles, and B the corresponding total for other owners’ eligible titles. When all of the modeled owner’s titles use the same rate r, the owner’s allocated value is M × A ÷ (A + B), and the modeled royalty is r times that allocation. A must be positive; B may be zero. Zero-priced or otherwise unsupported title weights are not silently imputed.
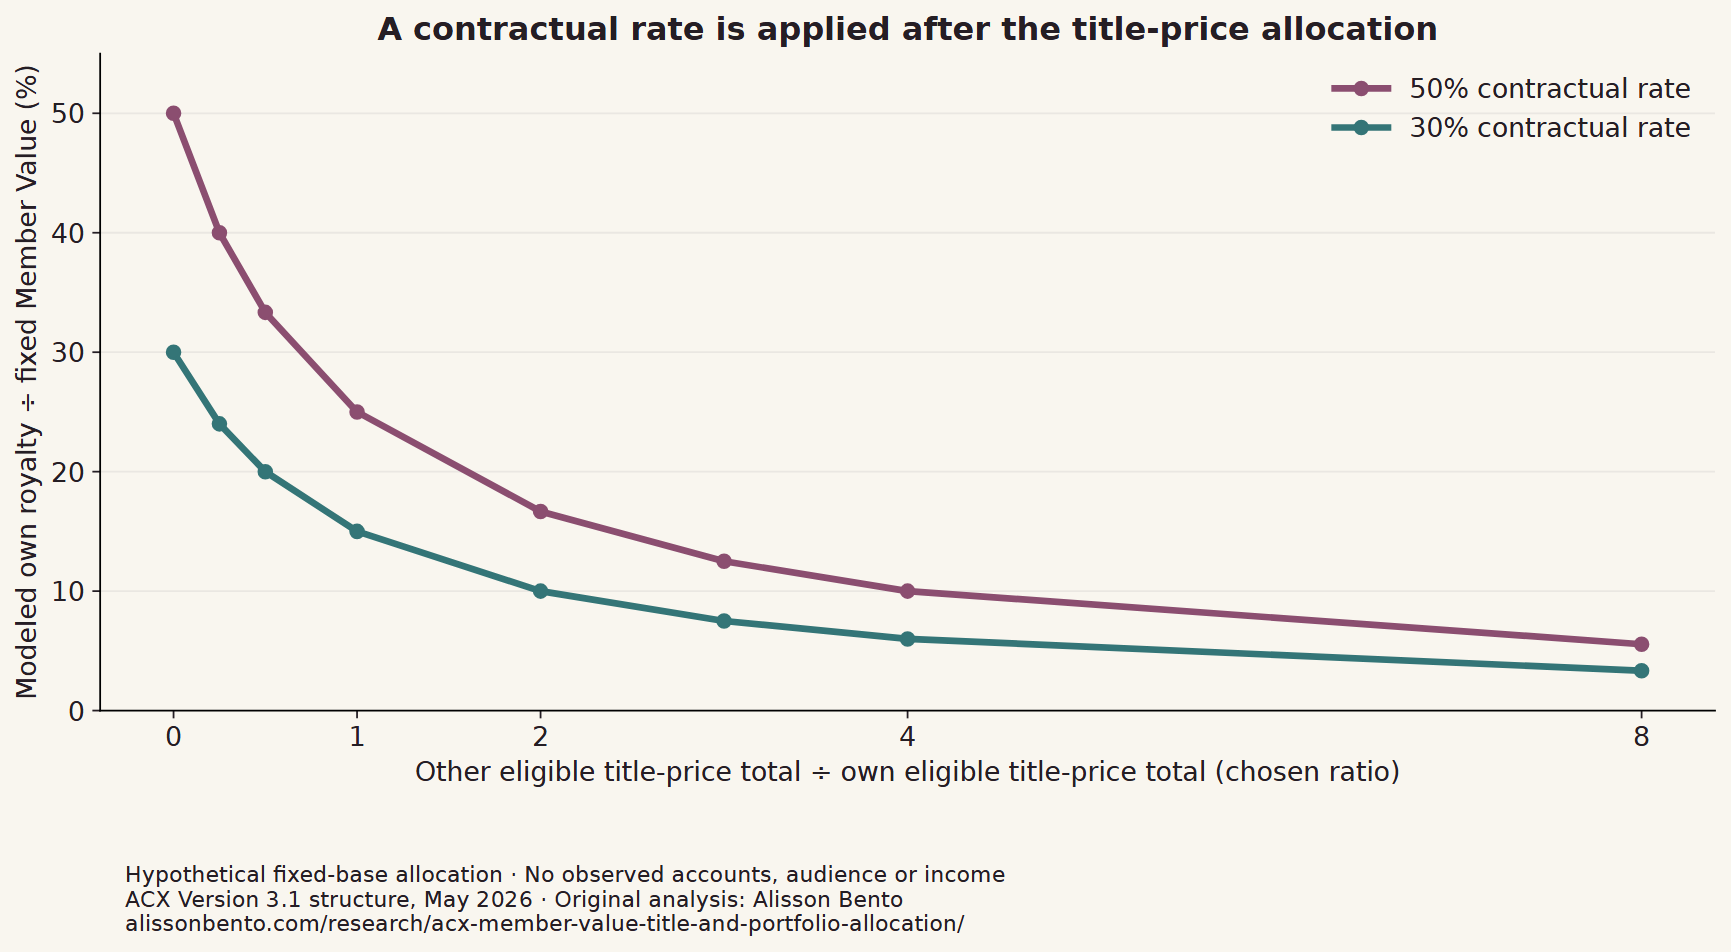
The two stages matter. A 50% contractual rate and a 50% share of the member pool are different percentages. If an owner’s eligible price weights account for one third of the combined total, the model allocates one third of M to that owner before applying the contractual rate. At a 50% rate, the resulting royalty is one sixth of M. That calculation says nothing about the share of a retail purchase, the platform’s accounting profit or the amount eventually deposited in a bank.
The formula also shows why a price ratio can be more informative than an isolated price. With the same positive M and rate, doubling both A and B leaves the allocation unchanged. Raising only A changes the share, while raising only B reduces it. Those are conditional mathematical comparisons, not evidence that an author can set effective platform prices or that changing a suggested price would leave listening, eligibility and the pool unchanged.
A complete three-case counterexample
Start with synthetic Member Value of 12 common units. One eligible title belongs to the focal owner and has a chosen price weight of 20. A second title belongs to someone else and has weight 10. Give both the same 50% royalty rate for this illustration. The focal title receives two thirds of the allocation, or 8 units, and its modeled royalty is 4. The other title receives 4 allocated units and a royalty of 2. The combined royalty is 6.
Now add a distinct eligible title with weight 30, belonging to the focal owner, while keeping the pool and every rate fixed. The combined price weight becomes 60. The existing own title receives a royalty of 2, the new own title 3, and the external title 1. The old title has fallen from 4 to 2, yet the focal owner’s combined royalty has risen from 4 to 5. The chart keeps those separate components visible rather than showing only the portfolio total.
Finally, return to the original two-title case and instead add a weight-30 title belonging to another owner. The existing own title again has a modeled royalty of 2, but the focal portfolio now contains no additional title and also totals 2. Identical added weight and identical contractual rates can therefore produce the same old-title decline with different ownership outcomes. This is a constructed comparison of eligible sets. It is not a claim that adding a book to a catalogue causes either scenario to occur.
What the fixed scenario grids test
The first downloadable grid combines four chosen pool values, five own-price totals, seven external-price totals and two contractual rates: 4 × 5 × 7 × 2 = 280 cases. The pool values are 5, 10, 15 and 20 common units; own-price totals are 5, 10, 20, 40 and 80; external totals are 0, 5, 10, 20, 40, 80 and 160. The rates are exactly three tenths and one half. Every combination is retained, including cases with no external weight.
A separate 150-row design holds the original own-title weight at 20, the pool at 12 and the rate at one half. It combines six own additions—0, 5, 10, 20, 30 and 40—with five external starting totals and five external additions. The public file reports the baseline royalty, the existing title’s later royalty, the portfolio’s later royalty and both changes. This permits inspection of cases where own and external eligible weights change together, rather than selecting only the illustrative result.
Twenty selected rows with an own addition, positive pre-existing external weight and no external addition have a falling old-title amount and a rising own-portfolio total. That count is a description of this deliberately designed grid. It is not a rate of cannibalization, the proportion of authors who benefit, a probability of a future outcome or a statistically representative estimate. The general algebra establishes the conditional direction; the grid provides inspectable worked instances and boundary cases.
Why the ownership boundary is a substantive input
An owner-level calculation must define which titles actually belong together for the question being asked. The same listener can select titles from unrelated rights holders, a publisher can hold rights in several titles, and a creator can have agreements involving additional participants. Our portfolio is a simple ownership grouping inside one hypothetical eligible set. It is not an ACX account audit, a corporate consolidation or a contractual determination of whose revenue should be shared.
Aggregation by a single A and a single r is valid here because the focal owner’s modeled titles all have the same contractual rate. If different titles have different rates or rights-holder splits, each title must be calculated separately before summing the relevant shares. Multiplying a combined price total by one convenient headline rate would then be a different model. The charts do not blend exclusive and non-exclusive titles into one apparently universal rate.
The constant total of 6 royalty units in the three-case illustration likewise depends on every eligible title having the same one-half rate and the pool remaining 12. If rates differ among titles, redistributing the pool can change the combined modeled royalty. The invariant being demonstrated is allocation conservation before rates: all title shares sum to the fixed pool. It is not a general claim that platform-wide royalty expense or every member’s contribution remains unchanged.
Read a real statement in the correct order
For an actual statement, first identify the agreement and transaction category that apply. The source separates membership distributions from a-la-carte and Member-Over-Plan cash sales, whose bases are defined as Net Receipts. This article models membership allocation only. A cash-sale row cannot be converted into a membership row by substituting the book’s retail price into the denominator, and an aggregate monthly unit count does not reveal how individual member-period allocations were formed.
Second, distinguish the title’s reported allocation base from its contractual percentage and any later split or deduction. A correct percentage attached to the wrong base can still produce an incorrect interpretation. If the required base is available on a statement, it is more relevant to that row than a guessed universal credit value. If it is unavailable, this model does not fill the gap with a market average, a subscription sticker price or a figure from another author’s account.
Third, decide whether the comparison concerns the same title, all of one owner’s eligible titles, or some wider business result. The chosen counterexample shows why those scopes can move differently. It cannot explain an actual month-to-month change without the underlying inputs, and it cannot attribute a decline to AYCL participation, pricing, a competitor’s release or listener behavior. Such explanations would require evidence about what changed, not only a possible mathematical mechanism.
Exact arithmetic, portable inputs and deliberate omissions
The downloadable Python recipe runs with the standard library and requires no account, network access, private transaction file or package installation. Its selected values are written directly into the recipe. It produces the complete allocation and ownership-addition CSV files and a summary. Fractions preserve the exact rational results; decimal columns are display aids. No half-cent rule or monetary rounding procedure is attributed to Audible, because these are common-unit allocations rather than reconstructed currency invoices.
The calculation verifies that the owner’s and external allocated values sum to M, that each royalty equals its selected rate multiplied by the relevant allocation, and that the modeled effective share cannot exceed its own contractual rate. It also checks the specified same-pool ownership cases. These consistency checks test the implementation against the declared equations. They do not independently validate platform operations or turn the model into observed economic evidence.
Original source pages are linked and privately fingerprinted for provenance rather than redistributed in the public download. The recipe contains selected factual rate parameters, an independently expressed equation and our chosen scenario design. It does not include a complete contract, a customer record or third-party audiobook text. Reuse of the derived calculations does not grant rights to ACX materials, Audible trademarks, a recording or a book’s underlying intellectual property.
What this comparison cannot decide
Most economically important inputs remain unobserved: how many people encounter a title, which transactions qualify, their accounting periods, actual a-la-carte prices, the applicable Member Value, refunds and adjustments. Holding M fixed is a tool for isolating the allocation relationship, not a claim that real membership value is unaffected by the transaction mix. Reserve credits and platform-wide plan calculations can alter the actual base, and a creator cannot assume the illustrative 12 units will appear on a statement.
The model also excludes production and marketing expenses, opportunity costs, taxes, narrator or producer shares, returns, payment thresholds, bank delays and income outside Audible. Consequently, the larger modeled portfolio royalty in the own-addition case is not a gain in net profit or evidence that exclusivity, an AYCL opt-in or commissioning another audiobook is worthwhile. Those decisions involve additional rights, audiences, uncertainty and costs not represented here.
The useful conclusion is narrower and more durable: compare like bases and state the ownership boundary. A title-level amount can decline while a combined portfolio rises under a proportional allocation rule. The transparent counterexample, full sensitivity files and source links make that possibility checkable. They do not establish its prevalence, identify a winning publishing strategy or replace the current agreement and actual statement values needed for an individual decision.
A contractual rate is applied after the title-price allocation
Chosen external-to-own price-weight ratios from zero to eight; 50% and 30% contractual rates multiply each resulting share of a fixed hypothetical Member Value.
Full chart and source

Scroll horizontally to inspect the chart. ↔
Chart and values
Scroll horizontally to see all columns.
| External ÷ own price weight | Contractual rate | Modeled royalty ÷ fixed Member Value (%) |
|---|---|---|
| 0 | 50% | 50 |
| 0 | 30% | 30 |
| 0.25 | 50% | 40 |
| 0.25 | 30% | 24 |
| 0.5 | 50% | 33.333 |
| 0.5 | 30% | 20 |
| 1 | 50% | 25 |
| 1 | 30% | 15 |
| 2 | 50% | 16.667 |
| 2 | 30% | 10 |
| 3 | 50% | 12.5 |
| 3 | 30% | 7.5 |
| 4 | 50% | 10 |
| 4 | 30% | 6 |
| 8 | 50% | 5.556 |
| 8 | 30% | 3.333 |
Analytical reference, separate from the 280-case grid. Values are chosen ratios, not measured title prices or income.
An existing title can fall while its owner’s total rises
At fixed synthetic Member Value 12 and equal 50% rates, adding an own eligible title lowers the existing title from 4 to 2 units while raising its owner’s total from 4 to 5. Adding the same weight externally lowers the own total to 2.
Full chart and source

Scroll horizontally to inspect the chart. ↔
Chart and values
Scroll horizontally to see all columns.
| Chosen case | Existing own-title weight | Added own-title weight | External total weight | Existing own royalty | Added own royalty | External royalty | Own portfolio royalty |
|---|---|---|---|---|---|---|---|
| Baseline | 20 | 0 | 10 | 4 | 0 | 2 | 4 |
| Add own eligible title | 20 | 30 | 10 | 2 | 3 | 1 | 5 |
| Add external eligible title | 20 | 0 | 40 | 2 | 0 | 4 | 2 |
Every eligible title has the same 50% rate. All price weights and the pool are chosen common units. The added title is already eligible in the hypothetical member-period set; publication alone does not qualify a title.

Data & downloads
Scroll horizontally to see all columns.
| External ÷ own price weight | Contractual rate | Modeled royalty ÷ fixed Member Value (%) |
|---|---|---|
| 0 | 50% | 50 |
| 0 | 30% | 30 |
| 0.25 | 50% | 40 |
| 0.25 | 30% | 24 |
| 0.5 | 50% | 33.333 |
| 0.5 | 30% | 20 |
| 1 | 50% | 25 |
| 1 | 30% | 15 |
| 2 | 50% | 16.667 |
| 2 | 30% | 10 |
| 3 | 50% | 12.5 |
| 3 | 30% | 7.5 |
| 4 | 50% | 10 |
| 4 | 30% | 6 |
| 8 | 50% | 5.556 |
| 8 | 30% | 3.333 |
Analytical reference, separate from the 280-case grid. Values are chosen ratios, not measured title prices or income.
Scroll horizontally to see all columns.
| Chosen case | Existing own-title weight | Added own-title weight | External total weight | Existing own royalty | Added own royalty | External royalty | Own portfolio royalty |
|---|---|---|---|---|---|---|---|
| Baseline | 20 | 0 | 10 | 4 | 0 | 2 | 4 |
| Add own eligible title | 20 | 30 | 10 | 2 | 3 | 1 | 5 |
| Add external eligible title | 20 | 0 | 40 | 2 | 0 | 4 | 2 |
Every eligible title has the same 50% rate. All price weights and the pool are chosen common units. The added title is already eligible in the hypothetical member-period set; publication alone does not qualify a title.
Evidence & method
How we calculated it
- This is an exploratory deterministic model with explicitly chosen inputs, not a survey or observed outcome study.
- Run the included Python 3 standard-library recipe to reproduce the complete CSV and JSON outputs; exact fractions preserve the arithmetic.
- All source rules, starting conditions, unsupported inputs and exclusions are stated in the visible article and downloadable methods.
What the data cannot tell us
- Chosen common-unit scenarios are not sampled accounts, books, listeners, sales or market frequencies.
- Actual Member Value and eligible transaction sets are not observed. Holding them fixed does not model demand or the effect of publishing another title.
- Own-title aggregation assumes the same contractual rate across those titles. Different rates or contractual splits require title-level calculations before summation.
- No production cost, tax, narrator share, profit, cash settlement, pricing recommendation, exclusivity recommendation or comparison of actual legacy and new-model income is established.
Original sources
- ACX Royalty Payment Terms and Procedures for Rights Holders Pay-for-Production Deals: Audible Exclusive and Non-Exclusive Distribution Rights
The model uses a fixed chosen member-period pool and already eligible distinct titles. It does not reconstruct a platform statement, real plan value or title contract.
Accessed October 31, 2026
- ACX Audible’s New Royalty Model
Official overview corroborates rates and the proportional membership allocation. The detailed Pay-for-Production terms govern the modeled eligible set, not a vague count of all listening.
Accessed October 31, 2026
- ACX All-You-Can-Listen Program Opt-In
Eligibility and Qualified Listen are not inferred from mere catalogue presence or a sample; no opt-in outcome or threshold model is calculated.
Accessed October 31, 2026
Cite & reuse this study
Alisson Bento. One audiobook can earn less while its owner’s total rises: a Member Value allocation model. Original bounded computational reference; source rules accessed 31 October 2026. https://alissonbento.com/research/acx-member-value-title-and-portfolio-allocation/
Original article, derived calculations and charts by Alisson Bento. Third-party provider pages and trademarks remain their owners’ material; no provider endorsement or blanket rights in books, recordings or full source pages are implied.
Corrections or editorial questions