The result and the reader decision
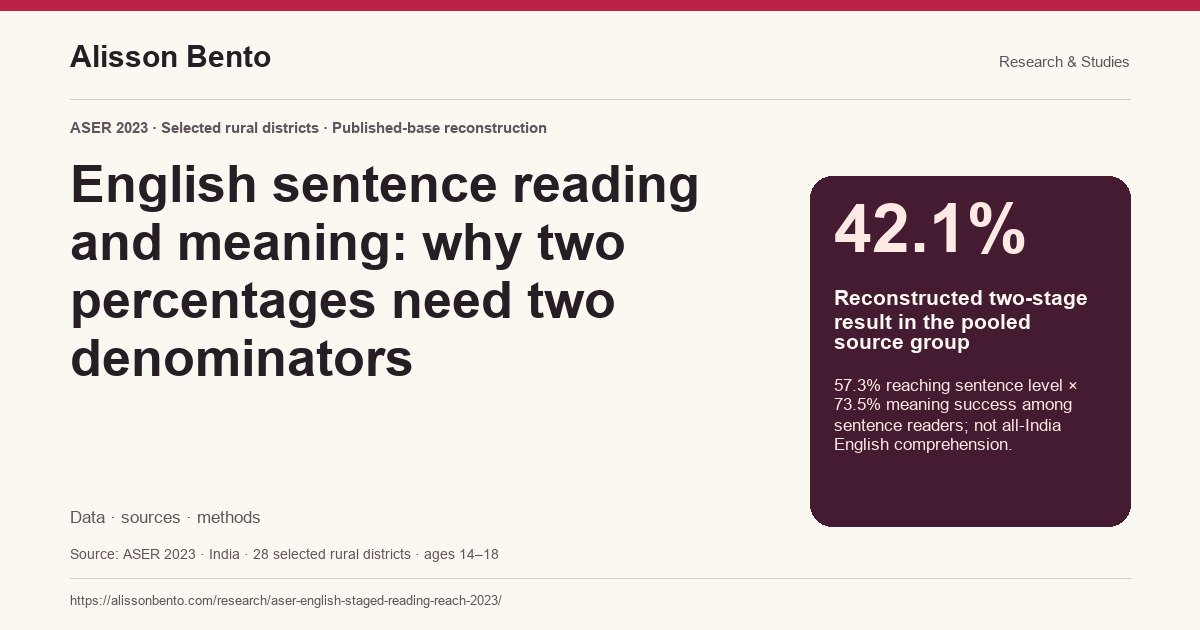
In ASER 2023's sample of rural youth aged fourteen to eighteen across twenty-eight selected districts, 57.3% reached the English sentence-reading stage. Among that group, 73.5% could give the required sentence meanings. Reconstructing the observed two-stage result gives approximately 42.1% of the full source group passing both stages. The 73.5% figure answers a different question: success among sentence readers. Neither percentage is a national estimate of English comprehension, a measure of reading an ebook, or a diagnosis of an individual young person.
This reference makes that denominator change explicit across every enrollment-by-sex cell in the two relevant source tables. It supplies the original numeric inputs, the multiplication, five paired comparisons and a transparent enclosure for input rounding. The calculation adds no new survey respondents. Its value is an auditable bridge between a conditional result and the larger group from which the successful readers were selected. An editor can retain the correct condition in a headline, while a publisher planning educational material can see why a high success rate at a later stage does not establish equally broad reach.
The two questions behind the headline
ASER Centre's report separates reading a short English sentence from demonstrating its meaning under the assessment procedure. Table 13 reports the share reaching the sentence-reading level within each source group. Table 14 then reports meaning performance among those sentence readers. Both are legitimate percentages. Putting them beside each other without their bases, however, can make the second look like another percentage of everyone. Reading “73.5% can give the meanings” as an unconditional claim would remove a substantial selection step from the source.
The underlying procedure is more specific than general English proficiency. It uses a small set of short sentences and a defined reading threshold. Meaning can be communicated in the local language, and the scoring instructions allow an explanation through the principal underlined words rather than requiring a polished translation. The present analysis does not reproduce those copyrighted questions. It follows their routing to identify the denominator. Passing this protocol is not evidence that a respondent can understand every sentence in a novel, follow a long argument, evaluate an unfamiliar website or learn successfully from an English-only course.
An additional distinction matters: respondents below the sentence-reading level can have other language knowledge. The source has a separate word-meaning route for respondents at word level. That route is outside the selected tables and outside this calculation. The complement of our two-stage result must therefore not be described as people who understand no English. It includes several different observed paths and leaves many forms of language use unmeasured. A statement about one specified test path should remain a statement about that path.
Reconstructing the larger base
Let R be reaching the sentence-reading stage and M be the source's successful sentence-meaning outcome among those readers. The required identity is P(R and M) = P(R) × P(M given R). For the source total, the calculation is 0.573 × 0.735 = 0.421155. Expressed as a percentage, that is 42.1155%, displayed as approximately 42.1%. The multiplication does not assume that reading and meaning are independent. It works because the second percentage explicitly conditions on the first stage.
A notional group of one hundred makes the bases easier to follow. Approximately 57.3 would reach the first stage. Applying the reported conditional meaning rate to those 57.3 produces approximately 42.1 with both recorded successes. About 15.2 percentage points represent sentence readers without a successful sentence-meaning outcome under the selected report definition. These are arithmetic translations of rounded published rates, not reconstructed headcounts. No fractional person was observed, and multiplying the result by the full sample size would not recover an exact number of respondents.
The conditional rate exceeds the reconstructed full-group rate by about 31.4 percentage points. That difference is not a deterioration in anyone's performance. It is entirely a change of denominator. The numerator refers to the same observed two-stage success, while the base expands from sentence readers to the relevant full source group. Calling this an overstatement is appropriate only when a writer has actually attached the conditional rate to the full base. The source itself states the condition correctly; there is no need to invent an error in the original report to explain the distinction.
What the enrollment rows add
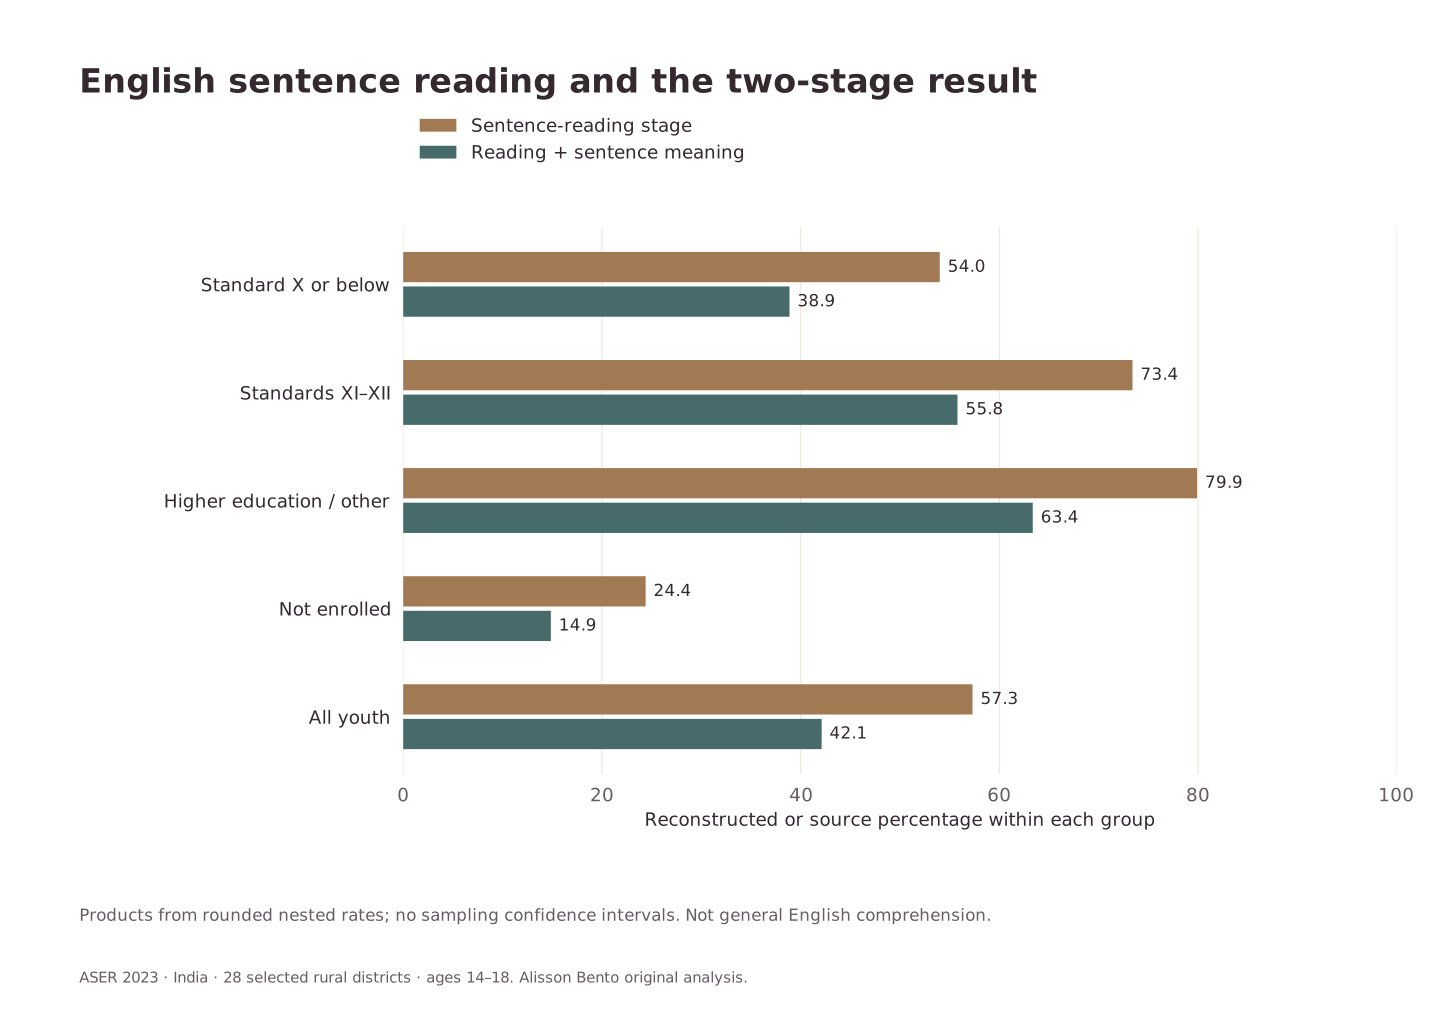
The analysis preserves four enrollment categories and the separate total. It does not select only the most striking row. For youth enrolled at Standard X or below, the source's combined-sex figures are 54.0% reaching sentence level and 72.0% successful at meaning among those readers. The reconstructed two-stage result is 38.9% of that enrollment group. For Standards XI or XII, 73.4% and 76.0% give approximately 55.8%. For the undergraduate-or-other category, 79.9% and 79.3% give approximately 63.4%.
For respondents not enrolled, 24.4% reach sentence level and 60.9% of that subset meet the meaning criterion. Their product is approximately 14.9% of the not-enrolled source group. Reporting only the conditional figure would obscure how few respondents in that group enter the sentence-meaning base. It would also make the enrolled and not-enrolled groups appear more similar in total observed reach than their two-stage products indicate. The tables support those descriptive comparisons; they do not explain why the groups differ.
Enrollment categories also differ in age, prior schooling and other circumstances. A comparison between college-level and unenrolled respondents is not an estimate of what enrollment would do to the same individual. The analysis makes no adjustment for those compositional differences, and the selected aggregate tables do not support one. An education provider can use the rows to recognize that a single language assumption may reach different source groups differently. It cannot use them to assign a causal return to schooling, rank educational institutions or predict a specific learner's outcome.
A paired example that changes direction
The not-enrolled row offers a useful warning about transferring the direction of a small first-stage comparison to the full path. Its reported sentence-reading rates are 24.3% for males and 24.5% for females: a female-minus-male difference of 0.2 percentage points. Conditional meaning rates are 63.5% and 58.8%, respectively. Multiplying the corresponding pairs gives about 15.4% for males and 14.4% for females passing both stages. The resulting female-minus-male difference is approximately minus 1.0 percentage point.
This direction change is an arithmetic property of the selected published estimates, not a demonstrated population difference or a claim that one sex is inherently better at language. Both stage-specific rates enter the joint result. A small advantage at one stage can coexist with a lower product if the second conditional rate differs enough. The example is useful because a reader can verify every input on one source page. It should not become a sensational headline that detaches the numbers from their narrow sample, task, rounding and missing sampling uncertainty.
All five paired comparisons are supplied, including the total, so the example does not conceal contrary rows. The full-source-group two-stage estimates are approximately 43.5% for males and 41.0% for females, a female-minus-male difference of roughly minus 2.5 points. These group descriptions overlap with the enrollment rows and must not be added together. The tables classify sex in the source's two displayed categories; the analysis does not infer additional gender information or extend those categories to all possible identities.
What the rounding bounds establish
Both source tables display percentages to one decimal place. The downloadable calculation treats each displayed input as compatible with a value within 0.05 percentage points, clipped to the range zero to one hundred. Multiplying the lower endpoints and the upper endpoints gives a deterministic enclosure for the product, conditional on that rounding tolerance. For the combined source total, it runs from approximately 42.0501% to 42.1809%. Displaying the product to one decimal is therefore a communication choice, not evidence of that level of statistical accuracy.
For a paired difference, the conservative lower endpoint subtracts the male product's upper endpoint from the female product's lower endpoint. The upper endpoint does the reverse. In the not-enrolled row, the resulting interval is about minus 1.1101 to minus 0.9390 percentage points. Consequently, ordinary one-decimal input rounding within the stated tolerance does not erase the direction change in these displayed estimates. That is the entire claim. The calculation does not show that a design-based confidence interval excludes zero.
Sampling error, nonresponse, measurement error and other nonsampling limitations remain outside these rounding enclosures. The selected tables do not supply the covariance and cell-specific uncertainty needed to calculate a justified standard error for every new product or paired difference. This reference therefore gives no p-values, significance stars, sampling confidence intervals or claims of equivalence. A narrow rounding range can coexist with substantial sampling uncertainty. Readers should keep those two kinds of uncertainty separate whenever a calculated percentage appears precise.
The source population is narrower than India
The source surveyed 34,745 youth aged fourteen to eighteen in twenty-eight rural districts across twenty-six states. The report describes this as one selected rural district in most major states, with two in Uttar Pradesh and Madhya Pradesh. These results are not presented here as a nationally representative estimate for every rural young person, much less every Indian teenager. The source's pooled total is retained as the pooled source total. It is not relabeled an India-wide prevalence rate simply because the districts cover many states.
There is also no time trend in this reference. ASER 2023 is the observation label; inspecting the report in October 2026 does not make the measurements current to 2026. The calculation does not combine the 2017 and 2023 samples or interpret their differences as changes in the same places and people. Nor does it compare the English tasks directly with PISA, PIRLS, PIAAC, a commercial language exam or regional-language reading assessments. Different tasks, populations and routing rules prevent those instruments from sharing a denominator merely because they all involve reading.
How publishers and editors can use the result
An independent check should begin with the table headings, not a calculator. Confirm that the first cell refers to the selected enrollment and sex group, then check that the second refers to sentence readers within that same group. Preserve the source's total row separately. Only then multiply the two percentages and divide by one hundred. If one input instead came from a different district, age range, survey year or reading level, the same arithmetic would still return a number, but it would no longer reconstruct the outcome described here. A working formula does not repair incompatible inputs.
The portable recipe also makes a useful editorial distinction between a number that can be reproduced and a claim that can be supported. Reproducing 42.1155 from 57.3 and 73.5 verifies an operation. It does not independently validate ASER's fieldwork, remove the source's selection limitations or establish the accuracy of every displayed rate. Conversely, those limitations do not make the denominator identity meaningless. They specify what the reconstructed number describes and which additional claims need evidence. Keeping those steps separate is especially valuable when a source table is summarized again in a chart, news story or automatically extracted answer.
For an editor, the practical output is a short attribution that keeps the base in the sentence: approximately 42.1% of youth in the pooled selected-district source group passed both the English sentence-reading and sentence-meaning stages, reconstructed from the report's rounded nested percentages. If the conditional figure is more relevant to the story, retain its condition instead. Both statements can be accurate. The wrong move is to use the larger conditional number with the wider population label, or to convert a task-specific outcome into a broad judgment about comprehension.
For a publisher designing reading material, the result supports a question to test, rather than a ready-made prescription. Does an English-first entry page assume two capabilities that should be checked separately? Could a local-language introduction, an audio explanation or a worked example make the intended task clearer? This study did not test any of those designs, and it cannot promise that they will improve reading or engagement. It identifies the source-stage distinction that a responsible usability study should preserve rather than flatten into a single proficiency label.
The files make reuse straightforward without distributing the source assessment. The source matrix lists all thirty selected numeric inputs; the results identify all fifteen products and five paired comparisons; the reproducible code states every operation. Original charts use the same denominators as the accessible table. ASER Centre receives source credit, while Alisson Bento is credited for this secondary calculation and explanation. No ASER endorsement, instrument licence, new survey, individual score or previously unknown universal relationship is claimed. The contribution is an inspectable reconstruction that helps readers carry the correct denominator from a published table into a decision.
English sentence reading and the two-stage result
Five original enrollment/total groups; combined-sex rows, each with its own full source base.
Full chart and source
Scroll horizontally to inspect the chart. ↔
Chart and values
Scroll horizontally to see all columns.
| Source group | Source sex | Sentence reading (%) | Meaning among sentence readers (%) | Both stages (%) | Rounding lower (%) | Rounding upper (%) |
|---|---|---|---|---|---|---|
| Standard X or below | Male | 55.5 | 73.2 | 40.63 | 40.5617 | 40.6904 |
| Standard X or below | Female | 52.7 | 70.9 | 37.36 | 37.3025 | 37.4261 |
| Standard X or below | All | 54.0 | 72.0 | 38.88 | 38.8170 | 38.9430 |
| Standards XI–XII | Male | 75.8 | 76.2 | 57.76 | 57.6836 | 57.8356 |
| Standards XI–XII | Female | 71.4 | 75.7 | 54.05 | 53.9763 | 54.1234 |
| Standards XI–XII | All | 73.4 | 76.0 | 55.78 | 55.7093 | 55.8587 |
| Higher education / other | Male | 80.7 | 80.0 | 64.56 | 64.4797 | 64.6404 |
| Higher education / other | Female | 79.3 | 78.8 | 62.49 | 62.4094 | 62.5675 |
| Higher education / other | All | 79.9 | 79.3 | 63.36 | 63.2811 | 63.4403 |
| Not enrolled | Male | 24.3 | 63.5 | 15.43 | 15.3866 | 15.4744 |
| Not enrolled | Female | 24.5 | 58.8 | 14.41 | 14.3644 | 14.4477 |
| Not enrolled | All | 24.4 | 60.9 | 14.86 | 14.8170 | 14.9023 |
| All youth | Male | 58.5 | 74.3 | 43.47 | 43.3991 | 43.5319 |
| All youth | Female | 56.3 | 72.8 | 40.99 | 40.9219 | 41.0510 |
| All youth | All | 57.3 | 73.5 | 42.12 | 42.0501 | 42.1809 |
Products from rounded nested rates; no sampling confidence intervals. Not general English comprehension. ASER 2023 · India · 28 selected rural districts · ages 14–18. Alisson Bento original analysis.

A paired comparison can change with the stage
Five paired female-minus-male comparisons, retaining the first stage and two-stage product.
Full chart and source

Scroll horizontally to inspect the chart. ↔
Chart and values
Scroll horizontally to see all columns.
| Source group | Sentence-stage gap (pp) | Two-stage gap (pp) | Rounding lower (pp) | Rounding upper (pp) |
|---|---|---|---|---|
| Standard X or below | −2.80 | −3.26 | −3.3879 | −3.1356 |
| Standards XI–XII | −4.40 | −3.71 | −3.8594 | −3.5603 |
| Higher education / other | −1.40 | −2.07 | −2.2310 | −1.9122 |
| Not enrolled | 0.20 | −1.02 | −1.1101 | −0.9390 |
| All youth | −2.20 | −2.48 | −2.6101 | −2.3482 |
Paired arithmetic contrasts only; no sampling confidence intervals, significance or causal interpretation.

Data & downloads
Scroll horizontally to see all columns.
| Source group | Source sex | Sentence reading (%) | Meaning among sentence readers (%) | Both stages (%) | Rounding lower (%) | Rounding upper (%) |
|---|---|---|---|---|---|---|
| Standard X or below | Male | 55.5 | 73.2 | 40.63 | 40.5617 | 40.6904 |
| Standard X or below | Female | 52.7 | 70.9 | 37.36 | 37.3025 | 37.4261 |
| Standard X or below | All | 54.0 | 72.0 | 38.88 | 38.8170 | 38.9430 |
| Standards XI–XII | Male | 75.8 | 76.2 | 57.76 | 57.6836 | 57.8356 |
| Standards XI–XII | Female | 71.4 | 75.7 | 54.05 | 53.9763 | 54.1234 |
| Standards XI–XII | All | 73.4 | 76.0 | 55.78 | 55.7093 | 55.8587 |
| Higher education / other | Male | 80.7 | 80.0 | 64.56 | 64.4797 | 64.6404 |
| Higher education / other | Female | 79.3 | 78.8 | 62.49 | 62.4094 | 62.5675 |
| Higher education / other | All | 79.9 | 79.3 | 63.36 | 63.2811 | 63.4403 |
| Not enrolled | Male | 24.3 | 63.5 | 15.43 | 15.3866 | 15.4744 |
| Not enrolled | Female | 24.5 | 58.8 | 14.41 | 14.3644 | 14.4477 |
| Not enrolled | All | 24.4 | 60.9 | 14.86 | 14.8170 | 14.9023 |
| All youth | Male | 58.5 | 74.3 | 43.47 | 43.3991 | 43.5319 |
| All youth | Female | 56.3 | 72.8 | 40.99 | 40.9219 | 41.0510 |
| All youth | All | 57.3 | 73.5 | 42.12 | 42.0501 | 42.1809 |
Products from rounded nested rates; no sampling confidence intervals. Not general English comprehension. ASER 2023 · India · 28 selected rural districts · ages 14–18. Alisson Bento original analysis.
Scroll horizontally to see all columns.
| Source group | Sentence-stage gap (pp) | Two-stage gap (pp) | Rounding lower (pp) | Rounding upper (pp) |
|---|---|---|---|---|
| Standard X or below | −2.80 | −3.26 | −3.3879 | −3.1356 |
| Standards XI–XII | −4.40 | −3.71 | −3.8594 | −3.5603 |
| Higher education / other | −1.40 | −2.07 | −2.2310 | −1.9122 |
| Not enrolled | 0.20 | −1.02 | −1.1101 | −0.9390 |
| All youth | −2.20 | −2.48 | −2.6101 | −2.3482 |
Paired arithmetic contrasts only; no sampling confidence intervals, significance or causal interpretation.
Evidence & method
How we calculated it
- Inspect the actual source report, its task routing, table headers and footnotes. Verify all selected cells visually and preserve exact one-decimal source values as strings.
- Retain every row from the selected tables, including separate total rows. Record the full-group base and each later explicitly nested conditional base before multiplication.
- Calculate products using Decimal arithmetic. Convert percentages consistently; do not multiply unrelated marginals or assume independence to repair missing joint information.
- Enclose each one-decimal input within an explicit 0.05 percentage-point tolerance, clipped to [0,100]. Use monotone endpoint products and conservative paired-difference endpoints.
- Record the analysis specification after source inspection and informal arithmetic, before the complete scripted derivation. This is not blinded preregistration.
- Reproduce every CSV and JSON result from the supplied checksum-verified selected aggregate matrix using standard-library Python, without network access, accounts or respondent data.
- Use PDF page 53 (printed 47), Tables 13 and 14: five enrollment/total groups by male, female and all. P(sentence and meaning)=P(sentence)×P(meaning given sentence).
- Read the English assessment routing on PDF pages 225–226 (printed 219–220). Sentence meaning can be explained in the local language and through the permitted main-underlined-word route; the separate word-meaning branch is not included.
- Calculate all five matched female-minus-male differences at the sentence stage and the two-stage product, without significance tests or composition adjustment.
What the data cannot tell us
- The source describes youth ages 14–18 in 28 selected rural districts of 26 states. The pooled source total is not a representative all-India, urban or all-age estimate.
- Observations are from 2023. Inspecting the source in October 2026 does not make the measurements current, longitudinal or comparable to a different survey.
- Products reconstruct explicitly nested published-base rates from rounded estimates. They are not exact respondent counts or independently validated microdata estimates. Underlying missing-response details are unavailable for the new products.
- Input-rounding enclosures use an explicit ±0.05 percentage-point tolerance. They are not sampling confidence intervals, error guarantees, significance tests or evidence of equivalence.
- Selected aggregate tables do not provide the covariance and cell-specific sampling uncertainty needed for the derived products or paired differences. No p-values or causal inference is supplied.
- Enrollment and sex rows overlap with the separate total and are not summed or averaged to create another total. No age, education or other composition adjustment is performed.
- This is a secondary calculation, not a new survey, first-ever finding, individual assessment, ASER endorsement or licence to reproduce assessment instruments.
- The sentence-meaning protocol is not general English comprehension, fluency, ebook reading or a validated individual proficiency classification. Its complement is not people who understand no English.
- The study does not estimate an effect of enrollment or sex, explain the group differences, evaluate teaching materials or prescribe an intervention.
Original sources
- ASER Centre, Annual Status of Education Report (Rural) 2023: Beyond Basics
Tables 13 and 14 provide the 30 selected numeric inputs. The report’s English procedure on printed pages 219–220 defines reading and meaning routing; no assessment text is redistributed.
Accessed October 31, 2026
- ASER 2023: About the survey
The source background describes the selected-district household design, age group and fieldwork context. The pooled sample is not relabeled a nationally representative estimate.
Accessed October 31, 2026
- ASER Centre: ASER 2023 Beyond Basics source page
The official ASER 2023 landing page identifies the report, background documentation and assessment assets, distinct from other ASER survey years.
Accessed October 31, 2026
- ASER 2023: Assessment tasks
The official assessment overview clarifies the task-specific setting. This secondary analysis does not reproduce instruments or treat a few tasks as unrestricted comprehension.
Accessed October 31, 2026
Cite & reuse this study
Alisson Bento. 2026. English sentence reading and meaning: why two percentages need two denominators. Secondary analysis of ASER Centre’s 2023 selected-district published aggregates. https://alissonbento.com/research/aser-english-staged-reading-reach-2023/
Selected numeric source facts are credited to ASER Centre. Original calculations, explanation and figures are by Alisson Bento. The original charts and calculations may be reused with credit and a link to this study, retaining their scope and limitations. No licence to ASER report text, assessment instruments, photographs, source graphics or agency marks is inferred. No ASER endorsement is implied.
Corrections or editorial questions