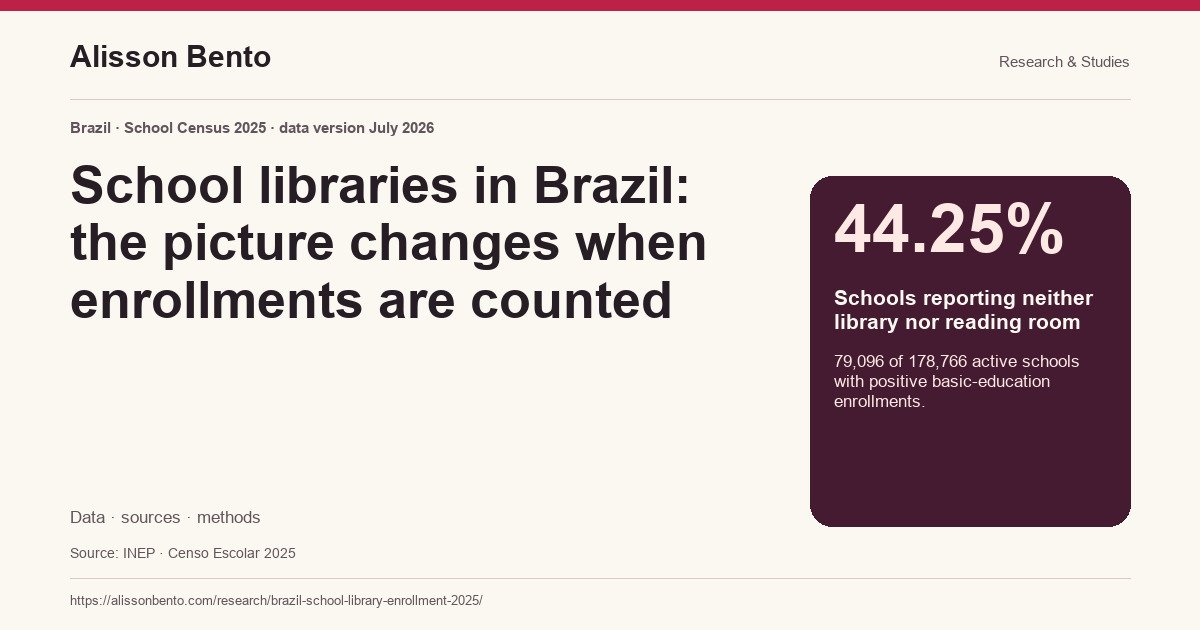
Two questions, two denominators
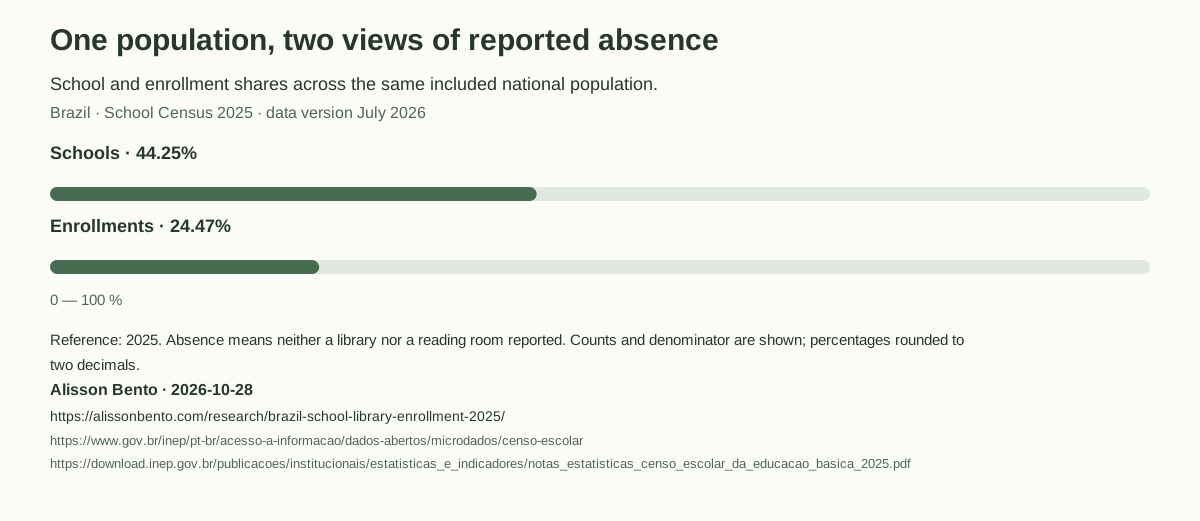
A count of schools asks how widespread a reported infrastructure condition is across establishments. An enrollment-weighted count asks how many recorded enrollments belong to establishments with that condition. Every school receives one unit in the first calculation; a school with 1,000 enrollments contributes more than one with 30 in the second. Neither measure replaces the other.
Across the same 178,766 schools, the difference between the two absence rates is 19.77 percentage points. The lower enrollment rate means that schools reporting neither facility are smaller on average within this population. It does not mean that the reported absence is harmless, or that smaller schools have less need for books.
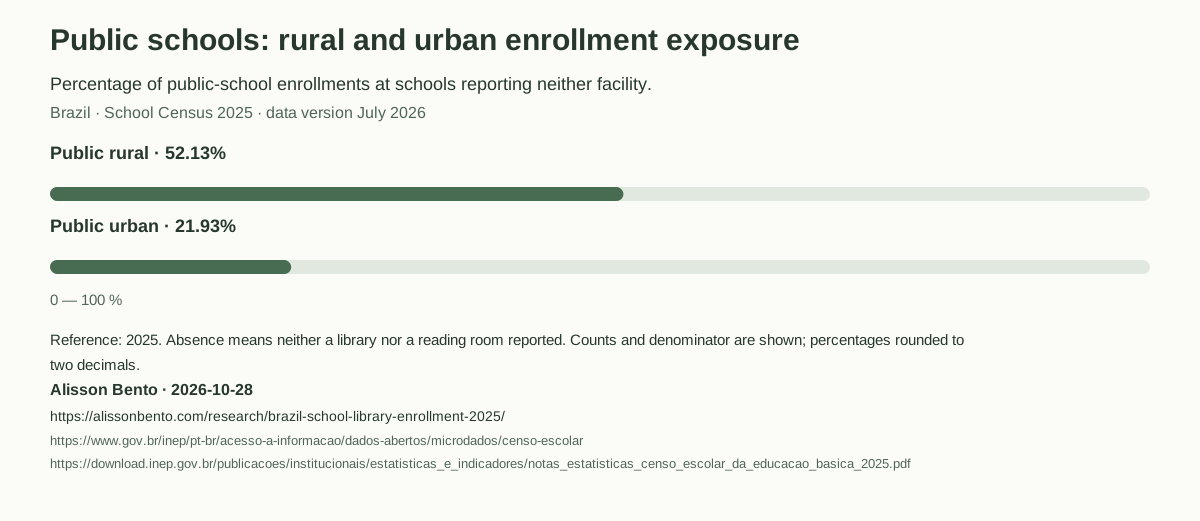
The public rural–urban difference remains substantial
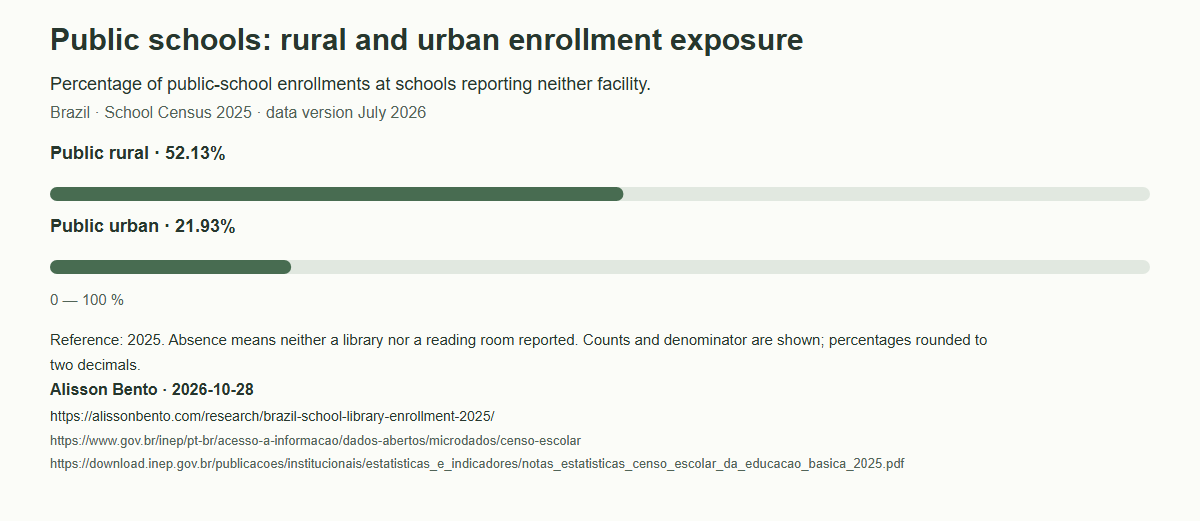
Among public schools, 70.37% of rural establishments reported neither a library nor a reading room, compared with 35.12% of urban establishments. Using enrollments as the denominator changes those figures to 52.13% and 21.93%, respectively. The enrollment gap is 30.21 percentage points when calculated from unrounded rates.
School location is the location classification of the establishment. It is not the home address of each enrolled person, a travel-distance measure or proof that a rural resident lacks other reading options. The figures describe recorded school infrastructure and should be used with local reporting about staffing, collections, accessibility and shared provision.
Networks serve different mixes of schools and education stages
Municipal schools account for 8,202,971 enrollments at establishments reporting neither facility, out of 23,059,168 municipal enrollments: 35.57%. The corresponding enrollment rates are 10.35% in state schools, 1.68% in federal schools and 18.09% in private schools. These are descriptive comparisons, not a ranking of management quality.
Education stages offer important context. For early-childhood education, 52.75% of enrollments are in schools reporting neither facility; for the initial years of fundamental education, 23.68%; for its final years, 13.76%; and for upper-secondary education, 8.37%. A school may serve several stages, and the needs and organization of reading spaces differ. These percentages cannot establish why networks differ.
Read the state table as a pair of measures
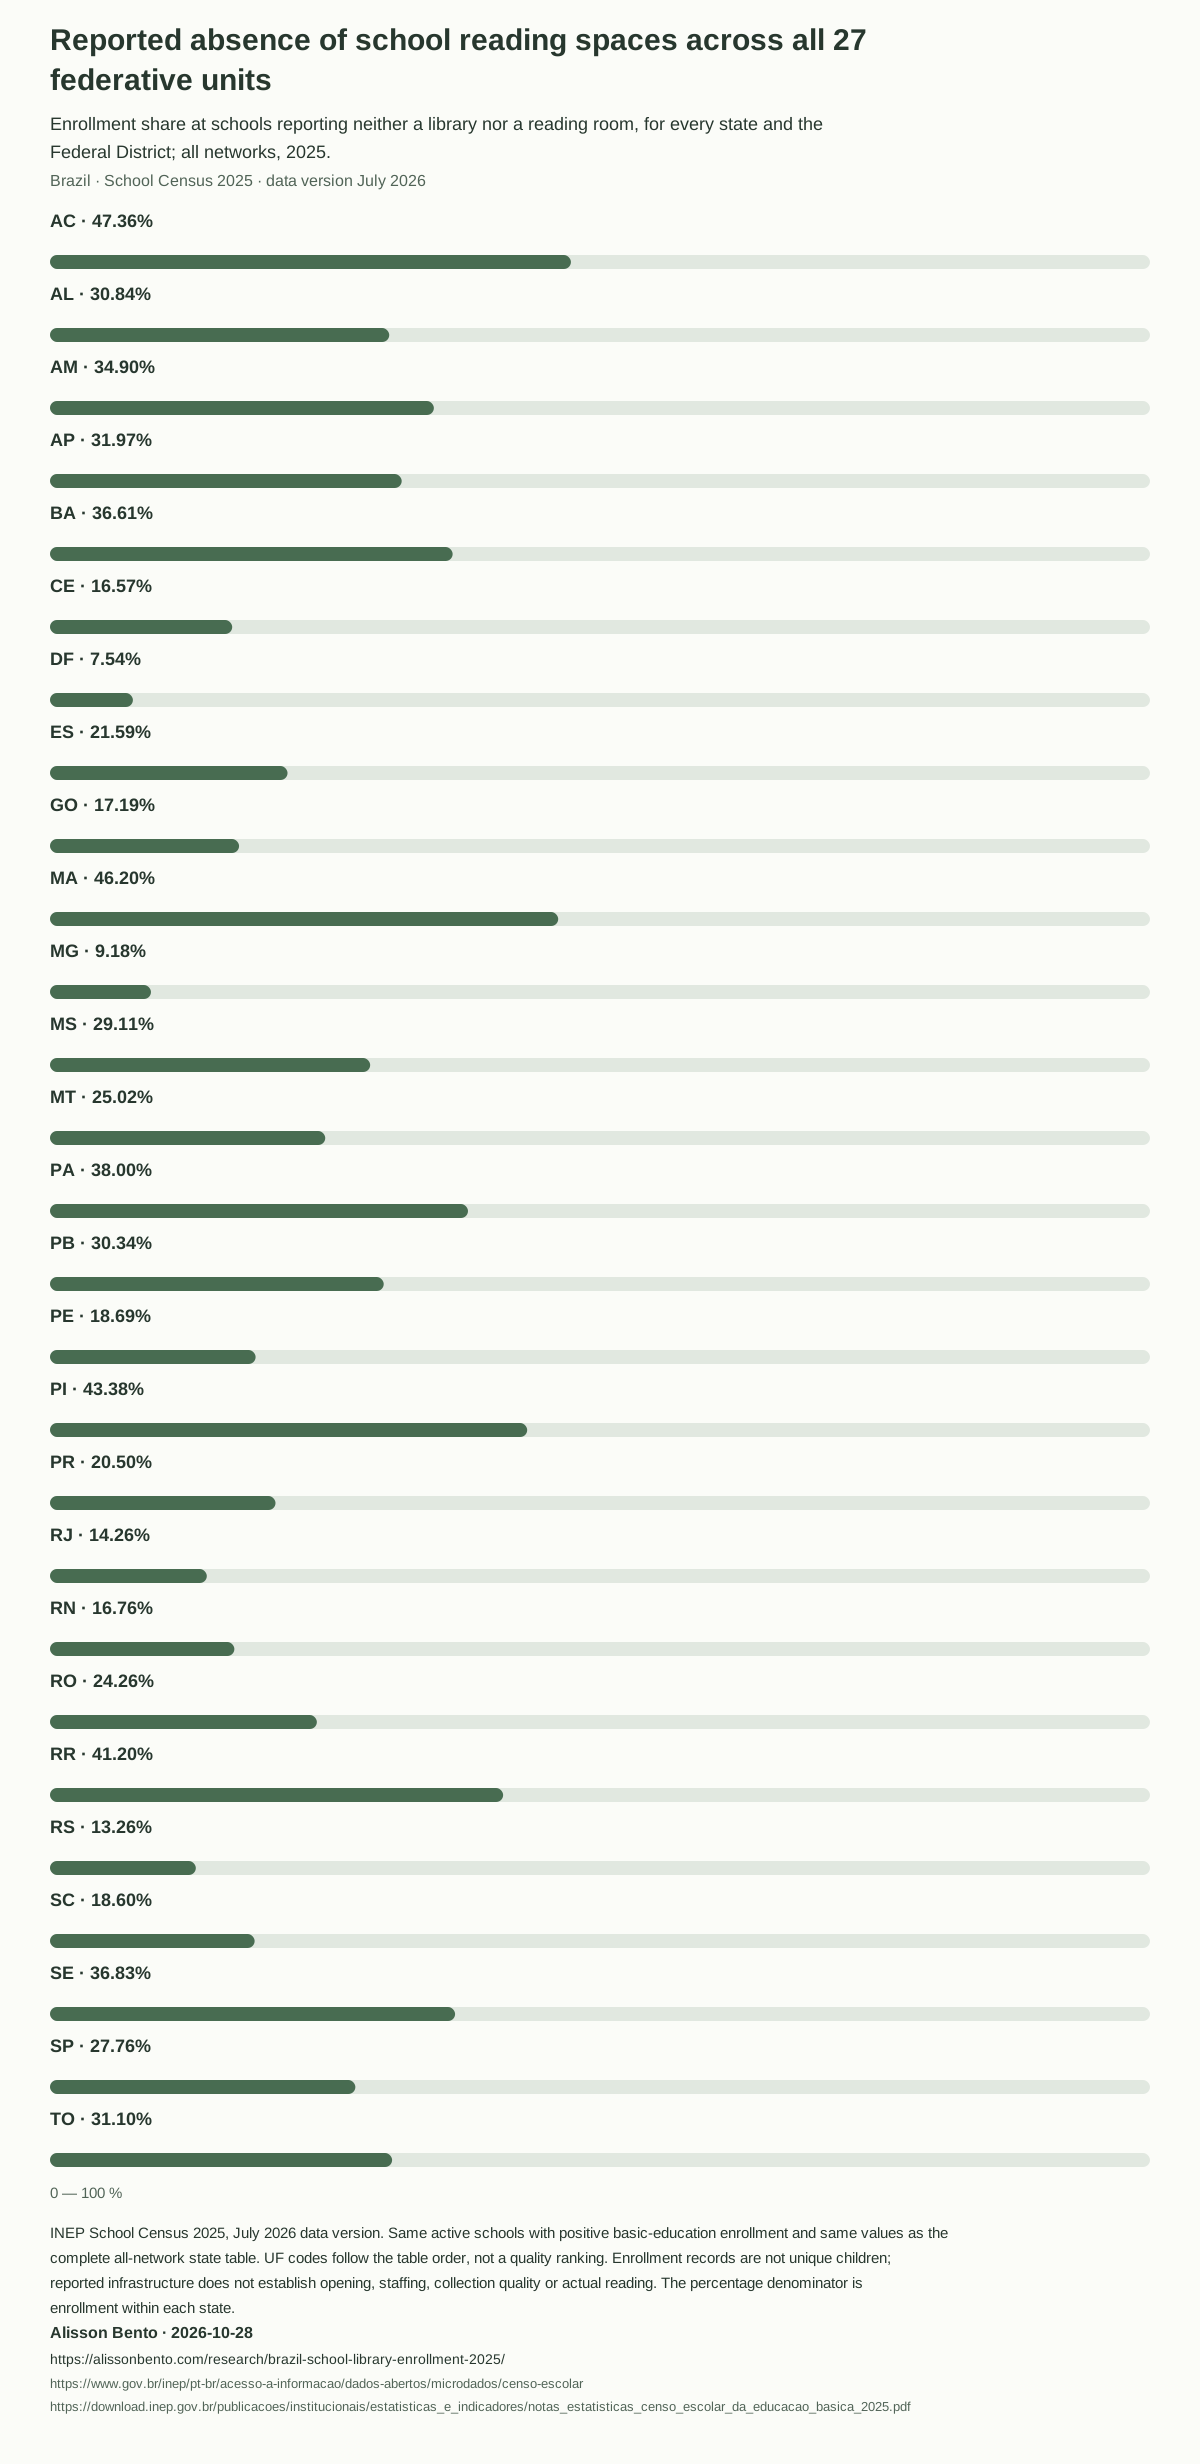
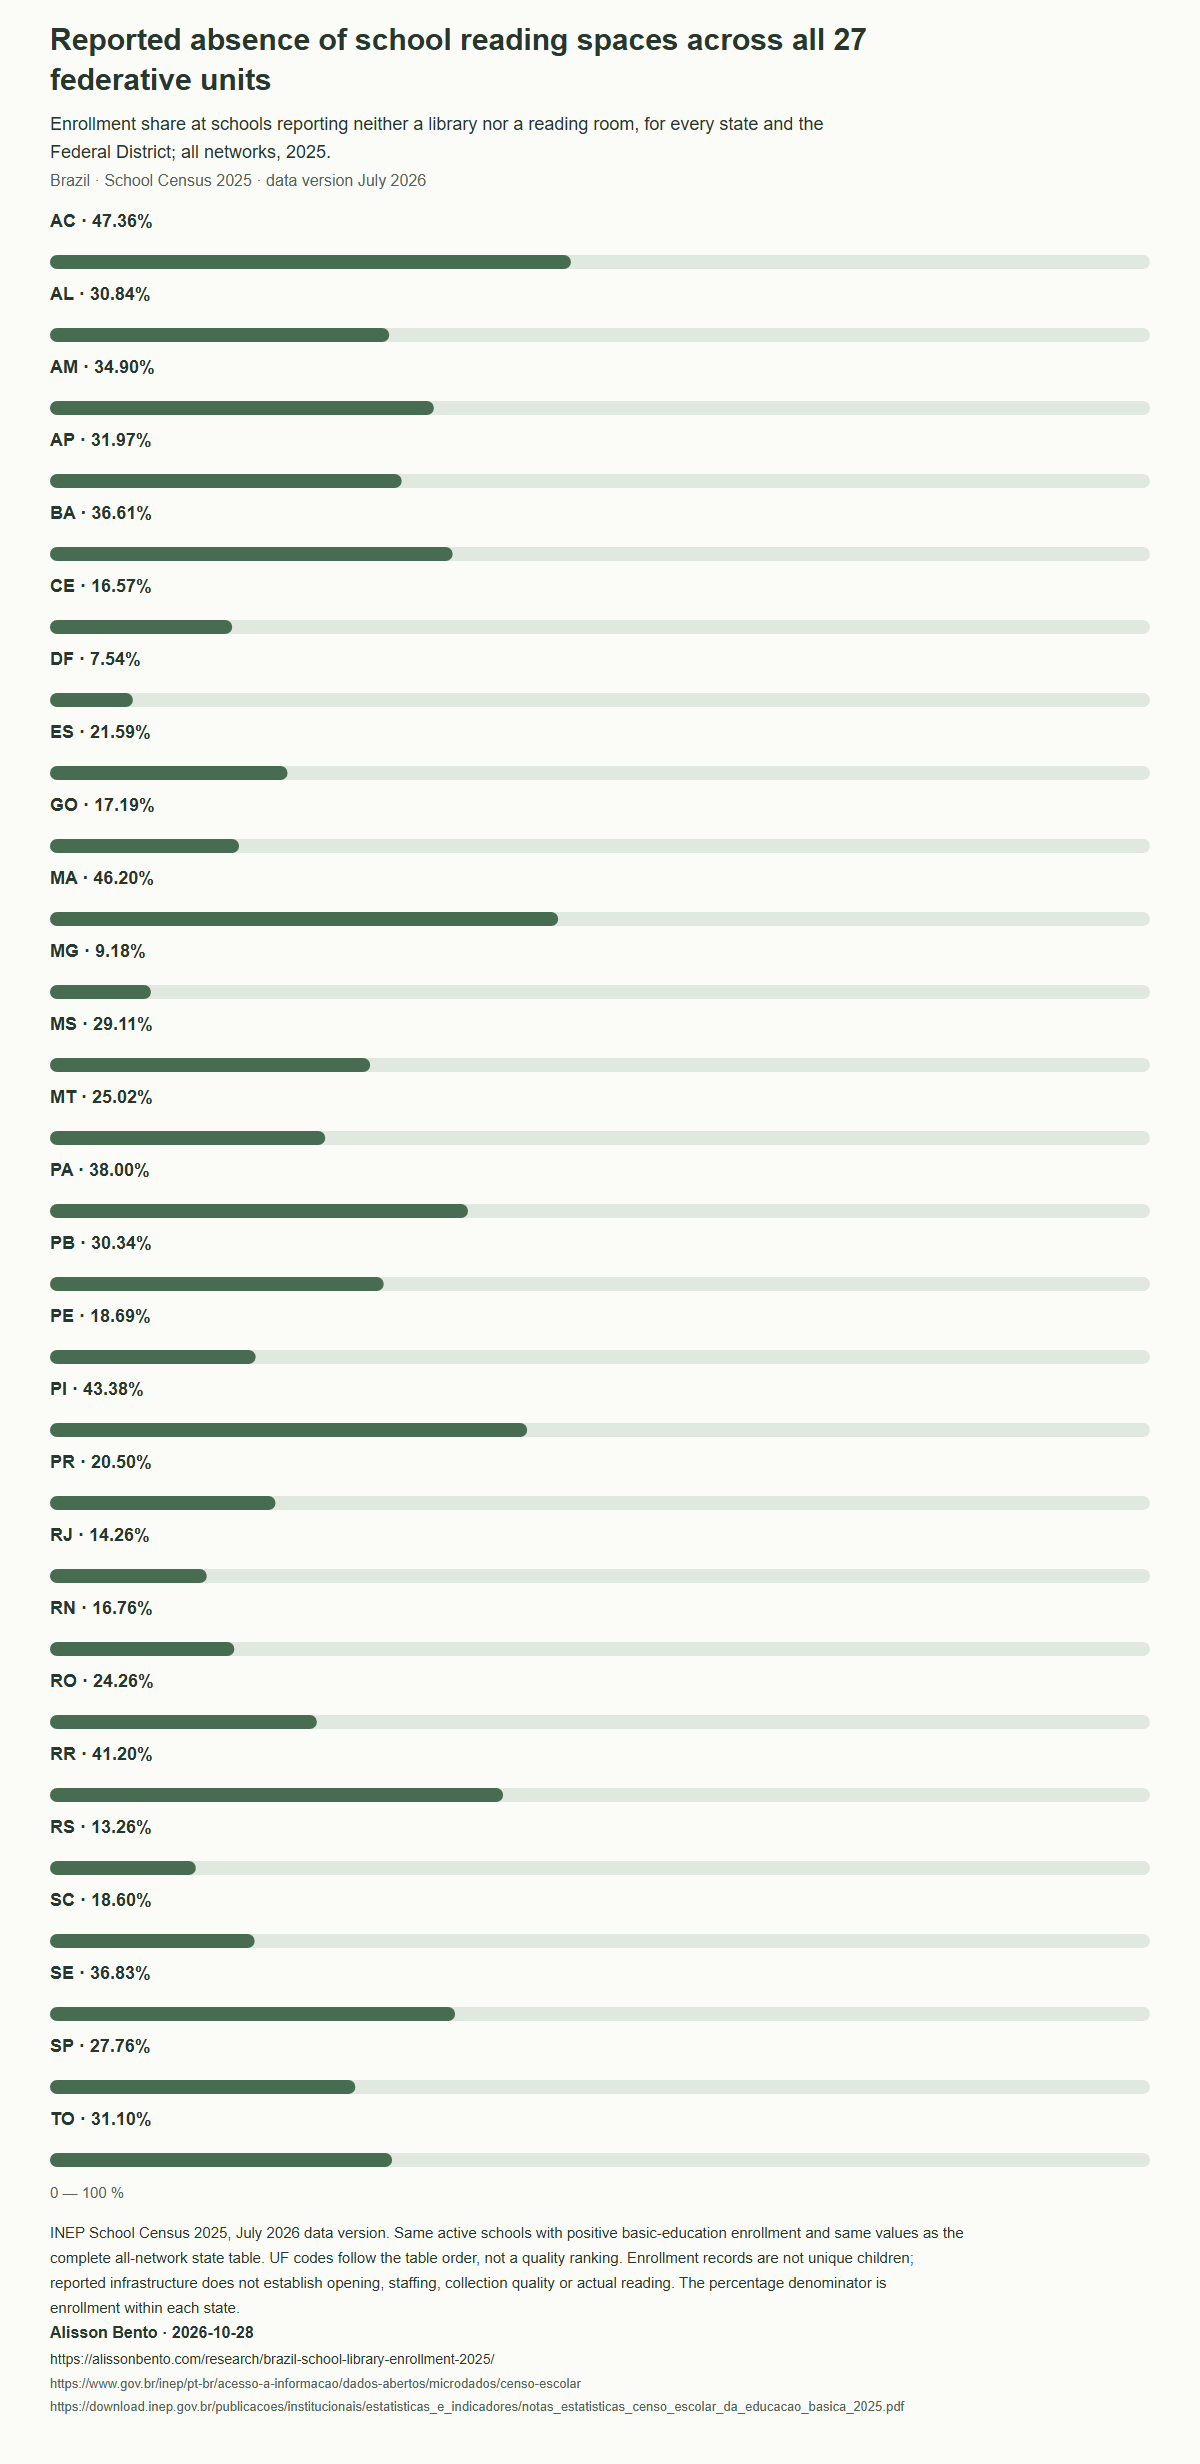
The complete state table displays the school count, the number reporting neither facility, the school absence rate, the corresponding enrollment counts and the enrollment absence rate. A separate public-sector table supports local reporting without mixing public and private provision. All 27 federative units are retained.
State rates describe the included school populations. They do not establish an individual’s access to books outside school, the quality of a school’s reading program, compliance with legislation or the effect of a library on learning. Differences in school size, stage composition and network composition should be considered before drawing policy conclusions.
What counts as a school reading space here
The source field describes physical facilities that exist and are used at the school: a library and/or reading room. Absence means the combined indicator is explicitly zero. The two separate indicators, library and reading room, were checked against the combined indicator; there were no inconsistencies in the included population.
A classroom reading corner is a different item in the 2025 questionnaire. It is not treated as a library or reading room in this analysis. A zero on the facility indicator therefore does not prove that there are no books, no reading corners or no reading activities at the school. Conversely, a reported room does not establish collection size, a librarian’s presence, opening hours or actual use by every enrolled person.
An auditable secondary analysis of public data
This is an independent analysis of official administrative records, not a new survey, an inspection of schools or a study commissioned by INEP. The original source archive is the July 2026 version 2 release of the 2025 School Census. The observation reference is May 28, 2025. The files are joined one-to-one using the school identifier CO_ENTIDADE.
The school table contains 214,192 records, including inactive establishments. There are 180,540 active establishments; 1,774 do not have positive basic-education enrollment in the enrollment table and are excluded from both comparison denominators. The final 178,766-school population contains all 46,018,380 basic-education enrollments in that table. No included school has a missing combined facility response.
One included school has blank textual territory labels but valid numeric state and region codes. Display labels were restored from those numeric codes using the same official table; its 31 enrollments remain included in Rio Grande do Sul. Downloadable tables, the analysis code and the method record make that handling explicit.
Using and citing the results
For a national story about school infrastructure, report both rates together. For a local story, use the matching state and public-sector tables and keep the 2025 reference year in the headline or accompanying text. Report percentage-point differences rather than saying the percentage of people without books is the school absence rate.
The downloadable CSV contains exact integer numerators and denominators as well as unrounded rates. Displayed percentages are rounded to two decimal places, so differences should be calculated from the unrounded values. Derived aggregate tables and code may be reused with attribution to this analysis and to INEP as the data producer; original source files retain their own conditions.
One population, two views of reported absence
School and enrollment shares across the same included national population.
Scroll horizontally to inspect the chart. ↔
Chart values as text
Public schools: rural and urban enrollment exposure
Percentage of public-school enrollments at schools reporting neither facility.
Scroll horizontally to inspect the chart. ↔
Chart values as text
Reported absence of school reading spaces across all 27 federative units
Enrollment share at schools reporting neither a library nor a reading room, for every state and the Federal District; all networks, 2025.
Scroll horizontally to inspect the chart. ↔
Chart values as text
Data & downloads
Scroll horizontally to see all columns.
| State / Federal District | Schools | Schools reporting neither facility | School share without (%) | Enrollments | Enrollments at schools reporting neither facility | Enrollment share without (%) |
|---|---|---|---|---|---|---|
| AC | 1 521 | 1 170 | 76.92% | 242 727 | 114 950 | 47.36% |
| AL | 2 851 | 1 369 | 48.02% | 831 546 | 256 459 | 30.84% |
| AM | 5 536 | 3 880 | 70.09% | 1 131 739 | 394 947 | 34.90% |
| AP | 864 | 495 | 57.29% | 212 026 | 67 792 | 31.97% |
| BA | 15 854 | 9 120 | 57.52% | 3 345 058 | 1 224 469 | 36.61% |
| CE | 7 628 | 2 321 | 30.43% | 2 108 135 | 349 216 | 16.57% |
| DF | 1 291 | 218 | 16.89% | 620 272 | 46 751 | 7.54% |
| ES | 2 986 | 1 307 | 43.77% | 867 017 | 187 231 | 21.59% |
| GO | 4 722 | 1 301 | 27.55% | 1 526 256 | 262 356 | 17.19% |
| MA | 11 123 | 7 786 | 70.00% | 1 821 863 | 841 728 | 46.20% |
| MG | 15 849 | 3 780 | 23.85% | 4 220 829 | 387 451 | 9.18% |
| MS | 1 829 | 758 | 41.44% | 675 479 | 196 617 | 29.11% |
| MT | 2 701 | 1 048 | 38.80% | 888 828 | 222 413 | 25.02% |
| PA | 10 471 | 6 874 | 65.65% | 2 146 239 | 815 554 | 38.00% |
| PB | 4 624 | 2 191 | 47.38% | 942 549 | 285 961 | 30.34% |
| PE | 7 968 | 2 913 | 36.56% | 2 076 655 | 388 179 | 18.69% |
| PI | 3 976 | 2 286 | 57.49% | 823 199 | 357 119 | 43.38% |
| PR | 9 528 | 3 554 | 37.30% | 2 438 428 | 499 914 | 20.50% |
| RJ | 11 557 | 2 988 | 25.85% | 3 319 771 | 473 276 | 14.26% |
| RN | 3 368 | 1 150 | 34.14% | 756 434 | 126 790 | 16.76% |
| RO | 1 186 | 469 | 39.54% | 376 264 | 91 284 | 24.26% |
| RR | 908 | 657 | 72.36% | 186 395 | 76 786 | 41.20% |
| RS | 9 874 | 2 673 | 27.07% | 2 189 268 | 290 244 | 13.26% |
| SC | 6 538 | 2 448 | 37.44% | 1 769 938 | 329 277 | 18.60% |
| SE | 1 999 | 1 021 | 51.08% | 520 379 | 191 642 | 36.83% |
| SP | 30 439 | 14 572 | 47.87% | 9 600 318 | 2 665 133 | 27.76% |
| TO | 1 575 | 747 | 47.43% | 380 768 | 118 425 | 31.10% |
Reference: 2025. Absence means neither a library nor a reading room reported. Counts and denominator are shown; percentages rounded to two decimals.
Scroll horizontally to see all columns.
| State / Federal District | Schools | Schools reporting neither facility | School share without (%) | Enrollments | Enrollments at schools reporting neither facility | Enrollment share without (%) |
|---|---|---|---|---|---|---|
| AC | 1 481 | 1 164 | 78.60% | 230 065 | 113 935 | 49.52% |
| AL | 2 372 | 1 264 | 53.29% | 709 456 | 235 166 | 33.15% |
| AM | 5 144 | 3 772 | 73.33% | 1 038 254 | 381 227 | 36.72% |
| AP | 777 | 475 | 61.13% | 188 483 | 65 577 | 34.79% |
| BA | 13 185 | 8 525 | 64.66% | 2 797 024 | 1 147 762 | 41.04% |
| CE | 5 942 | 2 101 | 35.36% | 1 708 166 | 321 886 | 18.84% |
| DF | 684 | 72 | 10.53% | 416 666 | 24 358 | 5.85% |
| ES | 2 628 | 1 270 | 48.33% | 744 663 | 183 856 | 24.69% |
| GO | 3 556 | 1 146 | 32.23% | 1 250 190 | 241 067 | 19.28% |
| MA | 10 019 | 7 462 | 74.48% | 1 580 791 | 794 128 | 50.24% |
| MG | 12 031 | 3 049 | 25.34% | 3 488 848 | 320 355 | 9.18% |
| MS | 1 370 | 642 | 46.86% | 571 227 | 182 428 | 31.94% |
| MT | 2 234 | 947 | 42.39% | 777 623 | 211 253 | 27.17% |
| PA | 9 596 | 6 711 | 69.94% | 1 926 989 | 790 478 | 41.02% |
| PB | 3 712 | 1 902 | 51.24% | 747 354 | 246 037 | 32.92% |
| PE | 5 866 | 2 614 | 44.56% | 1 580 128 | 338 897 | 21.45% |
| PI | 3 548 | 2 245 | 63.28% | 712 762 | 351 186 | 49.27% |
| PR | 7 376 | 2 860 | 38.77% | 1 955 665 | 434 845 | 22.24% |
| RJ | 6 839 | 1 970 | 28.81% | 2 302 269 | 331 513 | 14.40% |
| RN | 2 681 | 1 050 | 39.16% | 589 041 | 116 916 | 19.85% |
| RO | 1 023 | 447 | 43.70% | 332 767 | 87 752 | 26.37% |
| RR | 857 | 645 | 75.26% | 171 986 | 75 198 | 43.72% |
| RS | 7 183 | 1 755 | 24.43% | 1 701 509 | 226 307 | 13.30% |
| SC | 5 183 | 2 100 | 40.52% | 1 437 116 | 295 740 | 20.58% |
| SE | 1 515 | 932 | 61.52% | 405 483 | 176 432 | 43.51% |
| SP | 18 840 | 7 968 | 42.29% | 7 069 963 | 1 785 299 | 25.25% |
| TO | 1 378 | 681 | 49.42% | 338 508 | 109 537 | 32.36% |
Reference: 2025. Absence means neither a library nor a reading room reported. Counts and denominator are shown; percentages rounded to two decimals.
Scroll horizontally to see all columns.
| Network | Schools | Schools reporting neither facility | School share without (%) | Enrollments | Enrollments at schools reporting neither facility | Enrollment share without (%) |
|---|---|---|---|---|---|---|
| State | 29 732 | 5 642 | 18.98% | 13 330 302 | 1 379 715 | 10.35% |
| Federal | 716 | 16 | 2.23% | 383 526 | 6 449 | 1.68% |
| Municipal | 106 572 | 60 111 | 56.40% | 23 059 168 | 8 202 971 | 35.57% |
| Private | 41 746 | 13 327 | 31.92% | 9 245 384 | 1 672 829 | 18.09% |
Reference: 2025. Absence means neither a library nor a reading room reported. Counts and denominator are shown; percentages rounded to two decimals.
Scroll horizontally to see all columns.
| Education stage | Schools | Schools reporting neither facility | School share without (%) | Enrollments | Enrollments at schools reporting neither facility | Enrollment share without (%) |
|---|---|---|---|---|---|---|
| Early-childhood education | 113 534 | 62 655 | 55.19% | 9 286 182 | 4 898 563 | 52.75% |
| Fundamental education — initial years | 101 292 | 42 849 | 42.30% | 14 514 244 | 3 436 956 | 23.68% |
| Fundamental education — final years | 61 354 | 15 518 | 25.29% | 11 292 523 | 1 553 771 | 13.76% |
| Upper-secondary education | 30 257 | 3 872 | 12.80% | 7 370 879 | 617 231 | 8.37% |
| Youth and adult education | 29 696 | 12 611 | 42.47% | 2 252 069 | 659 913 | 29.30% |
| Vocational education | 16 765 | 1 995 | 11.90% | 3 187 976 | 233 779 | 7.33% |
School denominator: only schools with positive enrollments in the stage. Stage enrollment rows can overlap; do not add them.
Evidence & method
How we calculated it
- Download INEP’s 2025 School Census version 2 ZIP from the official microdata page; retain the archive SHA-256 and the exact member names in methodology.json.
- Read the school and enrollment CSVs using semicolon separators and CP1252 encoding. Verify one unique CO_ENTIDADE per file and join one-to-one.
- Keep schools with TP_SITUACAO_FUNCIONAMENTO=1 and QT_MAT_BAS>0. Count absence only where IN_BIBLIOTECA_SALA_LEITURA=0; preserve unknowns separately.
- Compute the school share by counting schools and the enrollment share by summing QT_MAT_BAS. Public schools are dependency categories 1, 2 and 3; private schools are category 4. Location 1 is urban and 2 is rural.
- Verify the combined facility response equals the OR of IN_BIBLIOTECA and IN_SALA_LEITURA. Reconcile state, network and rural–urban sums with the national total. Use stage-specific positive enrollments for stage tables.
- Present descriptive rates for the census records without sample confidence intervals. Administrative reporting error and coverage limitations remain. Do not sum stage rows because their enrollment definitions can overlap.
What the data cannot tell us
- School-reported infrastructure is not an independently inspected measure of availability, quality, opening hours or actual reading.
- QT_MAT_BAS counts enrollments and excludes exclusive supplementary-activity and exclusive specialized educational assistance classes; it is not a new independently deduplicated count of individuals.
- School location is not student residence. A missing library/reading-room indicator does not establish lack of books or other reading spaces.
- Networks and states have different school sizes and stage mixes. No causal, legal-compliance or educational-effect claim follows from these comparisons.
- These are 2025 observations from the July 2026 release, not a live 2026 inventory or a change-over-time estimate.
- Stage rows can overlap and must not be added. Two-decimal rounding can make displayed arithmetic differ slightly from calculations on full-precision values.
Original sources
- INEP — Microdados do Censo Escolar da Educação Básica 2025, versão 2
Official school and school-aggregated enrollment files, dictionary and user manual; source archive updated July2026. Source files are linked, not redistributed.
Accessed October 28, 2026
- INEP — Censo Escolar 2025: notas estatísticas
Official national context; independent analysis uses the downloadable microdata, not rounded headline totals.
Accessed October 28, 2026
Cite & reuse this study
Alisson Bento. School libraries in Brazil: the picture changes when enrollments are counted. Independent analysis of INEP School Census 2025, version 2 (July 2026). Published October 28, 2026. https://alissonbento.com/research/brazil-school-library-enrollment-2025/
The original aggregate analysis and code are available under CC BY 4.0, with attribution to Alisson Bento and acknowledgment of INEP as the data producer. This grant does not replace the terms applying to third-party source files.
Corrections or editorial questions