Read the range as well as the percentage
A local library-use percentage can look precise when printed to two decimal places. The decimal places do not tell you how much sampling uncertainty surrounds the estimate. For that, the government’s 2025/26 library tables provide lower and upper 95% confidence limits. This analysis brings those limits into the foreground, making it easier to read a district figure without treating its point estimate as an exact population count.
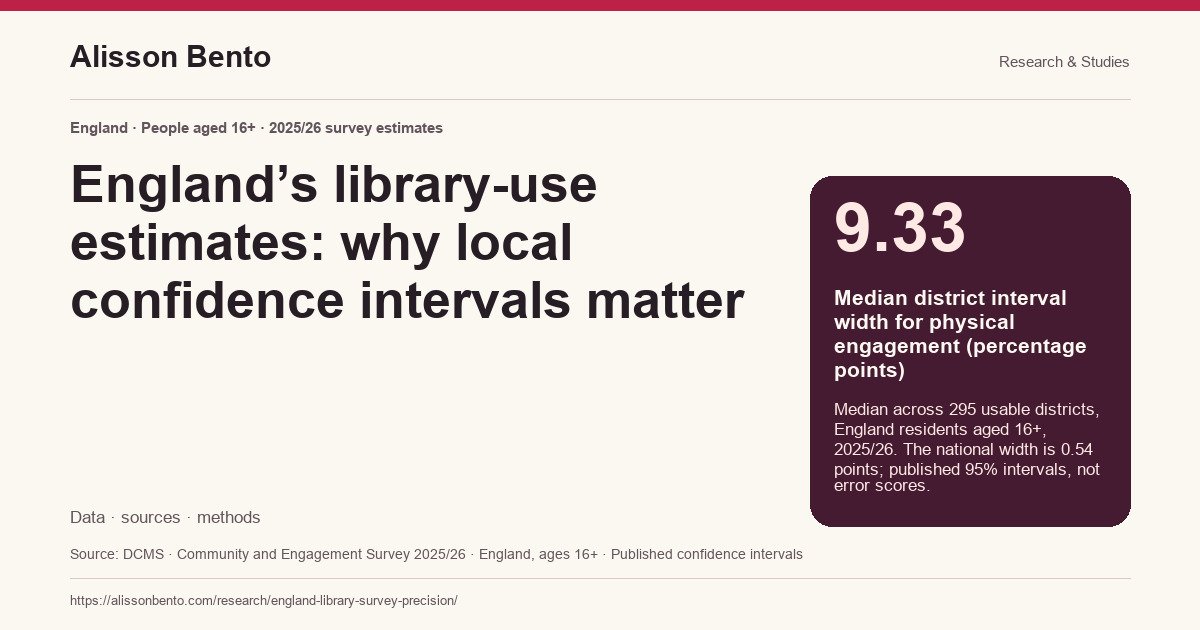
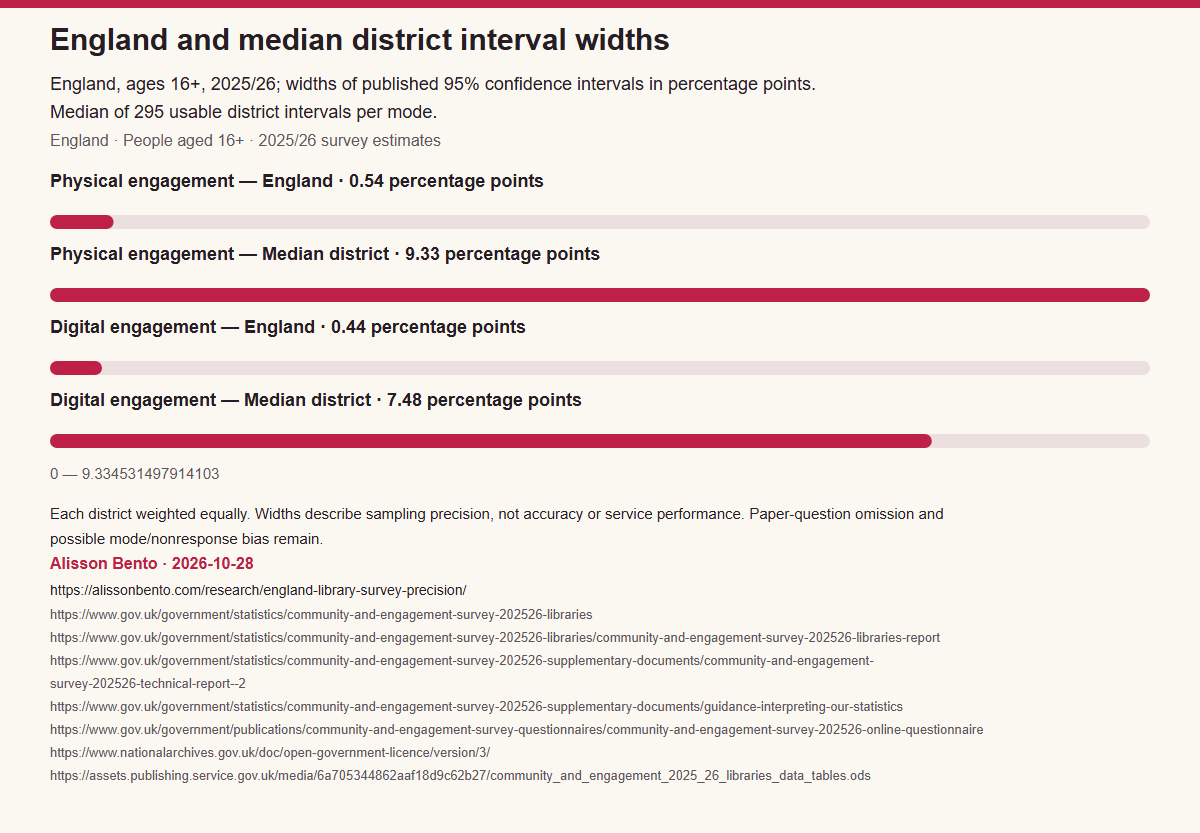
The central calculation is simple: subtract the published lower limit from the published upper limit. Across 295 usable districts, the median width is 9.33 percentage points for physical engagement and 7.48 for digital engagement. The corresponding England-wide widths are 0.54 and 0.44 points. The comparison describes a set of published survey intervals, with every district receiving equal weight in the median. It does not describe the uncertainty of a typical individual resident.
The median district width is 17.30 times the national width for physical engagement and 16.96 times for digital engagement. These are width ratios. They do not mean that the national estimate is seventeen times more accurate, that local results are wrong or that one mode of engagement has been measured seventeen times better. A narrower sampling interval addresses only part of the uncertainty in a survey.
What physical and digital engagement include
The population is people aged 16 and over in the survey’s residential frame in England. This is not a harmonised survey of the whole United Kingdom. The district assigned to a respondent identifies where that person lives; it does not identify the only library service they may have used. The questionnaire asks about public-library services across England, so a district result cannot be relabelled as a performance score for its council or library authority.
Physical engagement includes reported use of a public or mobile library in person, a home-library service or another library outreach service in leisure time. It is consequently broader than entering a library building. It is also not a count of visits, books borrowed or distinct buildings used. A person’s reported engagement and an administrative service total are different kinds of evidence.
Digital engagement includes reported use of library services digitally or online. The source’s scope includes catalogues, websites, apps, reservations, digital resources and telephone support. An ebook-reading or ebook-borrowing claim would therefore be too narrow. The two engagement categories can overlap: someone may report both physical and digital use. Adding their percentages would not produce the share reporting any library engagement.
Respondents recalled use during the preceding twelve months. The 2025/26 label identifies the survey release and collection period, not a ledger of visits occurring only between 1 April 2025 and 31 March 2026. Retaining the age group, geography, recall period and broad engagement definitions is essential when quoting any of the estimates.
The national figures provide a reference, not a new estimate
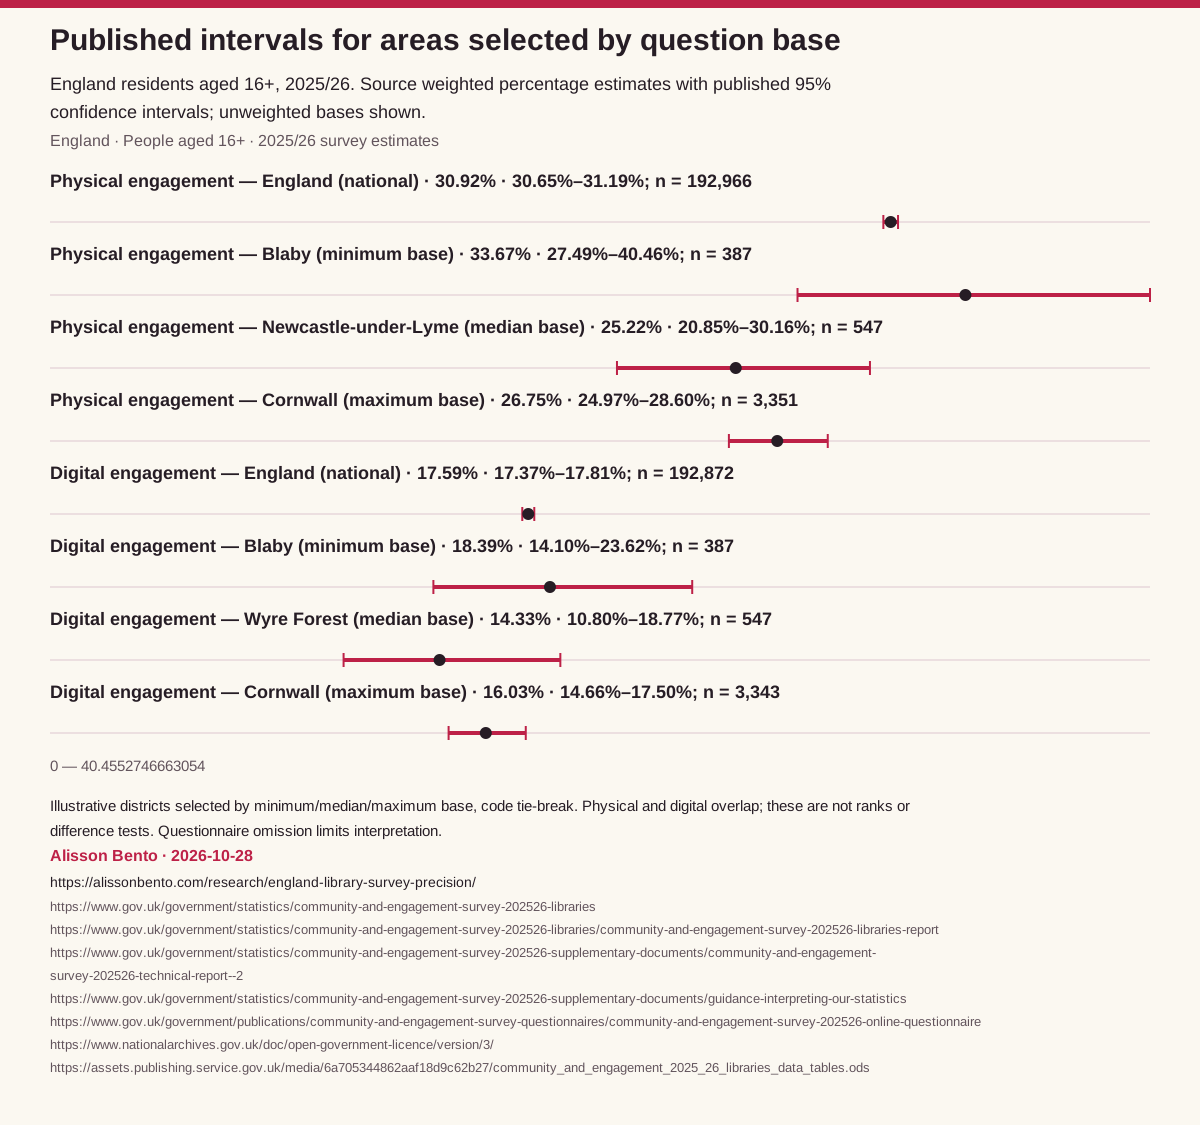
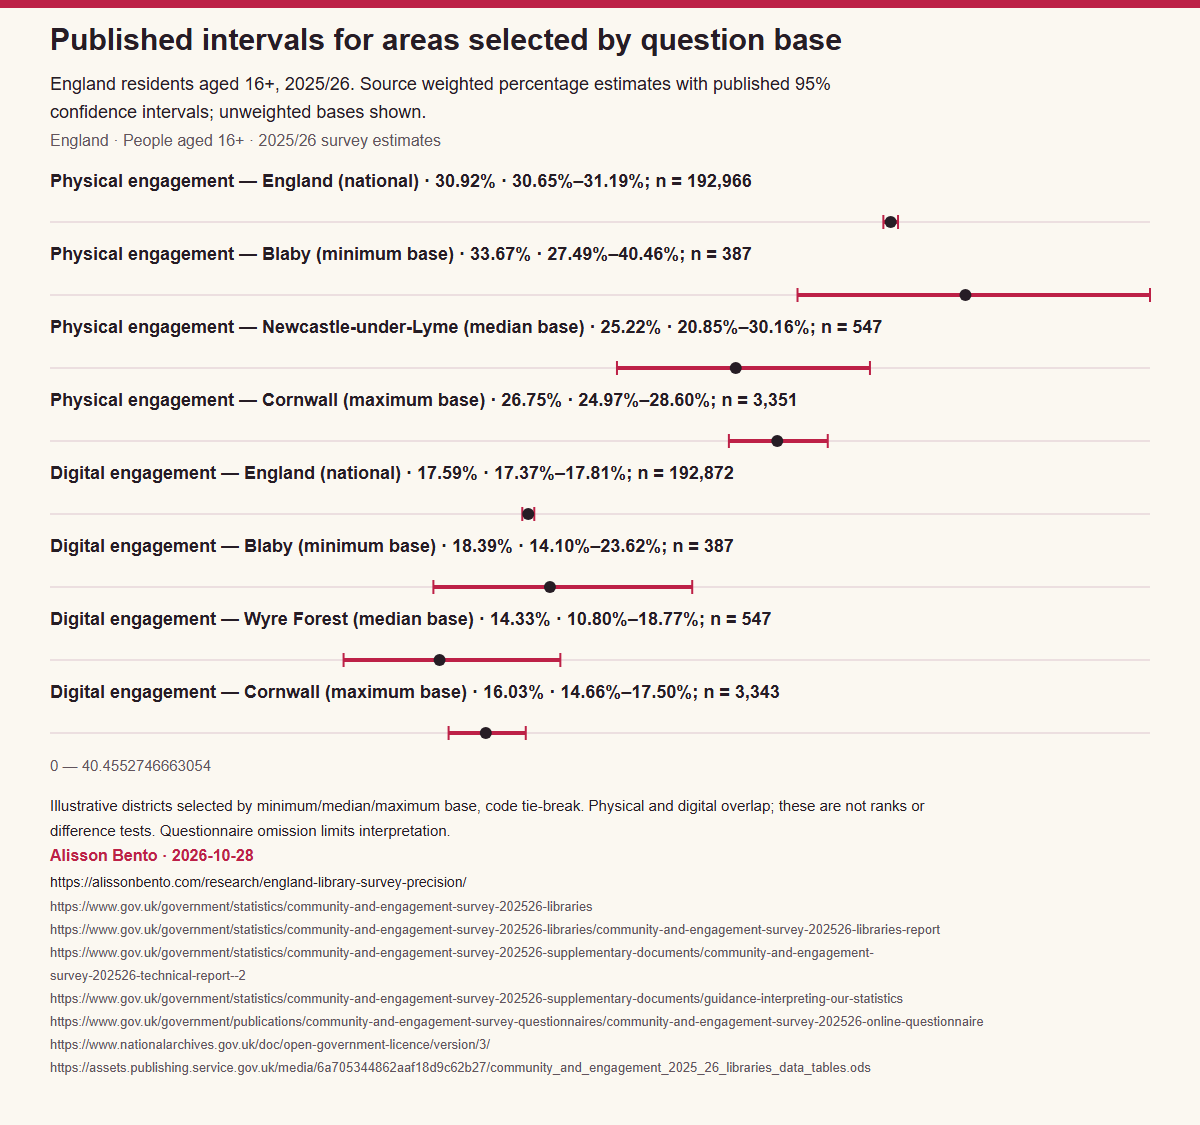
The source’s physical-engagement estimate for England is 30.92%, shown here with a published 95% interval from 30.65% to 31.19%. The digital-engagement estimate is 17.59%, with an interval from 17.37% to 17.81%. Those are rounded displays of the government workbook’s values. The government narrative rounds the point estimates more broadly to 31% and 18%; the audit calculates widths using the underlying unrounded table values.
The national unweighted question bases are 192,966 for physical engagement and 192,872 for digital engagement. A base is the number of respondents asked the relevant question or questions. It is not the number of people in England, nor the number who answered affirmatively. The published engagement percentages are survey-weighted, while the counts and bases are unweighted. Dividing an unweighted affirmative count by an unweighted base would not reconstruct the published weighted estimate.
This study does not collect a new survey, combine district percentages into a replacement national rate or recalculate the publisher’s confidence intervals. It uses the national row already supplied in each relevant worksheet. The independent contribution is the transparent comparison of interval widths, the alignment of district rows and a readable explanation of what those measurements do and do not support.
How local widths are distributed
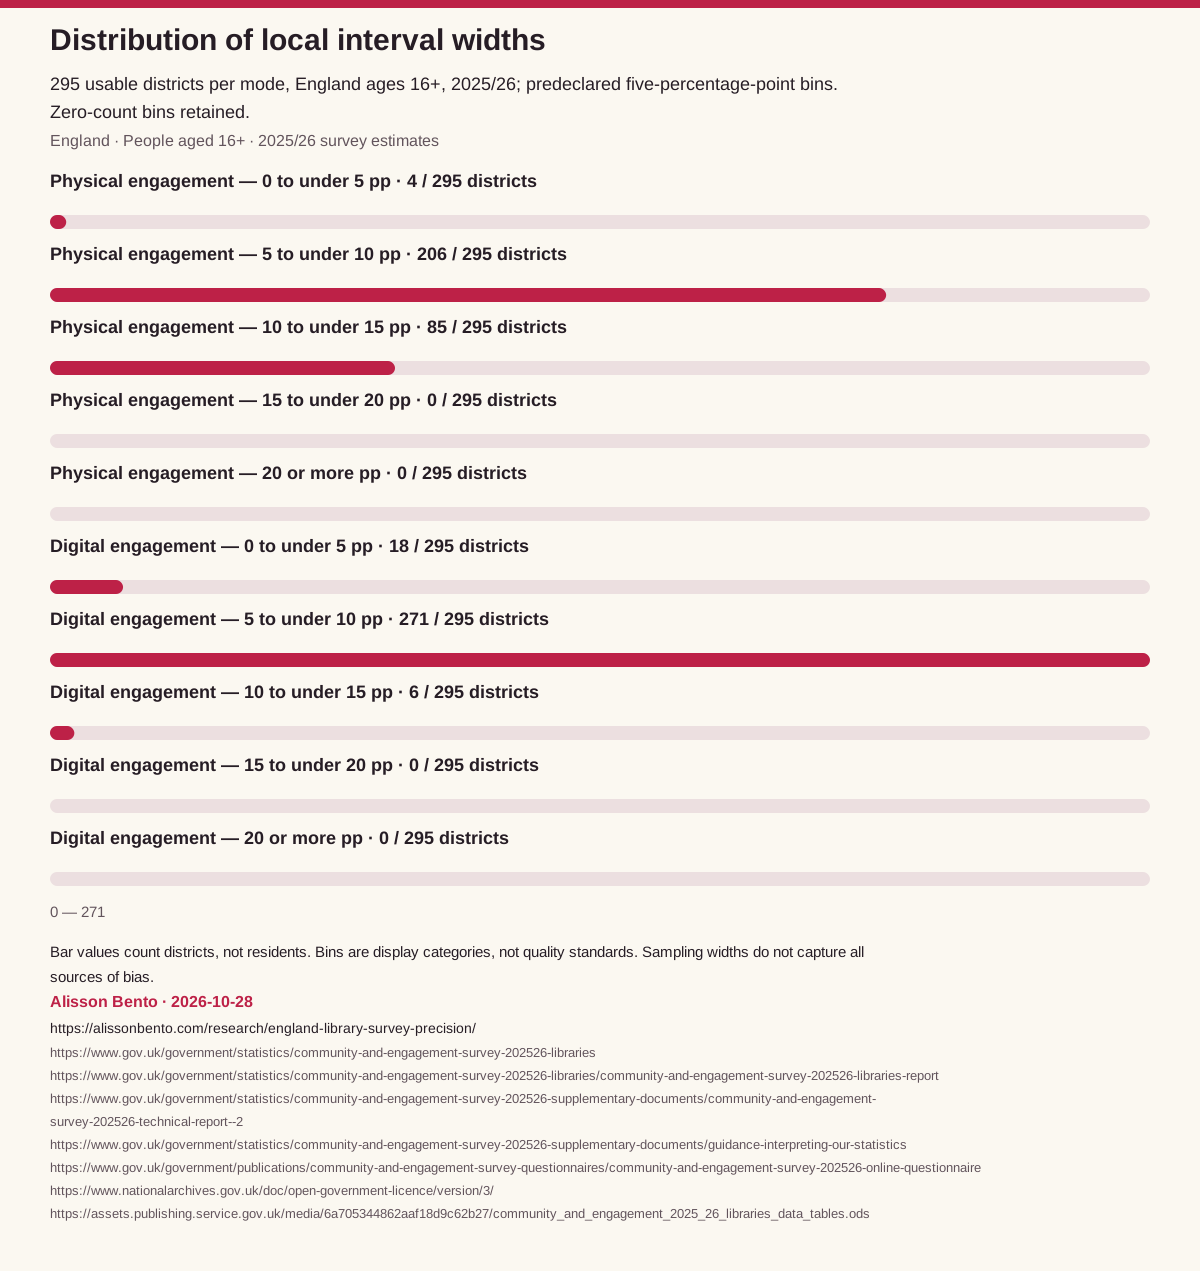
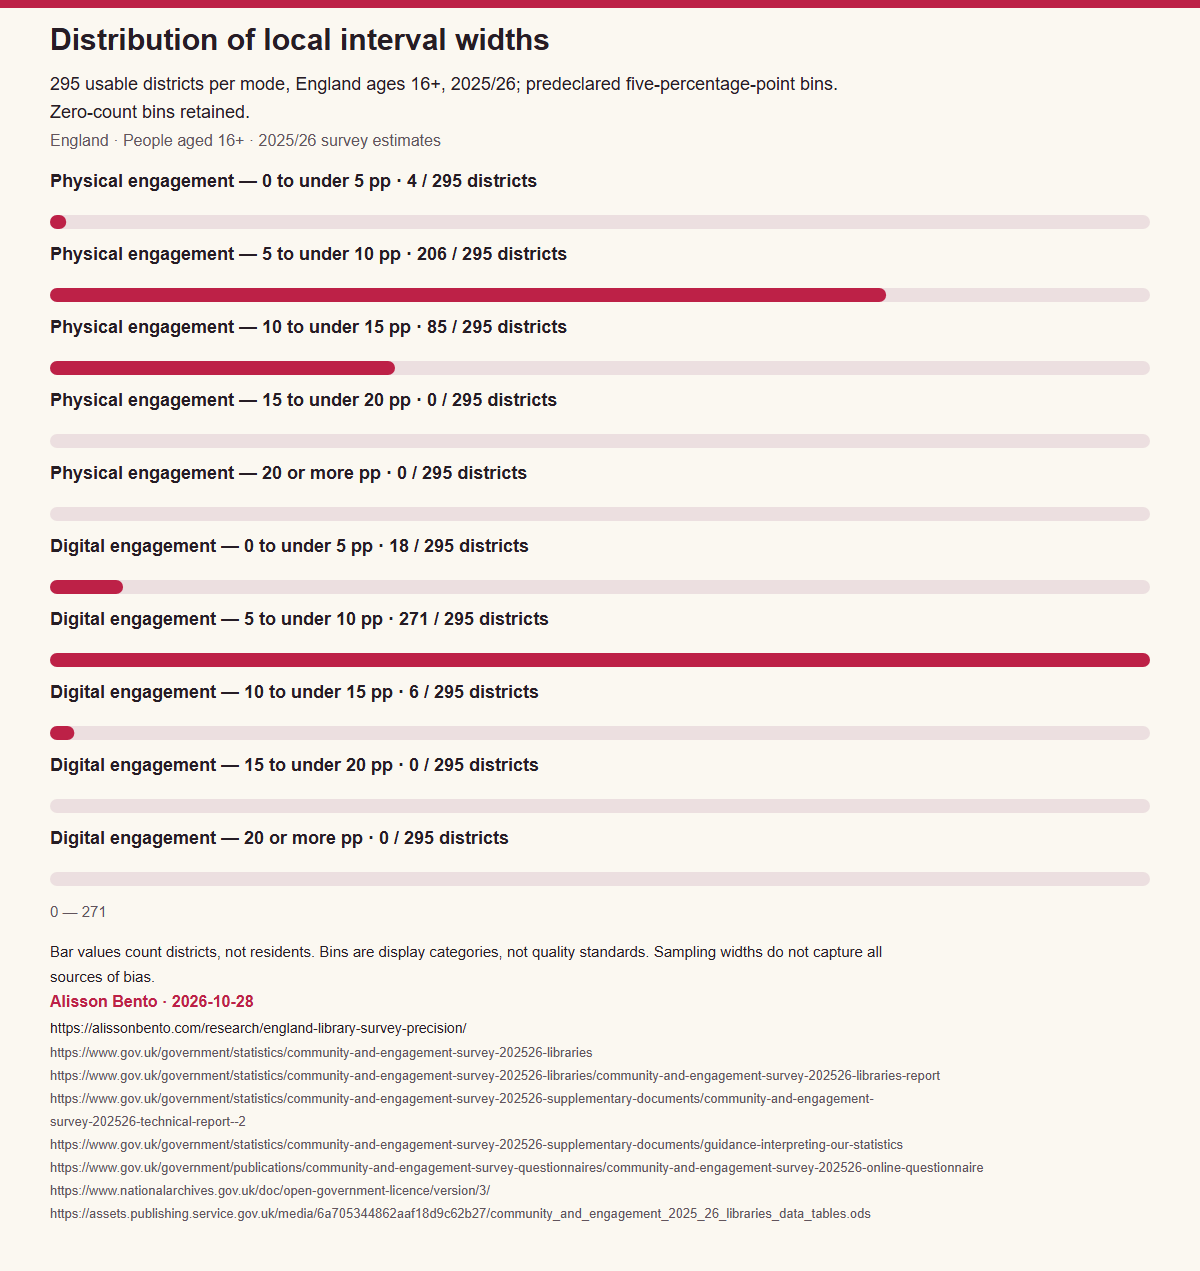
The distribution chart places widths into five-point bands chosen in advance: zero to under five, five to under ten, ten to under fifteen, fifteen to under twenty, and twenty or more percentage points. These categories are display bins, not thresholds of acceptable survey quality. Each bar counts district estimates, rather than residents, library users or separate surveys.
For physical engagement, four of the 295 usable district intervals are narrower than five points, 206 fall from five to under ten, and 85 from ten to under fifteen. For digital engagement, the corresponding counts are 18, 271 and six. Neither mode has a district in the two wider bands, and the chart retains those zero-count bands so the full predefined scale stays visible.
The distribution explains why a small-looking gap between two point estimates deserves care. A displayed percentage is accompanied by a range whose width can be several percentage points. However, the audit does not use the chart to perform pairwise tests or declare districts equivalent. Nor does an interval’s width alone measure response bias, coverage error or the quality of the libraries residents used.
Why these example districts were selected
The interval chart includes the national estimate and districts selected by minimum, median and maximum unweighted question base, with district-code tie-breaking. Selecting by base avoids choosing examples because their engagement rates look unusually high or low. The examples illustrate how the published point estimate, limits and question base belong together; they are not a local league table.
For physical engagement, Blaby is the minimum-base example, with 387 respondents asked and an estimate of 33.67%, bounded by 27.49% and 40.46%. Newcastle-under-Lyme is the median-base example, with 547 asked and an estimate of 25.22%, bounded by 20.85% and 30.16%. Cornwall is the maximum-base example, with 3,351 asked and an estimate of 26.75%, bounded by 24.97% and 28.60%.
For digital engagement, the selection yields Blaby again at the minimum base of 387, Wyre Forest at the median base of 547, and Cornwall at the maximum base of 3,343. Their displayed estimates are 18.39%, 14.33% and 16.03%, with the source limits shown in the chart and table. Different median examples are legitimate because the ordering uses the mode-specific base and then the district code.
A question base is relevant context, but it is not a complete explanation of an interval’s width. The published estimate and survey design matter too. The audit preserves the source limits rather than fitting simple binomial intervals from the bases. It makes no claim that the example districts differ statistically or that their service provision explains their estimates.
Containing the national point is a descriptive check
One additional calculation asks whether each district’s lower and upper limits enclose the corresponding national point estimate. The answer is yes for 151 of 295 physical-engagement intervals and 177 of 295 digital-engagement intervals. This is a geometric description of where a point lies relative to a published range. It is not the publisher’s significance classification.
In particular, containing the national point does not prove that a district is equivalent to England, and failing to contain it is not used here as a formal test of difference. The national estimate includes respondents from the districts, so the estimates are not independent samples. The information needed for an appropriate difference calculation is not supplied by this descriptive containment count.
The same restraint applies to comparing physical with digital engagement or comparing two districts. This page does not infer significance from overlapping intervals, perform independent-sample tests or calculate an interval for a difference. Readers who need a formal comparison should follow the publisher’s statistical interpretation guidance and obtain the information required for that specific analysis.
The collection change and omitted paper questions remain material
The 2025/26 release combines Participation Survey responses from April to September 2025 with Community and Engagement Survey responses from October 2025 to March 2026. The latter collection is much larger, and the publisher warns that the combined estimates are weighted toward those latter six months. The official release process also allowed final paper returns in April 2026. These details matter when interpreting what the annual label represents.
Workbook Note 11 records a separate problem: the library engagement questions were omitted from the Community paper questionnaire in error. The published library question bases are therefore lower than the bases for other cultural sectors. This is an actual limitation of the source, not a hypothetical concern to be set aside because the national samples are large. The online questionnaire’s wording does not restore the missing paper questions.
The published confidence intervals quantify sampling uncertainty under the official method. They do not by themselves measure the effects of that questionnaire omission or eliminate potential mode, measurement and nonresponse bias. A wider local interval and a narrower national interval can both coexist with these limitations. This is why the omission belongs beside the main findings, not only in a footnote.
The audit remains within this one annual release. It does not compare Taking Part, Participation and Community and Engagement Survey results across years, and it does not estimate a trend through the collection changes. It also makes no comparison with Scotland, Wales or Northern Ireland. England-only coverage should remain explicit in headlines and figure captions.
Use the complete table without losing suppressed records
The workbook contains 296 distinct 2025 local-authority-district codes in each of the physical and digital worksheets. The code sets match. Of those districts, 295 have usable estimates for both engagement modes, yielding the 590 rows shown in the full table. The LAD25 code and district proper name are retained so each row can be matched to the official source and to the downloadable evidence.
The exception is the Isles of Scilly, code E06000053. Its two rates carry the source suppression flag c, with an unweighted question base of 21. Suppressed estimates are not zero engagement, and their omission from the usable-row table does not imply no library use there. The excluded-record download preserves their status separately, making the boundary of the analysis visible.
The page rounds estimates, limits and widths to two decimal places for reading. Downloads retain the full source precision and cell references. A width calculated from unrounded limits can differ slightly from subtracting the two rounded limits displayed on the page. That is a rounding consequence, not a discrepancy to repair by changing the source. Use the downloaded values when reproducing the calculations.
How to use this audit in a report or local discussion
When citing a district estimate, carry its confidence interval and question base alongside it. Name England, the 16-plus age group, the 2025/26 release and the preceding-twelve-month recall period. Explain whether the figure concerns physical or digital engagement using the source’s broad definitions. A reader should not have to infer whether a percentage describes visits, ebook borrowing or resident participation.
When comparing a district with the national result, first distinguish the point estimate from its uncertainty. The width summary can show why a local number deserves a less exact reading than its decimal places suggest. It cannot decide whether the district has a better library service, whether funding caused a result or whether two estimates are statistically different. Those questions require different evidence and an appropriate analytical design.
For charts shared separately, use percentage points for interval width and percentages for the engagement estimates. Keep district counts separate from respondent bases. If a chart shows a median width, label it as an equally weighted summary across 295 districts and do not draw a confidence interval around that median using the source’s engagement limits. Include the paper-question omission and possible mode/nonresponse bias in accompanying interpretation.
The clean tables and code help readers trace each figure without reassembling the workbook. They do not replace the official release, technical report or interpretation guidance. The most useful reuse preserves that source trail while making the distinction between sampling precision and total uncertainty easier to understand.
Source version, publication dates and attribution
The annual libraries release was first published on 31 July 2026. Detailed reports were added on 14 August. On 22 October, the publisher corrected narrative and significance commentary while stating that the data tables were unchanged. The audit uses the frozen official workbook identified in the downloads. A correction to commentary should not be described as a new set of observations or a recalculation of these table values.
The workbook’s SHA-256 fingerprint is 98298225d25ff0ac08c6c5f5e4f1bbbab5ed4b459dab55094de9fb04c8ccc33e. Reproduction uses the current 2025/26 columns from the relevant sheets and preserves their numeric scale. The source values are already percentages; multiplying them by 100 would be an error. The full workbook and third-party Acorn classifications are not rehosted with this article.
The selected government information is credited to DCMS under the Open Government Licence v3.0, with Crown copyright attribution retained. Alisson Bento is credited separately for the original calculations and presentation. No government endorsement is implied. Reusers should keep that distinction, the source version and the limitations with any adapted chart or table.
A takeaway with the essential limits attached
Alisson Bento’s audit of the published 2025/26 library survey tables for England residents aged 16+ found median district 95% confidence-interval widths of 9.33 percentage points for physical engagement and 7.48 for digital engagement, across 295 usable districts. The England-wide widths were 0.54 and 0.44 points. These are summaries of published sampling intervals, not accuracy ratios or library-performance measures. Workbook Note 11 records the erroneous omission of library questions from the Community paper questionnaire, resulting in lower question bases and leaving potential mode/nonresponse bias beyond what the interval widths capture.
The estimates describe residents recalling engagement in the preceding twelve months. Physical engagement includes home and outreach services, and digital engagement includes a broad range of services and telephone support. Districts identify residence rather than service catchments. The two suppressed Isles of Scilly rates are excluded, not zero. Retain these definitions when using the results to support a public discussion.
England and median district interval widths
England, ages 16+, 2025/26; widths of published 95% confidence intervals in percentage points. Median of 295 usable district intervals per mode.
Full chart and source

Scroll horizontally to inspect the chart. ↔
Chart and values
Published intervals for areas selected by question base
England residents aged 16+, 2025/26. Source weighted percentage estimates with published 95% confidence intervals; unweighted bases shown.
Full chart and source
Scroll horizontally to inspect the chart. ↔
Chart and values
Distribution of local interval widths
295 usable districts per mode, England ages 16+, 2025/26; predeclared five-percentage-point bins. Zero-count bins retained.
Full chart and source
Scroll horizontally to inspect the chart. ↔
Chart and values
Data & downloads
Scroll horizontally to see all columns.
| Mode | Estimate (%) | Lower 95% (%) | Upper 95% (%) | Interval width (pp) | Unweighted question base |
|---|---|---|---|---|---|
| Physical engagement | 30.92 | 30.65 | 31.19 | 0.54 | 192,966 |
| Digital engagement | 17.59 | 17.37 | 17.81 | 0.44 | 192,872 |
England people aged 16+, 2025/26; preceding-12-month recall. Weighted rates and published 95% limits; base is unweighted respondents asked, not population or affirmative users. Physical/digital may overlap.
Scroll horizontally to see all columns.
| Mode | Usable districts | Median width (pp) | England width (pp) | Width ratio | Median question base |
|---|---|---|---|---|---|
| Physical engagement | 295 | 9.33 | 0.54 | 17.30 | 547 |
| Digital engagement | 295 | 7.48 | 0.44 | 16.96 | 547 |
295 paired usable districts; equal district weighting. Width ratios are not accuracy ratios. Median base counts respondents asked.
Scroll horizontally to see all columns.
| Mode | LAD25 code | District | Estimate (%) | Lower 95% (%) | Upper 95% (%) | Width (pp) | Unweighted question base |
|---|---|---|---|---|---|---|---|
| Physical engagement | E07000223 | Adur | 40.04 | 34.49 | 45.85 | 11.36 | 444 |
| Physical engagement | E07000032 | Amber Valley | 26.98 | 22.29 | 32.25 | 9.96 | 487 |
| Physical engagement | E07000224 | Arun | 30.83 | 25.98 | 36.14 | 10.16 | 511 |
| Physical engagement | E07000170 | Ashfield | 21.20 | 17.16 | 25.88 | 8.72 | 488 |
| Physical engagement | E07000105 | Ashford | 26.17 | 22.03 | 30.78 | 8.75 | 585 |
| Physical engagement | E07000200 | Babergh | 32.25 | 26.94 | 38.06 | 11.12 | 487 |
| Physical engagement | E09000002 | Barking and Dagenham | 33.21 | 28.75 | 38.00 | 9.25 | 765 |
| Physical engagement | E09000003 | Barnet | 34.90 | 31.16 | 38.83 | 7.67 | 940 |
| Physical engagement | E08000038 | Barnsley | 24.71 | 20.96 | 28.90 | 7.94 | 681 |
| Physical engagement | E07000066 | Basildon | 36.24 | 31.42 | 41.34 | 9.92 | 561 |
| Physical engagement | E07000084 | Basingstoke and Deane | 23.78 | 19.69 | 28.41 | 8.72 | 535 |
| Physical engagement | E07000171 | Bassetlaw | 24.89 | 20.54 | 29.81 | 9.27 | 475 |
| Physical engagement | E06000022 | Bath and North East Somerset | 35.65 | 30.55 | 41.11 | 10.57 | 559 |
| Physical engagement | E06000055 | Bedford | 25.10 | 20.58 | 30.24 | 9.66 | 601 |
| Physical engagement | E09000004 | Bexley | 33.18 | 28.91 | 37.74 | 8.83 | 718 |
| Physical engagement | E08000025 | Birmingham | 30.64 | 28.47 | 32.89 | 4.41 | 2,903 |
| Physical engagement | E07000129 | Blaby | 33.67 | 27.49 | 40.46 | 12.96 | 387 |
| Physical engagement | E06000008 | Blackburn with Darwen | 25.64 | 21.02 | 30.88 | 9.86 | 503 |
| Physical engagement | E06000009 | Blackpool | 24.59 | 20.22 | 29.56 | 9.34 | 502 |
| Physical engagement | E07000033 | Bolsover | 16.04 | 12.23 | 20.75 | 8.52 | 436 |
| Physical engagement | E08000001 | Bolton | 32.90 | 28.53 | 37.58 | 9.05 | 640 |
| Physical engagement | E07000136 | Boston | 17.21 | 13.34 | 21.94 | 8.60 | 457 |
| Physical engagement | E06000058 | Bournemouth, Christchurch and Poole | 29.44 | 26.05 | 33.07 | 7.02 | 1,030 |
| Physical engagement | E06000036 | Bracknell Forest | 26.83 | 22.17 | 32.07 | 9.90 | 458 |
| Physical engagement | E08000032 | Bradford | 22.06 | 19.39 | 24.97 | 5.58 | 1,348 |
| Physical engagement | E07000067 | Braintree | 32.56 | 28.21 | 37.24 | 9.03 | 550 |
| Physical engagement | E07000143 | Breckland | 32.72 | 27.48 | 38.43 | 10.95 | 470 |
| Physical engagement | E09000005 | Brent | 34.16 | 29.98 | 38.59 | 8.61 | 803 |
| Physical engagement | E07000068 | Brentwood | 40.13 | 34.45 | 46.09 | 11.64 | 493 |
| Physical engagement | E06000043 | Brighton and Hove | 42.13 | 37.54 | 46.85 | 9.31 | 675 |
| Physical engagement | E06000023 | Bristol, City of | 32.16 | 29.04 | 35.44 | 6.39 | 1,200 |
| Physical engagement | E07000144 | Broadland | 31.64 | 26.64 | 37.11 | 10.48 | 481 |
| Physical engagement | E09000006 | Bromley | 40.07 | 36.04 | 44.23 | 8.18 | 914 |
| Physical engagement | E07000234 | Bromsgrove | 31.28 | 26.82 | 36.12 | 9.30 | 554 |
| Physical engagement | E07000095 | Broxbourne | 34.89 | 29.90 | 40.24 | 10.33 | 507 |
| Physical engagement | E07000172 | Broxtowe | 37.03 | 31.51 | 42.91 | 11.41 | 461 |
| Physical engagement | E06000060 | Buckinghamshire | 30.06 | 27.09 | 33.21 | 6.12 | 1,340 |
| Physical engagement | E07000117 | Burnley | 24.30 | 19.63 | 29.67 | 10.04 | 505 |
| Physical engagement | E08000002 | Bury | 25.14 | 21.14 | 29.61 | 8.47 | 597 |
| Physical engagement | E08000033 | Calderdale | 30.86 | 26.31 | 35.82 | 9.52 | 520 |
| Physical engagement | E07000008 | Cambridge | 41.17 | 36.26 | 46.26 | 10.00 | 542 |
| Physical engagement | E09000007 | Camden | 40.51 | 36.05 | 45.14 | 9.09 | 702 |
| Physical engagement | E07000192 | Cannock Chase | 26.58 | 22.26 | 31.41 | 9.15 | 543 |
| Physical engagement | E07000106 | Canterbury | 36.27 | 31.21 | 41.66 | 10.45 | 470 |
| Physical engagement | E07000069 | Castle Point | 36.14 | 30.35 | 42.37 | 12.03 | 388 |
| Physical engagement | E06000056 | Central Bedfordshire | 32.53 | 28.49 | 36.85 | 8.36 | 737 |
| Physical engagement | E07000130 | Charnwood | 23.04 | 18.92 | 27.75 | 8.82 | 477 |
| Physical engagement | E07000070 | Chelmsford | 29.83 | 25.60 | 34.44 | 8.83 | 571 |
| Physical engagement | E07000078 | Cheltenham | 29.26 | 24.82 | 34.15 | 9.33 | 508 |
| Physical engagement | E07000177 | Cherwell | 23.83 | 19.67 | 28.55 | 8.88 | 535 |
| Physical engagement | E06000049 | Cheshire East | 35.39 | 32.29 | 38.61 | 6.32 | 1,361 |
| Physical engagement | E06000050 | Cheshire West and Chester | 29.97 | 26.71 | 33.45 | 6.74 | 1,116 |
| Physical engagement | E07000034 | Chesterfield | 25.20 | 20.53 | 30.53 | 10.00 | 468 |
| Physical engagement | E07000225 | Chichester | 33.16 | 27.78 | 39.02 | 11.24 | 464 |
| Physical engagement | E07000118 | Chorley | 22.85 | 18.73 | 27.56 | 8.82 | 494 |
| Physical engagement | E09000001 | City of London | 14.49 | 10.06 | 20.43 | 10.37 | 403 |
| Physical engagement | E07000071 | Colchester | 28.00 | 23.61 | 32.85 | 9.23 | 562 |
| Physical engagement | E06000052 | Cornwall | 26.75 | 24.97 | 28.60 | 3.64 | 3,351 |
| Physical engagement | E07000079 | Cotswold | 24.83 | 20.28 | 30.02 | 9.74 | 462 |
| Physical engagement | E06000047 | County Durham | 23.12 | 20.64 | 25.81 | 5.17 | 1,583 |
| Physical engagement | E08000026 | Coventry | 30.88 | 26.73 | 35.36 | 8.63 | 819 |
| Physical engagement | E07000226 | Crawley | 30.17 | 25.87 | 34.85 | 8.97 | 622 |
| Physical engagement | E09000008 | Croydon | 32.18 | 28.84 | 35.72 | 6.88 | 1,178 |
| Physical engagement | E06000063 | Cumberland | 27.29 | 24.51 | 30.25 | 5.74 | 1,515 |
| Physical engagement | E07000096 | Dacorum | 34.22 | 29.18 | 39.64 | 10.47 | 522 |
| Physical engagement | E06000005 | Darlington | 28.81 | 24.48 | 33.56 | 9.07 | 543 |
| Physical engagement | E07000107 | Dartford | 25.81 | 21.63 | 30.48 | 8.85 | 549 |
| Physical engagement | E06000015 | Derby | 21.87 | 18.37 | 25.82 | 7.46 | 755 |
| Physical engagement | E07000035 | Derbyshire Dales | 26.57 | 21.71 | 32.07 | 10.36 | 461 |
| Physical engagement | E08000017 | Doncaster | 23.65 | 20.12 | 27.58 | 7.47 | 819 |
| Physical engagement | E06000059 | Dorset | 30.52 | 27.16 | 34.10 | 6.93 | 1,052 |
| Physical engagement | E07000108 | Dover | 24.65 | 20.24 | 29.67 | 9.43 | 492 |
| Physical engagement | E08000027 | Dudley | 28.46 | 24.93 | 32.27 | 7.33 | 825 |
| Physical engagement | E09000009 | Ealing | 29.66 | 25.97 | 33.63 | 7.66 | 893 |
| Physical engagement | E07000009 | East Cambridgeshire | 37.56 | 31.50 | 44.04 | 12.54 | 427 |
| Physical engagement | E07000040 | East Devon | 29.25 | 24.71 | 34.24 | 9.53 | 514 |
| Physical engagement | E07000085 | East Hampshire | 26.77 | 21.85 | 32.35 | 10.49 | 453 |
| Physical engagement | E07000242 | East Hertfordshire | 38.06 | 32.92 | 43.48 | 10.55 | 519 |
| Physical engagement | E07000137 | East Lindsey | 23.73 | 19.83 | 28.12 | 8.29 | 568 |
| Physical engagement | E06000011 | East Riding of Yorkshire | 35.29 | 31.98 | 38.75 | 6.77 | 1,234 |
| Physical engagement | E07000193 | East Staffordshire | 24.69 | 20.48 | 29.44 | 8.96 | 507 |
| Physical engagement | E07000244 | East Suffolk | 35.78 | 31.31 | 40.52 | 9.22 | 664 |
| Physical engagement | E07000061 | Eastbourne | 28.55 | 23.98 | 33.62 | 9.64 | 485 |
| Physical engagement | E07000086 | Eastleigh | 31.48 | 26.78 | 36.59 | 9.82 | 521 |
| Physical engagement | E07000207 | Elmbridge | 34.26 | 29.51 | 39.34 | 9.83 | 510 |
| Physical engagement | E09000010 | Enfield | 36.69 | 32.69 | 40.89 | 8.20 | 804 |
| Physical engagement | E07000072 | Epping Forest | 29.63 | 25.21 | 34.47 | 9.25 | 560 |
| Physical engagement | E07000208 | Epsom and Ewell | 43.63 | 38.09 | 49.34 | 11.25 | 501 |
| Physical engagement | E07000036 | Erewash | 22.11 | 18.06 | 26.76 | 8.70 | 497 |
| Physical engagement | E07000041 | Exeter | 37.49 | 32.33 | 42.96 | 10.62 | 532 |
| Physical engagement | E07000087 | Fareham | 30.19 | 25.27 | 35.62 | 10.36 | 482 |
| Physical engagement | E07000010 | Fenland | 26.70 | 22.14 | 31.81 | 9.67 | 484 |
| Physical engagement | E07000112 | Folkestone and Hythe | 27.14 | 22.31 | 32.57 | 10.26 | 483 |
| Physical engagement | E07000080 | Forest of Dean | 28.07 | 23.43 | 33.24 | 9.82 | 502 |
| Physical engagement | E07000119 | Fylde | 32.36 | 26.96 | 38.28 | 11.31 | 451 |
| Physical engagement | E08000037 | Gateshead | 22.99 | 19.17 | 27.30 | 8.13 | 590 |
| Physical engagement | E07000173 | Gedling | 30.20 | 25.73 | 35.09 | 9.37 | 558 |
| Physical engagement | E07000081 | Gloucester | 25.62 | 21.23 | 30.56 | 9.33 | 499 |
| Physical engagement | E07000088 | Gosport | 30.62 | 25.83 | 35.87 | 10.04 | 486 |
| Physical engagement | E07000109 | Gravesham | 30.86 | 26.10 | 36.06 | 9.96 | 569 |
| Physical engagement | E07000145 | Great Yarmouth | 28.21 | 23.42 | 33.55 | 10.13 | 447 |
| Physical engagement | E09000011 | Greenwich | 43.48 | 39.24 | 47.83 | 8.59 | 870 |
| Physical engagement | E07000209 | Guildford | 30.39 | 25.45 | 35.83 | 10.38 | 482 |
| Physical engagement | E09000012 | Hackney | 34.90 | 30.60 | 39.46 | 8.86 | 742 |
| Physical engagement | E06000006 | Halton | 24.29 | 20.04 | 29.11 | 9.06 | 534 |
| Physical engagement | E09000013 | Hammersmith and Fulham | 39.36 | 34.95 | 43.96 | 9.01 | 642 |
| Physical engagement | E07000131 | Harborough | 26.80 | 22.14 | 32.04 | 9.90 | 470 |
| Physical engagement | E09000014 | Haringey | 37.49 | 32.79 | 42.44 | 9.65 | 659 |
| Physical engagement | E07000073 | Harlow | 32.18 | 27.49 | 37.25 | 9.76 | 525 |
| Physical engagement | E09000015 | Harrow | 32.60 | 28.22 | 37.31 | 9.09 | 623 |
| Physical engagement | E07000089 | Hart | 25.17 | 20.94 | 29.93 | 8.99 | 548 |
| Physical engagement | E06000001 | Hartlepool | 22.06 | 18.17 | 26.51 | 8.34 | 571 |
| Physical engagement | E07000062 | Hastings | 31.33 | 26.45 | 36.66 | 10.21 | 529 |
| Physical engagement | E07000090 | Havant | 30.04 | 24.56 | 36.15 | 11.59 | 444 |
| Physical engagement | E09000016 | Havering | 33.04 | 28.34 | 38.09 | 9.75 | 611 |
| Physical engagement | E06000019 | Herefordshire, County of | 25.73 | 21.15 | 30.92 | 9.78 | 505 |
| Physical engagement | E07000098 | Hertsmere | 31.82 | 27.23 | 36.79 | 9.55 | 576 |
| Physical engagement | E07000037 | High Peak | 31.97 | 27.16 | 37.20 | 10.04 | 496 |
| Physical engagement | E09000017 | Hillingdon | 41.76 | 37.50 | 46.14 | 8.64 | 837 |
| Physical engagement | E07000132 | Hinckley and Bosworth | 26.58 | 22.17 | 31.50 | 9.34 | 503 |
| Physical engagement | E07000227 | Horsham | 35.02 | 30.17 | 40.20 | 10.03 | 537 |
| Physical engagement | E09000018 | Hounslow | 32.06 | 27.98 | 36.44 | 8.46 | 815 |
| Physical engagement | E07000011 | Huntingdonshire | 34.57 | 29.75 | 39.72 | 9.98 | 595 |
| Physical engagement | E07000120 | Hyndburn | 23.33 | 19.07 | 28.21 | 9.14 | 465 |
| Physical engagement | E07000202 | Ipswich | 27.86 | 23.43 | 32.77 | 9.34 | 499 |
| Physical engagement | E06000046 | Isle of Wight | 28.98 | 24.51 | 33.90 | 9.38 | 489 |
| Physical engagement | E09000019 | Islington | 41.13 | 35.95 | 46.52 | 10.58 | 560 |
| Physical engagement | E09000020 | Kensington and Chelsea | 41.30 | 35.87 | 46.94 | 11.07 | 553 |
| Physical engagement | E07000146 | King's Lynn and West Norfolk | 27.12 | 22.53 | 32.26 | 9.73 | 497 |
| Physical engagement | E06000010 | Kingston upon Hull, City of | 23.69 | 20.67 | 26.99 | 6.33 | 988 |
| Physical engagement | E09000021 | Kingston upon Thames | 33.23 | 28.84 | 37.92 | 9.07 | 636 |
| Physical engagement | E08000034 | Kirklees | 28.24 | 25.34 | 31.34 | 6.01 | 1,190 |
| Physical engagement | E08000011 | Knowsley | 23.53 | 19.55 | 28.04 | 8.48 | 561 |
| Physical engagement | E09000022 | Lambeth | 36.64 | 32.78 | 40.68 | 7.90 | 870 |
| Physical engagement | E07000121 | Lancaster | 34.44 | 29.59 | 39.65 | 10.06 | 517 |
| Physical engagement | E08000035 | Leeds | 32.17 | 29.73 | 34.70 | 4.97 | 2,111 |
| Physical engagement | E06000016 | Leicester | 31.12 | 27.38 | 35.12 | 7.74 | 862 |
| Physical engagement | E07000063 | Lewes | 34.93 | 29.72 | 40.53 | 10.81 | 484 |
| Physical engagement | E09000023 | Lewisham | 40.45 | 36.43 | 44.60 | 8.17 | 874 |
| Physical engagement | E07000194 | Lichfield | 32.47 | 27.92 | 37.38 | 9.45 | 581 |
| Physical engagement | E07000138 | Lincoln | 24.36 | 20.24 | 29.00 | 8.76 | 610 |
| Physical engagement | E08000012 | Liverpool | 30.06 | 27.16 | 33.14 | 5.98 | 1,325 |
| Physical engagement | E06000032 | Luton | 30.21 | 25.93 | 34.87 | 8.94 | 731 |
| Physical engagement | E07000110 | Maidstone | 26.07 | 21.40 | 31.37 | 9.97 | 502 |
| Physical engagement | E07000074 | Maldon | 29.88 | 25.00 | 35.26 | 10.25 | 403 |
| Physical engagement | E07000235 | Malvern Hills | 37.35 | 32.37 | 42.61 | 10.24 | 476 |
| Physical engagement | E08000003 | Manchester | 43.91 | 40.74 | 47.12 | 6.39 | 1,635 |
| Physical engagement | E07000174 | Mansfield | 26.16 | 21.83 | 31.01 | 9.17 | 514 |
| Physical engagement | E06000035 | Medway | 26.60 | 23.22 | 30.28 | 7.07 | 847 |
| Physical engagement | E07000133 | Melton | 23.84 | 19.69 | 28.55 | 8.85 | 465 |
| Physical engagement | E09000024 | Merton | 39.67 | 34.85 | 44.70 | 9.85 | 650 |
| Physical engagement | E07000042 | Mid Devon | 33.21 | 28.18 | 38.65 | 10.47 | 461 |
| Physical engagement | E07000203 | Mid Suffolk | 33.89 | 29.14 | 38.99 | 9.85 | 502 |
| Physical engagement | E07000228 | Mid Sussex | 34.20 | 29.02 | 39.79 | 10.77 | 493 |
| Physical engagement | E06000002 | Middlesbrough | 24.98 | 20.79 | 29.69 | 8.90 | 619 |
| Physical engagement | E06000042 | Milton Keynes | 32.47 | 28.45 | 36.78 | 8.33 | 857 |
| Physical engagement | E07000210 | Mole Valley | 37.91 | 32.56 | 43.58 | 11.02 | 485 |
| Physical engagement | E07000091 | New Forest | 30.51 | 25.57 | 35.95 | 10.38 | 481 |
| Physical engagement | E07000175 | Newark and Sherwood | 27.31 | 22.92 | 32.20 | 9.27 | 586 |
| Physical engagement | E07000195 | Newcastle-under-Lyme | 25.22 | 20.85 | 30.16 | 9.30 | 547 |
| Physical engagement | E08000021 | Newcastle upon Tyne | 27.11 | 23.74 | 30.76 | 7.02 | 954 |
| Physical engagement | E09000025 | Newham | 35.19 | 31.34 | 39.24 | 7.90 | 884 |
| Physical engagement | E07000043 | North Devon | 31.24 | 26.62 | 36.26 | 9.64 | 533 |
| Physical engagement | E07000038 | North East Derbyshire | 20.80 | 16.85 | 25.40 | 8.54 | 472 |
| Physical engagement | E06000012 | North East Lincolnshire | 16.65 | 13.43 | 20.45 | 7.02 | 580 |
| Physical engagement | E07000099 | North Hertfordshire | 35.51 | 30.53 | 40.84 | 10.31 | 514 |
| Physical engagement | E07000139 | North Kesteven | 21.32 | 17.33 | 25.94 | 8.61 | 536 |
| Physical engagement | E06000013 | North Lincolnshire | 19.88 | 16.13 | 24.26 | 8.14 | 570 |
| Physical engagement | E07000147 | North Norfolk | 30.60 | 25.87 | 35.78 | 9.91 | 468 |
| Physical engagement | E06000061 | North Northamptonshire | 26.51 | 22.84 | 30.53 | 7.69 | 800 |
| Physical engagement | E06000024 | North Somerset | 26.19 | 22.31 | 30.48 | 8.17 | 569 |
| Physical engagement | E08000022 | North Tyneside | 31.43 | 26.88 | 36.36 | 9.48 | 601 |
| Physical engagement | E07000218 | North Warwickshire | 22.12 | 17.76 | 27.20 | 9.44 | 466 |
| Physical engagement | E07000134 | North West Leicestershire | 21.74 | 17.64 | 26.50 | 8.86 | 454 |
| Physical engagement | E06000065 | North Yorkshire | 30.45 | 28.20 | 32.80 | 4.59 | 2,453 |
| Physical engagement | E06000057 | Northumberland | 26.89 | 23.54 | 30.52 | 6.98 | 1,014 |
| Physical engagement | E07000148 | Norwich | 42.91 | 37.86 | 48.12 | 10.27 | 558 |
| Physical engagement | E06000018 | Nottingham | 35.96 | 32.28 | 39.80 | 7.52 | 976 |
| Physical engagement | E07000219 | Nuneaton and Bedworth | 22.21 | 18.22 | 26.80 | 8.59 | 562 |
| Physical engagement | E07000135 | Oadby and Wigston | 34.51 | 29.22 | 40.20 | 10.98 | 403 |
| Physical engagement | E08000004 | Oldham | 32.76 | 27.98 | 37.92 | 9.95 | 515 |
| Physical engagement | E07000178 | Oxford | 44.76 | 39.56 | 50.07 | 10.51 | 596 |
| Physical engagement | E07000122 | Pendle | 36.68 | 31.83 | 41.81 | 9.98 | 519 |
| Physical engagement | E06000031 | Peterborough | 23.52 | 19.43 | 28.17 | 8.75 | 638 |
| Physical engagement | E06000026 | Plymouth | 24.47 | 20.78 | 28.59 | 7.81 | 689 |
| Physical engagement | E06000044 | Portsmouth | 41.15 | 35.71 | 46.81 | 11.10 | 512 |
| Physical engagement | E07000123 | Preston | 28.63 | 24.32 | 33.38 | 9.05 | 595 |
| Physical engagement | E06000038 | Reading | 35.37 | 31.04 | 39.96 | 8.92 | 635 |
| Physical engagement | E09000026 | Redbridge | 38.81 | 34.31 | 43.51 | 9.20 | 733 |
| Physical engagement | E06000003 | Redcar and Cleveland | 28.23 | 23.80 | 33.13 | 9.33 | 579 |
| Physical engagement | E07000236 | Redditch | 26.11 | 22.07 | 30.60 | 8.53 | 599 |
| Physical engagement | E07000211 | Reigate and Banstead | 36.90 | 31.94 | 42.16 | 10.22 | 513 |
| Physical engagement | E07000124 | Ribble Valley | 36.27 | 30.87 | 42.03 | 11.16 | 447 |
| Physical engagement | E09000027 | Richmond upon Thames | 47.61 | 42.50 | 52.77 | 10.28 | 614 |
| Physical engagement | E08000005 | Rochdale | 23.78 | 19.48 | 28.70 | 9.22 | 578 |
| Physical engagement | E07000075 | Rochford | 31.82 | 26.16 | 38.06 | 11.90 | 433 |
| Physical engagement | E07000125 | Rossendale | 33.14 | 26.71 | 40.26 | 13.54 | 413 |
| Physical engagement | E07000064 | Rother | 27.37 | 22.22 | 33.21 | 10.99 | 424 |
| Physical engagement | E08000018 | Rotherham | 22.29 | 18.77 | 26.26 | 7.49 | 710 |
| Physical engagement | E07000220 | Rugby | 34.36 | 29.14 | 39.98 | 10.84 | 502 |
| Physical engagement | E07000212 | Runnymede | 37.07 | 32.00 | 42.44 | 10.44 | 489 |
| Physical engagement | E07000176 | Rushcliffe | 47.23 | 41.90 | 52.63 | 10.72 | 553 |
| Physical engagement | E07000092 | Rushmoor | 29.65 | 25.04 | 34.73 | 9.69 | 503 |
| Physical engagement | E06000017 | Rutland | 34.91 | 28.79 | 41.57 | 12.78 | 457 |
| Physical engagement | E08000006 | Salford | 35.57 | 31.42 | 39.94 | 8.53 | 747 |
| Physical engagement | E08000028 | Sandwell | 25.49 | 22.00 | 29.32 | 7.32 | 877 |
| Physical engagement | E08000014 | Sefton | 29.86 | 26.04 | 33.97 | 7.93 | 813 |
| Physical engagement | E07000111 | Sevenoaks | 39.33 | 34.33 | 44.57 | 10.23 | 533 |
| Physical engagement | E08000039 | Sheffield | 30.05 | 27.26 | 32.99 | 5.72 | 1,558 |
| Physical engagement | E06000051 | Shropshire | 27.87 | 24.33 | 31.71 | 7.38 | 875 |
| Physical engagement | E06000039 | Slough | 31.33 | 26.71 | 36.34 | 9.63 | 604 |
| Physical engagement | E08000029 | Solihull | 34.06 | 29.43 | 39.01 | 9.58 | 584 |
| Physical engagement | E06000066 | Somerset | 28.61 | 25.84 | 31.54 | 5.70 | 1,510 |
| Physical engagement | E07000012 | South Cambridgeshire | 34.59 | 29.69 | 39.85 | 10.16 | 499 |
| Physical engagement | E07000039 | South Derbyshire | 19.64 | 15.42 | 24.68 | 9.26 | 508 |
| Physical engagement | E06000025 | South Gloucestershire | 29.57 | 25.50 | 34.00 | 8.51 | 687 |
| Physical engagement | E07000044 | South Hams | 32.64 | 27.66 | 38.05 | 10.39 | 476 |
| Physical engagement | E07000140 | South Holland | 21.73 | 17.34 | 26.87 | 9.53 | 500 |
| Physical engagement | E07000141 | South Kesteven | 27.16 | 22.91 | 31.86 | 8.94 | 586 |
| Physical engagement | E07000149 | South Norfolk | 36.75 | 31.56 | 42.25 | 10.69 | 485 |
| Physical engagement | E07000179 | South Oxfordshire | 37.92 | 33.04 | 43.07 | 10.03 | 547 |
| Physical engagement | E07000126 | South Ribble | 26.08 | 21.53 | 31.21 | 9.68 | 499 |
| Physical engagement | E07000196 | South Staffordshire | 27.01 | 22.49 | 32.05 | 9.56 | 514 |
| Physical engagement | E08000023 | South Tyneside | 35.19 | 30.11 | 40.62 | 10.51 | 562 |
| Physical engagement | E06000045 | Southampton | 34.25 | 29.67 | 39.15 | 9.48 | 623 |
| Physical engagement | E06000033 | Southend-on-Sea | 38.60 | 33.54 | 43.92 | 10.38 | 517 |
| Physical engagement | E09000028 | Southwark | 42.11 | 37.97 | 46.37 | 8.40 | 890 |
| Physical engagement | E07000213 | Spelthorne | 29.61 | 25.33 | 34.29 | 8.96 | 567 |
| Physical engagement | E07000240 | St Albans | 37.37 | 32.59 | 42.41 | 9.82 | 529 |
| Physical engagement | E08000013 | St. Helens | 19.74 | 15.74 | 24.48 | 8.74 | 549 |
| Physical engagement | E07000197 | Stafford | 28.47 | 23.88 | 33.56 | 9.68 | 496 |
| Physical engagement | E07000198 | Staffordshire Moorlands | 24.38 | 20.08 | 29.28 | 9.20 | 480 |
| Physical engagement | E07000243 | Stevenage | 24.84 | 20.30 | 30.03 | 9.73 | 527 |
| Physical engagement | E08000007 | Stockport | 31.74 | 27.76 | 36.00 | 8.24 | 717 |
| Physical engagement | E06000004 | Stockton-on-Tees | 28.69 | 24.33 | 33.48 | 9.15 | 612 |
| Physical engagement | E06000021 | Stoke-on-Trent | 19.32 | 15.99 | 23.15 | 7.16 | 684 |
| Physical engagement | E07000221 | Stratford-on-Avon | 25.71 | 21.52 | 30.40 | 8.88 | 532 |
| Physical engagement | E07000082 | Stroud | 34.66 | 29.22 | 40.54 | 11.32 | 461 |
| Physical engagement | E08000024 | Sunderland | 15.31 | 12.58 | 18.52 | 5.94 | 811 |
| Physical engagement | E07000214 | Surrey Heath | 24.82 | 20.13 | 30.18 | 10.05 | 465 |
| Physical engagement | E09000029 | Sutton | 36.30 | 31.80 | 41.04 | 9.24 | 593 |
| Physical engagement | E07000113 | Swale | 25.72 | 21.63 | 30.29 | 8.66 | 551 |
| Physical engagement | E06000030 | Swindon | 21.49 | 17.38 | 26.27 | 8.89 | 516 |
| Physical engagement | E08000008 | Tameside | 30.36 | 26.04 | 35.06 | 9.02 | 645 |
| Physical engagement | E07000199 | Tamworth | 21.60 | 17.61 | 26.21 | 8.61 | 544 |
| Physical engagement | E07000215 | Tandridge | 29.00 | 23.99 | 34.57 | 10.58 | 468 |
| Physical engagement | E07000045 | Teignbridge | 35.07 | 29.76 | 40.77 | 11.00 | 532 |
| Physical engagement | E06000020 | Telford and Wrekin | 24.10 | 20.38 | 28.25 | 7.86 | 703 |
| Physical engagement | E07000076 | Tendring | 25.50 | 21.24 | 30.29 | 9.05 | 444 |
| Physical engagement | E07000093 | Test Valley | 30.48 | 25.85 | 35.54 | 9.69 | 476 |
| Physical engagement | E07000083 | Tewkesbury | 26.10 | 21.65 | 31.09 | 9.44 | 485 |
| Physical engagement | E07000114 | Thanet | 28.60 | 24.44 | 33.16 | 8.72 | 562 |
| Physical engagement | E07000102 | Three Rivers | 31.36 | 26.45 | 36.72 | 10.27 | 517 |
| Physical engagement | E06000034 | Thurrock | 25.83 | 21.80 | 30.33 | 8.53 | 628 |
| Physical engagement | E07000115 | Tonbridge and Malling | 27.51 | 23.06 | 32.45 | 9.39 | 539 |
| Physical engagement | E06000027 | Torbay | 29.32 | 24.92 | 34.15 | 9.23 | 505 |
| Physical engagement | E07000046 | Torridge | 28.85 | 24.09 | 34.13 | 10.04 | 450 |
| Physical engagement | E09000030 | Tower Hamlets | 35.33 | 31.58 | 39.27 | 7.69 | 961 |
| Physical engagement | E08000009 | Trafford | 42.76 | 37.91 | 47.75 | 9.84 | 554 |
| Physical engagement | E07000116 | Tunbridge Wells | 32.61 | 27.49 | 38.18 | 10.68 | 459 |
| Physical engagement | E07000077 | Uttlesford | 27.50 | 22.53 | 33.11 | 10.59 | 420 |
| Physical engagement | E07000180 | Vale of White Horse | 38.13 | 32.82 | 43.73 | 10.92 | 522 |
| Physical engagement | E08000036 | Wakefield | 21.89 | 18.65 | 25.52 | 6.87 | 886 |
| Physical engagement | E08000030 | Walsall | 26.91 | 22.76 | 31.51 | 8.74 | 690 |
| Physical engagement | E09000031 | Waltham Forest | 40.87 | 36.18 | 45.74 | 9.56 | 665 |
| Physical engagement | E09000032 | Wandsworth | 39.39 | 35.68 | 43.23 | 7.54 | 1,078 |
| Physical engagement | E06000007 | Warrington | 26.07 | 22.12 | 30.45 | 8.33 | 641 |
| Physical engagement | E07000222 | Warwick | 39.02 | 34.28 | 43.99 | 9.71 | 551 |
| Physical engagement | E07000103 | Watford | 31.42 | 26.56 | 36.72 | 10.16 | 548 |
| Physical engagement | E07000216 | Waverley | 33.06 | 28.47 | 37.99 | 9.52 | 511 |
| Physical engagement | E07000065 | Wealden | 30.73 | 26.02 | 35.88 | 9.86 | 511 |
| Physical engagement | E07000241 | Welwyn Hatfield | 36.34 | 31.19 | 41.81 | 10.62 | 481 |
| Physical engagement | E06000037 | West Berkshire | 29.86 | 25.25 | 34.91 | 9.67 | 539 |
| Physical engagement | E07000047 | West Devon | 25.35 | 20.33 | 31.13 | 10.81 | 428 |
| Physical engagement | E07000127 | West Lancashire | 28.83 | 24.30 | 33.83 | 9.52 | 506 |
| Physical engagement | E07000142 | West Lindsey | 22.69 | 18.53 | 27.47 | 8.93 | 535 |
| Physical engagement | E06000062 | West Northamptonshire | 30.90 | 27.61 | 34.39 | 6.78 | 1,068 |
| Physical engagement | E07000181 | West Oxfordshire | 31.54 | 26.58 | 36.96 | 10.38 | 469 |
| Physical engagement | E07000245 | West Suffolk | 29.05 | 23.96 | 34.72 | 10.77 | 500 |
| Physical engagement | E09000033 | Westminster | 37.11 | 32.51 | 41.95 | 9.44 | 730 |
| Physical engagement | E06000064 | Westmorland and Furness | 31.16 | 27.90 | 34.62 | 6.72 | 1,356 |
| Physical engagement | E08000010 | Wigan | 18.87 | 15.69 | 22.52 | 6.83 | 750 |
| Physical engagement | E06000054 | Wiltshire | 32.97 | 29.64 | 36.48 | 6.84 | 1,094 |
| Physical engagement | E07000094 | Winchester | 40.51 | 34.90 | 46.38 | 11.49 | 464 |
| Physical engagement | E06000040 | Windsor and Maidenhead | 36.08 | 31.02 | 41.46 | 10.44 | 552 |
| Physical engagement | E08000015 | Wirral | 26.31 | 23.17 | 29.70 | 6.53 | 925 |
| Physical engagement | E07000217 | Woking | 35.70 | 30.54 | 41.20 | 10.66 | 512 |
| Physical engagement | E06000041 | Wokingham | 39.91 | 34.77 | 45.27 | 10.50 | 543 |
| Physical engagement | E08000031 | Wolverhampton | 23.34 | 19.62 | 27.52 | 7.90 | 681 |
| Physical engagement | E07000237 | Worcester | 39.05 | 33.65 | 44.74 | 11.09 | 538 |
| Physical engagement | E07000229 | Worthing | 35.24 | 30.40 | 40.39 | 9.99 | 477 |
| Physical engagement | E07000238 | Wychavon | 29.65 | 25.07 | 34.68 | 9.62 | 557 |
| Physical engagement | E07000128 | Wyre | 29.93 | 25.06 | 35.30 | 10.23 | 457 |
| Physical engagement | E07000239 | Wyre Forest | 23.10 | 19.06 | 27.71 | 8.65 | 548 |
| Physical engagement | E06000014 | York | 42.57 | 38.18 | 47.07 | 8.89 | 803 |
| Digital engagement | E07000223 | Adur | 23.15 | 18.74 | 28.24 | 9.50 | 443 |
| Digital engagement | E07000032 | Amber Valley | 15.45 | 11.68 | 20.17 | 8.49 | 487 |
| Digital engagement | E07000224 | Arun | 17.31 | 13.72 | 21.61 | 7.89 | 512 |
| Digital engagement | E07000170 | Ashfield | 11.37 | 8.23 | 15.50 | 7.28 | 488 |
| Digital engagement | E07000105 | Ashford | 15.79 | 12.56 | 19.67 | 7.11 | 584 |
| Digital engagement | E07000200 | Babergh | 16.17 | 12.03 | 21.40 | 9.37 | 487 |
| Digital engagement | E09000002 | Barking and Dagenham | 19.62 | 15.63 | 24.33 | 8.70 | 765 |
| Digital engagement | E09000003 | Barnet | 23.74 | 20.42 | 27.41 | 6.99 | 938 |
| Digital engagement | E08000038 | Barnsley | 13.20 | 10.34 | 16.71 | 6.38 | 681 |
| Digital engagement | E07000066 | Basildon | 16.65 | 12.95 | 21.16 | 8.22 | 561 |
| Digital engagement | E07000084 | Basingstoke and Deane | 14.33 | 11.30 | 18.00 | 6.70 | 535 |
| Digital engagement | E07000171 | Bassetlaw | 11.76 | 8.98 | 15.25 | 6.27 | 475 |
| Digital engagement | E06000022 | Bath and North East Somerset | 16.81 | 13.45 | 20.82 | 7.37 | 559 |
| Digital engagement | E06000055 | Bedford | 17.25 | 13.57 | 21.67 | 8.09 | 601 |
| Digital engagement | E09000004 | Bexley | 19.53 | 15.38 | 24.47 | 9.09 | 717 |
| Digital engagement | E08000025 | Birmingham | 21.99 | 20.02 | 24.10 | 4.09 | 2,902 |
| Digital engagement | E07000129 | Blaby | 18.39 | 14.10 | 23.62 | 9.52 | 387 |
| Digital engagement | E06000008 | Blackburn with Darwen | 14.56 | 11.10 | 18.87 | 7.76 | 503 |
| Digital engagement | E06000009 | Blackpool | 14.15 | 10.46 | 18.87 | 8.41 | 502 |
| Digital engagement | E07000033 | Bolsover | 11.30 | 8.04 | 15.65 | 7.61 | 436 |
| Digital engagement | E08000001 | Bolton | 15.03 | 12.16 | 18.44 | 6.29 | 638 |
| Digital engagement | E07000136 | Boston | 11.48 | 8.59 | 15.18 | 6.59 | 457 |
| Digital engagement | E06000058 | Bournemouth, Christchurch and Poole | 14.23 | 11.99 | 16.81 | 4.82 | 1,030 |
| Digital engagement | E06000036 | Bracknell Forest | 12.08 | 9.19 | 15.73 | 6.53 | 458 |
| Digital engagement | E08000032 | Bradford | 14.69 | 12.45 | 17.25 | 4.80 | 1,346 |
| Digital engagement | E07000067 | Braintree | 14.94 | 11.90 | 18.58 | 6.67 | 550 |
| Digital engagement | E07000143 | Breckland | 19.21 | 15.08 | 24.15 | 9.07 | 470 |
| Digital engagement | E09000005 | Brent | 24.68 | 21.12 | 28.62 | 7.50 | 803 |
| Digital engagement | E07000068 | Brentwood | 18.00 | 14.12 | 22.66 | 8.54 | 493 |
| Digital engagement | E06000043 | Brighton and Hove | 21.04 | 17.80 | 24.69 | 6.89 | 674 |
| Digital engagement | E06000023 | Bristol, City of | 22.01 | 19.38 | 24.89 | 5.51 | 1,199 |
| Digital engagement | E07000144 | Broadland | 17.76 | 14.12 | 22.09 | 7.97 | 480 |
| Digital engagement | E09000006 | Bromley | 18.82 | 15.74 | 22.34 | 6.60 | 914 |
| Digital engagement | E07000234 | Bromsgrove | 14.22 | 11.31 | 17.73 | 6.42 | 554 |
| Digital engagement | E07000095 | Broxbourne | 18.43 | 14.33 | 23.38 | 9.05 | 506 |
| Digital engagement | E07000172 | Broxtowe | 21.40 | 16.57 | 27.18 | 10.62 | 461 |
| Digital engagement | E06000060 | Buckinghamshire | 18.40 | 16.03 | 21.02 | 4.99 | 1,340 |
| Digital engagement | E07000117 | Burnley | 13.56 | 10.25 | 17.74 | 7.50 | 506 |
| Digital engagement | E08000002 | Bury | 14.77 | 11.76 | 18.37 | 6.61 | 597 |
| Digital engagement | E08000033 | Calderdale | 13.14 | 10.03 | 17.04 | 7.01 | 520 |
| Digital engagement | E07000008 | Cambridge | 25.16 | 20.61 | 30.34 | 9.73 | 542 |
| Digital engagement | E09000007 | Camden | 24.30 | 20.53 | 28.51 | 7.98 | 702 |
| Digital engagement | E07000192 | Cannock Chase | 11.04 | 8.29 | 14.56 | 6.27 | 543 |
| Digital engagement | E07000106 | Canterbury | 19.74 | 15.56 | 24.73 | 9.17 | 471 |
| Digital engagement | E07000069 | Castle Point | 15.84 | 11.89 | 20.79 | 8.90 | 388 |
| Digital engagement | E06000056 | Central Bedfordshire | 14.40 | 11.74 | 17.53 | 5.79 | 737 |
| Digital engagement | E07000130 | Charnwood | 13.19 | 10.05 | 17.11 | 7.06 | 477 |
| Digital engagement | E07000070 | Chelmsford | 14.62 | 11.68 | 18.15 | 6.47 | 571 |
| Digital engagement | E07000078 | Cheltenham | 23.14 | 19.01 | 27.86 | 8.85 | 507 |
| Digital engagement | E07000177 | Cherwell | 15.83 | 12.42 | 19.96 | 7.54 | 535 |
| Digital engagement | E06000049 | Cheshire East | 17.34 | 15.10 | 19.83 | 4.73 | 1,360 |
| Digital engagement | E06000050 | Cheshire West and Chester | 17.43 | 14.90 | 20.29 | 5.40 | 1,115 |
| Digital engagement | E07000034 | Chesterfield | 13.74 | 10.65 | 17.55 | 6.90 | 467 |
| Digital engagement | E07000225 | Chichester | 19.07 | 14.80 | 24.22 | 9.42 | 463 |
| Digital engagement | E07000118 | Chorley | 15.96 | 12.38 | 20.34 | 7.96 | 494 |
| Digital engagement | E09000001 | City of London | 9.45 | 5.91 | 14.78 | 8.86 | 403 |
| Digital engagement | E07000071 | Colchester | 19.31 | 15.61 | 23.64 | 8.03 | 562 |
| Digital engagement | E06000052 | Cornwall | 16.03 | 14.66 | 17.50 | 2.84 | 3,343 |
| Digital engagement | E07000079 | Cotswold | 14.63 | 11.00 | 19.21 | 8.21 | 462 |
| Digital engagement | E06000047 | County Durham | 12.26 | 10.51 | 14.26 | 3.75 | 1,577 |
| Digital engagement | E08000026 | Coventry | 18.85 | 15.45 | 22.81 | 7.36 | 819 |
| Digital engagement | E07000226 | Crawley | 19.92 | 15.90 | 24.66 | 8.76 | 622 |
| Digital engagement | E09000008 | Croydon | 19.64 | 16.88 | 22.73 | 5.85 | 1,177 |
| Digital engagement | E06000063 | Cumberland | 14.86 | 12.68 | 17.34 | 4.66 | 1,514 |
| Digital engagement | E07000096 | Dacorum | 22.48 | 17.80 | 27.98 | 10.17 | 522 |
| Digital engagement | E06000005 | Darlington | 16.31 | 13.05 | 20.20 | 7.15 | 541 |
| Digital engagement | E07000107 | Dartford | 14.64 | 11.52 | 18.44 | 6.92 | 549 |
| Digital engagement | E06000015 | Derby | 16.17 | 12.94 | 20.03 | 7.09 | 753 |
| Digital engagement | E07000035 | Derbyshire Dales | 15.03 | 11.51 | 19.38 | 7.87 | 461 |
| Digital engagement | E08000017 | Doncaster | 11.81 | 9.25 | 14.96 | 5.70 | 818 |
| Digital engagement | E06000059 | Dorset | 14.37 | 12.04 | 17.07 | 5.03 | 1,051 |
| Digital engagement | E07000108 | Dover | 15.32 | 11.99 | 19.39 | 7.40 | 492 |
| Digital engagement | E08000027 | Dudley | 15.06 | 12.39 | 18.19 | 5.80 | 823 |
| Digital engagement | E09000009 | Ealing | 18.20 | 14.99 | 21.93 | 6.95 | 893 |
| Digital engagement | E07000009 | East Cambridgeshire | 19.39 | 14.82 | 24.95 | 10.13 | 427 |
| Digital engagement | E07000040 | East Devon | 15.70 | 11.97 | 20.34 | 8.37 | 513 |
| Digital engagement | E07000085 | East Hampshire | 15.57 | 11.99 | 19.98 | 7.99 | 453 |
| Digital engagement | E07000242 | East Hertfordshire | 24.54 | 20.36 | 29.27 | 8.91 | 519 |
| Digital engagement | E07000137 | East Lindsey | 12.78 | 9.74 | 16.61 | 6.88 | 567 |
| Digital engagement | E06000011 | East Riding of Yorkshire | 16.97 | 14.70 | 19.51 | 4.81 | 1,233 |
| Digital engagement | E07000193 | East Staffordshire | 17.20 | 13.46 | 21.70 | 8.24 | 507 |
| Digital engagement | E07000244 | East Suffolk | 18.64 | 15.60 | 22.12 | 6.53 | 664 |
| Digital engagement | E07000061 | Eastbourne | 21.01 | 16.60 | 26.23 | 9.63 | 485 |
| Digital engagement | E07000086 | Eastleigh | 18.30 | 14.70 | 22.55 | 7.85 | 521 |
| Digital engagement | E07000207 | Elmbridge | 20.68 | 16.83 | 25.15 | 8.32 | 510 |
| Digital engagement | E09000010 | Enfield | 22.64 | 19.11 | 26.60 | 7.48 | 805 |
| Digital engagement | E07000072 | Epping Forest | 13.57 | 10.47 | 17.41 | 6.94 | 560 |
| Digital engagement | E07000208 | Epsom and Ewell | 24.85 | 20.18 | 30.19 | 10.01 | 501 |
| Digital engagement | E07000036 | Erewash | 11.52 | 8.80 | 14.95 | 6.15 | 497 |
| Digital engagement | E07000041 | Exeter | 23.30 | 18.96 | 28.29 | 9.33 | 532 |
| Digital engagement | E07000087 | Fareham | 16.45 | 12.95 | 20.67 | 7.72 | 482 |
| Digital engagement | E07000010 | Fenland | 10.53 | 8.01 | 13.73 | 5.73 | 485 |
| Digital engagement | E07000112 | Folkestone and Hythe | 17.38 | 13.52 | 22.06 | 8.54 | 483 |
| Digital engagement | E07000080 | Forest of Dean | 16.50 | 13.01 | 20.69 | 7.68 | 502 |
| Digital engagement | E07000119 | Fylde | 17.52 | 13.65 | 22.20 | 8.55 | 451 |
| Digital engagement | E08000037 | Gateshead | 12.51 | 9.50 | 16.30 | 6.80 | 589 |
| Digital engagement | E07000173 | Gedling | 14.99 | 11.66 | 19.06 | 7.40 | 558 |
| Digital engagement | E07000081 | Gloucester | 15.21 | 12.05 | 19.00 | 6.95 | 499 |
| Digital engagement | E07000088 | Gosport | 13.98 | 10.67 | 18.10 | 7.43 | 486 |
| Digital engagement | E07000109 | Gravesham | 20.12 | 16.07 | 24.89 | 8.82 | 569 |
| Digital engagement | E07000145 | Great Yarmouth | 14.61 | 11.25 | 18.75 | 7.49 | 446 |
| Digital engagement | E09000011 | Greenwich | 22.20 | 18.76 | 26.07 | 7.31 | 869 |
| Digital engagement | E07000209 | Guildford | 22.49 | 18.12 | 27.55 | 9.43 | 483 |
| Digital engagement | E09000012 | Hackney | 20.76 | 17.33 | 24.68 | 7.35 | 742 |
| Digital engagement | E06000006 | Halton | 15.57 | 12.15 | 19.73 | 7.58 | 532 |
| Digital engagement | E09000013 | Hammersmith and Fulham | 18.34 | 14.80 | 22.51 | 7.71 | 640 |
| Digital engagement | E07000131 | Harborough | 12.82 | 9.73 | 16.69 | 6.96 | 470 |
| Digital engagement | E09000014 | Haringey | 21.07 | 17.60 | 25.01 | 7.41 | 658 |
| Digital engagement | E07000073 | Harlow | 15.65 | 12.34 | 19.64 | 7.30 | 525 |
| Digital engagement | E09000015 | Harrow | 23.60 | 19.58 | 28.16 | 8.58 | 623 |
| Digital engagement | E07000089 | Hart | 15.81 | 12.48 | 19.84 | 7.36 | 548 |
| Digital engagement | E06000001 | Hartlepool | 10.56 | 8.14 | 13.59 | 5.45 | 570 |
| Digital engagement | E07000062 | Hastings | 20.93 | 17.00 | 25.49 | 8.49 | 529 |
| Digital engagement | E07000090 | Havant | 18.09 | 13.88 | 23.23 | 9.35 | 443 |
| Digital engagement | E09000016 | Havering | 16.17 | 13.04 | 19.89 | 6.85 | 611 |
| Digital engagement | E06000019 | Herefordshire, County of | 21.31 | 17.52 | 25.68 | 8.16 | 503 |
| Digital engagement | E07000098 | Hertsmere | 20.83 | 16.78 | 25.56 | 8.78 | 575 |
| Digital engagement | E07000037 | High Peak | 15.71 | 12.41 | 19.70 | 7.30 | 496 |
| Digital engagement | E09000017 | Hillingdon | 20.27 | 17.17 | 23.77 | 6.60 | 837 |
| Digital engagement | E07000132 | Hinckley and Bosworth | 14.29 | 11.22 | 18.04 | 6.83 | 503 |
| Digital engagement | E07000227 | Horsham | 21.58 | 17.76 | 25.96 | 8.20 | 536 |
| Digital engagement | E09000018 | Hounslow | 20.18 | 16.87 | 23.96 | 7.09 | 815 |
| Digital engagement | E07000011 | Huntingdonshire | 17.65 | 14.24 | 21.68 | 7.44 | 594 |
| Digital engagement | E07000120 | Hyndburn | 12.80 | 9.46 | 17.08 | 7.62 | 465 |
| Digital engagement | E07000202 | Ipswich | 20.25 | 15.97 | 25.32 | 9.35 | 499 |
| Digital engagement | E06000046 | Isle of Wight | 13.18 | 9.95 | 17.25 | 7.30 | 489 |
| Digital engagement | E09000019 | Islington | 23.78 | 19.56 | 28.57 | 9.01 | 560 |
| Digital engagement | E09000020 | Kensington and Chelsea | 25.27 | 20.65 | 30.52 | 9.87 | 553 |
| Digital engagement | E07000146 | King's Lynn and West Norfolk | 15.59 | 12.20 | 19.71 | 7.51 | 497 |
| Digital engagement | E06000010 | Kingston upon Hull, City of | 12.64 | 10.43 | 15.24 | 4.81 | 987 |
| Digital engagement | E09000021 | Kingston upon Thames | 21.23 | 17.61 | 25.37 | 7.77 | 636 |
| Digital engagement | E08000034 | Kirklees | 16.18 | 13.73 | 18.97 | 5.25 | 1,191 |
| Digital engagement | E08000011 | Knowsley | 12.26 | 9.32 | 15.98 | 6.66 | 559 |
| Digital engagement | E09000022 | Lambeth | 22.21 | 19.15 | 25.60 | 6.45 | 870 |
| Digital engagement | E07000121 | Lancaster | 20.39 | 16.67 | 24.71 | 8.04 | 517 |
| Digital engagement | E08000035 | Leeds | 19.66 | 17.62 | 21.88 | 4.26 | 2,111 |
| Digital engagement | E06000016 | Leicester | 22.81 | 18.86 | 27.31 | 8.45 | 860 |
| Digital engagement | E07000063 | Lewes | 19.47 | 15.62 | 24.00 | 8.38 | 483 |
| Digital engagement | E09000023 | Lewisham | 20.77 | 17.77 | 24.13 | 6.36 | 874 |
| Digital engagement | E07000194 | Lichfield | 14.08 | 11.12 | 17.67 | 6.55 | 581 |
| Digital engagement | E07000138 | Lincoln | 20.95 | 16.97 | 25.57 | 8.60 | 610 |
| Digital engagement | E08000012 | Liverpool | 18.18 | 15.62 | 21.05 | 5.43 | 1,327 |
| Digital engagement | E06000032 | Luton | 23.32 | 19.41 | 27.74 | 8.32 | 731 |
| Digital engagement | E07000110 | Maidstone | 15.54 | 12.19 | 19.59 | 7.40 | 502 |
| Digital engagement | E07000074 | Maldon | 14.82 | 11.15 | 19.43 | 8.28 | 403 |
| Digital engagement | E07000235 | Malvern Hills | 20.65 | 16.88 | 25.00 | 8.11 | 476 |
| Digital engagement | E08000003 | Manchester | 25.86 | 23.22 | 28.68 | 5.47 | 1,635 |
| Digital engagement | E07000174 | Mansfield | 12.93 | 9.76 | 16.94 | 7.19 | 514 |
| Digital engagement | E06000035 | Medway | 13.74 | 11.11 | 16.86 | 5.74 | 847 |
| Digital engagement | E07000133 | Melton | 14.22 | 10.66 | 18.72 | 8.06 | 465 |
| Digital engagement | E09000024 | Merton | 26.30 | 22.03 | 31.06 | 9.03 | 650 |
| Digital engagement | E07000042 | Mid Devon | 14.48 | 11.00 | 18.82 | 7.81 | 461 |
| Digital engagement | E07000203 | Mid Suffolk | 16.28 | 12.84 | 20.42 | 7.58 | 502 |
| Digital engagement | E07000228 | Mid Sussex | 18.88 | 15.21 | 23.18 | 7.97 | 493 |
| Digital engagement | E06000002 | Middlesbrough | 17.68 | 13.95 | 22.14 | 8.18 | 618 |
| Digital engagement | E06000042 | Milton Keynes | 21.13 | 17.91 | 24.75 | 6.83 | 856 |
| Digital engagement | E07000210 | Mole Valley | 20.46 | 16.36 | 25.28 | 8.93 | 485 |
| Digital engagement | E07000091 | New Forest | 14.83 | 11.12 | 19.51 | 8.39 | 480 |
| Digital engagement | E07000175 | Newark and Sherwood | 12.28 | 9.42 | 15.85 | 6.42 | 586 |
| Digital engagement | E07000195 | Newcastle-under-Lyme | 12.08 | 8.89 | 16.22 | 7.34 | 548 |
| Digital engagement | E08000021 | Newcastle upon Tyne | 15.59 | 12.71 | 18.98 | 6.28 | 954 |
| Digital engagement | E09000025 | Newham | 22.32 | 18.80 | 26.28 | 7.48 | 884 |
| Digital engagement | E07000043 | North Devon | 13.95 | 10.90 | 17.70 | 6.80 | 532 |
| Digital engagement | E07000038 | North East Derbyshire | 12.70 | 9.03 | 17.59 | 8.56 | 471 |
| Digital engagement | E06000012 | North East Lincolnshire | 9.57 | 6.81 | 13.27 | 6.46 | 580 |
| Digital engagement | E07000099 | North Hertfordshire | 22.56 | 18.55 | 27.15 | 8.60 | 514 |
| Digital engagement | E07000139 | North Kesteven | 12.29 | 9.20 | 16.23 | 7.02 | 536 |
| Digital engagement | E06000013 | North Lincolnshire | 10.67 | 8.05 | 14.02 | 5.98 | 570 |
| Digital engagement | E07000147 | North Norfolk | 18.24 | 14.51 | 22.67 | 8.15 | 467 |
| Digital engagement | E06000061 | North Northamptonshire | 13.47 | 10.81 | 16.67 | 5.86 | 799 |
| Digital engagement | E06000024 | North Somerset | 15.36 | 12.37 | 18.91 | 6.55 | 569 |
| Digital engagement | E08000022 | North Tyneside | 10.01 | 7.57 | 13.13 | 5.56 | 601 |
| Digital engagement | E07000218 | North Warwickshire | 11.17 | 8.38 | 14.74 | 6.37 | 466 |
| Digital engagement | E07000134 | North West Leicestershire | 14.56 | 11.13 | 18.82 | 7.70 | 454 |
| Digital engagement | E06000065 | North Yorkshire | 14.08 | 12.51 | 15.81 | 3.29 | 2,450 |
| Digital engagement | E06000057 | Northumberland | 12.25 | 9.96 | 14.98 | 5.02 | 1,012 |
| Digital engagement | E07000148 | Norwich | 28.28 | 24.00 | 33.00 | 9.00 | 558 |
| Digital engagement | E06000018 | Nottingham | 19.90 | 16.95 | 23.23 | 6.28 | 975 |
| Digital engagement | E07000219 | Nuneaton and Bedworth | 9.47 | 7.17 | 12.39 | 5.21 | 562 |
| Digital engagement | E07000135 | Oadby and Wigston | 18.12 | 13.99 | 23.14 | 9.14 | 403 |
| Digital engagement | E08000004 | Oldham | 14.94 | 11.43 | 19.30 | 7.87 | 515 |
| Digital engagement | E07000178 | Oxford | 32.90 | 28.18 | 37.99 | 9.81 | 596 |
| Digital engagement | E07000122 | Pendle | 20.88 | 16.85 | 25.57 | 8.72 | 519 |
| Digital engagement | E06000031 | Peterborough | 18.25 | 14.70 | 22.44 | 7.74 | 638 |
| Digital engagement | E06000026 | Plymouth | 16.02 | 13.05 | 19.51 | 6.46 | 690 |
| Digital engagement | E06000044 | Portsmouth | 18.93 | 15.15 | 23.41 | 8.26 | 511 |
| Digital engagement | E07000123 | Preston | 19.80 | 16.30 | 23.84 | 7.54 | 595 |
| Digital engagement | E06000038 | Reading | 21.26 | 17.73 | 25.28 | 7.55 | 635 |
| Digital engagement | E09000026 | Redbridge | 22.07 | 18.37 | 26.26 | 7.89 | 733 |
| Digital engagement | E06000003 | Redcar and Cleveland | 9.54 | 7.30 | 12.37 | 5.08 | 577 |
| Digital engagement | E07000236 | Redditch | 14.46 | 11.55 | 17.94 | 6.39 | 599 |
| Digital engagement | E07000211 | Reigate and Banstead | 21.56 | 17.68 | 26.03 | 8.35 | 513 |
| Digital engagement | E07000124 | Ribble Valley | 19.82 | 15.78 | 24.60 | 8.82 | 447 |
| Digital engagement | E09000027 | Richmond upon Thames | 25.99 | 22.19 | 30.18 | 7.99 | 614 |
| Digital engagement | E08000005 | Rochdale | 11.60 | 8.88 | 15.02 | 6.15 | 578 |
| Digital engagement | E07000075 | Rochford | 14.63 | 11.17 | 18.95 | 7.78 | 433 |
| Digital engagement | E07000125 | Rossendale | 18.66 | 14.38 | 23.87 | 9.49 | 413 |
| Digital engagement | E07000064 | Rother | 18.33 | 14.15 | 23.39 | 9.23 | 424 |
| Digital engagement | E08000018 | Rotherham | 11.12 | 8.61 | 14.26 | 5.65 | 708 |
| Digital engagement | E07000220 | Rugby | 21.24 | 16.97 | 26.25 | 9.29 | 502 |
| Digital engagement | E07000212 | Runnymede | 23.78 | 19.43 | 28.75 | 9.32 | 488 |
| Digital engagement | E07000176 | Rushcliffe | 21.23 | 17.34 | 25.73 | 8.39 | 553 |
| Digital engagement | E07000092 | Rushmoor | 18.93 | 14.88 | 23.79 | 8.91 | 503 |
| Digital engagement | E06000017 | Rutland | 22.15 | 17.32 | 27.87 | 10.55 | 457 |
| Digital engagement | E08000006 | Salford | 16.48 | 13.46 | 20.01 | 6.55 | 747 |
| Digital engagement | E08000028 | Sandwell | 15.91 | 13.08 | 19.22 | 6.14 | 877 |
| Digital engagement | E08000014 | Sefton | 16.96 | 14.05 | 20.33 | 6.28 | 812 |
| Digital engagement | E07000111 | Sevenoaks | 19.18 | 15.57 | 23.39 | 7.82 | 533 |
| Digital engagement | E08000039 | Sheffield | 17.04 | 14.82 | 19.52 | 4.70 | 1,556 |
| Digital engagement | E06000051 | Shropshire | 11.80 | 9.71 | 14.28 | 4.57 | 875 |
| Digital engagement | E06000039 | Slough | 23.17 | 18.94 | 28.02 | 9.08 | 604 |
| Digital engagement | E08000029 | Solihull | 17.55 | 14.28 | 21.39 | 7.11 | 584 |
| Digital engagement | E06000066 | Somerset | 15.02 | 13.10 | 17.16 | 4.06 | 1,512 |
| Digital engagement | E07000012 | South Cambridgeshire | 23.45 | 19.35 | 28.11 | 8.76 | 499 |
| Digital engagement | E07000039 | South Derbyshire | 12.29 | 9.34 | 16.02 | 6.68 | 508 |
| Digital engagement | E06000025 | South Gloucestershire | 15.24 | 12.31 | 18.72 | 6.41 | 687 |
| Digital engagement | E07000044 | South Hams | 15.99 | 12.30 | 20.52 | 8.22 | 474 |
| Digital engagement | E07000140 | South Holland | 12.08 | 9.00 | 16.03 | 7.03 | 499 |
| Digital engagement | E07000141 | South Kesteven | 15.22 | 12.26 | 18.74 | 6.49 | 586 |
| Digital engagement | E07000149 | South Norfolk | 20.59 | 16.59 | 25.26 | 8.66 | 485 |
| Digital engagement | E07000179 | South Oxfordshire | 20.69 | 16.87 | 25.12 | 8.25 | 547 |
| Digital engagement | E07000126 | South Ribble | 16.82 | 13.40 | 20.89 | 7.50 | 499 |
| Digital engagement | E07000196 | South Staffordshire | 9.38 | 6.80 | 12.79 | 5.99 | 515 |
| Digital engagement | E08000023 | South Tyneside | 13.34 | 10.38 | 16.99 | 6.61 | 561 |
| Digital engagement | E06000045 | Southampton | 22.18 | 18.29 | 26.63 | 8.34 | 621 |
| Digital engagement | E06000033 | Southend-on-Sea | 18.67 | 15.09 | 22.88 | 7.80 | 517 |
| Digital engagement | E09000028 | Southwark | 27.12 | 23.41 | 31.19 | 7.78 | 890 |
| Digital engagement | E07000213 | Spelthorne | 15.40 | 12.31 | 19.10 | 6.79 | 567 |
| Digital engagement | E07000240 | St Albans | 24.42 | 20.46 | 28.87 | 8.40 | 528 |
| Digital engagement | E08000013 | St. Helens | 13.50 | 10.08 | 17.86 | 7.78 | 549 |
| Digital engagement | E07000197 | Stafford | 10.41 | 7.76 | 13.83 | 6.07 | 496 |
| Digital engagement | E07000198 | Staffordshire Moorlands | 12.94 | 9.95 | 16.68 | 6.73 | 480 |
| Digital engagement | E07000243 | Stevenage | 15.47 | 12.29 | 19.29 | 7.00 | 527 |
| Digital engagement | E08000007 | Stockport | 16.56 | 13.67 | 19.93 | 6.26 | 716 |
| Digital engagement | E06000004 | Stockton-on-Tees | 12.71 | 9.83 | 16.29 | 6.47 | 612 |
| Digital engagement | E06000021 | Stoke-on-Trent | 11.37 | 8.84 | 14.52 | 5.69 | 684 |
| Digital engagement | E07000221 | Stratford-on-Avon | 15.39 | 12.09 | 19.39 | 7.30 | 532 |
| Digital engagement | E07000082 | Stroud | 18.79 | 14.95 | 23.35 | 8.40 | 460 |
| Digital engagement | E08000024 | Sunderland | 8.63 | 6.72 | 11.00 | 4.27 | 809 |
| Digital engagement | E07000214 | Surrey Heath | 16.19 | 12.44 | 20.81 | 8.37 | 465 |
| Digital engagement | E09000029 | Sutton | 18.29 | 14.65 | 22.60 | 7.95 | 593 |
| Digital engagement | E07000113 | Swale | 14.19 | 11.09 | 18.00 | 6.91 | 551 |
| Digital engagement | E06000030 | Swindon | 13.13 | 10.01 | 17.04 | 7.03 | 516 |
| Digital engagement | E08000008 | Tameside | 17.74 | 14.46 | 21.59 | 7.13 | 644 |
| Digital engagement | E07000199 | Tamworth | 13.74 | 10.49 | 17.80 | 7.31 | 544 |
| Digital engagement | E07000215 | Tandridge | 18.39 | 14.53 | 22.99 | 8.46 | 468 |
| Digital engagement | E07000045 | Teignbridge | 20.16 | 16.41 | 24.51 | 8.10 | 532 |
| Digital engagement | E06000020 | Telford and Wrekin | 13.71 | 10.97 | 17.01 | 6.04 | 702 |
| Digital engagement | E07000076 | Tendring | 10.60 | 7.73 | 14.36 | 6.63 | 444 |
| Digital engagement | E07000093 | Test Valley | 19.44 | 15.56 | 24.00 | 8.44 | 475 |
| Digital engagement | E07000083 | Tewkesbury | 14.64 | 11.45 | 18.53 | 7.07 | 484 |
| Digital engagement | E07000114 | Thanet | 15.09 | 11.86 | 19.00 | 7.14 | 562 |
| Digital engagement | E07000102 | Three Rivers | 19.68 | 15.87 | 24.14 | 8.27 | 517 |
| Digital engagement | E06000034 | Thurrock | 17.93 | 14.28 | 22.26 | 7.98 | 626 |
| Digital engagement | E07000115 | Tonbridge and Malling | 16.75 | 13.31 | 20.85 | 7.54 | 539 |
| Digital engagement | E06000027 | Torbay | 16.04 | 12.56 | 20.26 | 7.69 | 504 |
| Digital engagement | E07000046 | Torridge | 16.66 | 12.94 | 21.19 | 8.25 | 450 |
| Digital engagement | E09000030 | Tower Hamlets | 25.73 | 22.28 | 29.50 | 7.22 | 961 |
| Digital engagement | E08000009 | Trafford | 21.33 | 17.55 | 25.67 | 8.12 | 554 |
| Digital engagement | E07000116 | Tunbridge Wells | 16.79 | 13.28 | 21.01 | 7.74 | 459 |
| Digital engagement | E07000077 | Uttlesford | 13.29 | 10.04 | 17.40 | 7.36 | 420 |
| Digital engagement | E07000180 | Vale of White Horse | 22.64 | 18.60 | 27.26 | 8.66 | 522 |
| Digital engagement | E08000036 | Wakefield | 12.61 | 10.16 | 15.53 | 5.37 | 886 |
| Digital engagement | E08000030 | Walsall | 12.89 | 10.08 | 16.33 | 6.24 | 690 |
| Digital engagement | E09000031 | Waltham Forest | 22.68 | 18.74 | 27.16 | 8.42 | 664 |
| Digital engagement | E09000032 | Wandsworth | 20.01 | 17.28 | 23.05 | 5.76 | 1,078 |
| Digital engagement | E06000007 | Warrington | 15.09 | 11.78 | 19.14 | 7.36 | 643 |
| Digital engagement | E07000222 | Warwick | 20.85 | 16.94 | 25.40 | 8.46 | 551 |
| Digital engagement | E07000103 | Watford | 22.34 | 17.78 | 27.67 | 9.89 | 548 |
| Digital engagement | E07000216 | Waverley | 17.43 | 14.16 | 21.26 | 7.10 | 511 |
| Digital engagement | E07000065 | Wealden | 16.36 | 12.85 | 20.60 | 7.75 | 511 |
| Digital engagement | E07000241 | Welwyn Hatfield | 28.84 | 23.79 | 34.48 | 10.68 | 481 |
| Digital engagement | E06000037 | West Berkshire | 17.33 | 13.98 | 21.29 | 7.31 | 539 |
| Digital engagement | E07000047 | West Devon | 14.99 | 11.46 | 19.36 | 7.89 | 428 |
| Digital engagement | E07000127 | West Lancashire | 16.20 | 12.66 | 20.49 | 7.83 | 506 |
| Digital engagement | E07000142 | West Lindsey | 12.06 | 9.11 | 15.78 | 6.67 | 535 |
| Digital engagement | E06000062 | West Northamptonshire | 15.58 | 13.14 | 18.39 | 5.25 | 1,067 |
| Digital engagement | E07000181 | West Oxfordshire | 15.47 | 11.99 | 19.73 | 7.74 | 469 |
| Digital engagement | E07000245 | West Suffolk | 15.75 | 12.45 | 19.73 | 7.27 | 500 |
| Digital engagement | E09000033 | Westminster | 20.44 | 16.93 | 24.48 | 7.55 | 730 |
| Digital engagement | E06000064 | Westmorland and Furness | 18.21 | 15.61 | 21.14 | 5.53 | 1,356 |
| Digital engagement | E08000010 | Wigan | 13.38 | 10.48 | 16.94 | 6.46 | 750 |
| Digital engagement | E06000054 | Wiltshire | 15.35 | 13.04 | 17.97 | 4.93 | 1,094 |
| Digital engagement | E07000094 | Winchester | 21.52 | 17.42 | 26.28 | 8.87 | 464 |
| Digital engagement | E06000040 | Windsor and Maidenhead | 24.24 | 19.98 | 29.08 | 9.09 | 551 |
| Digital engagement | E08000015 | Wirral | 12.65 | 10.39 | 15.33 | 4.95 | 925 |
| Digital engagement | E07000217 | Woking | 19.27 | 15.70 | 23.44 | 7.74 | 512 |
| Digital engagement | E06000041 | Wokingham | 18.19 | 14.75 | 22.22 | 7.47 | 543 |
| Digital engagement | E08000031 | Wolverhampton | 16.51 | 12.91 | 20.88 | 7.98 | 681 |
| Digital engagement | E07000237 | Worcester | 19.36 | 15.64 | 23.72 | 8.08 | 538 |
| Digital engagement | E07000229 | Worthing | 19.98 | 16.15 | 24.44 | 8.29 | 477 |
| Digital engagement | E07000238 | Wychavon | 14.25 | 11.35 | 17.74 | 6.38 | 557 |
| Digital engagement | E07000128 | Wyre | 15.16 | 11.70 | 19.43 | 7.74 | 457 |
| Digital engagement | E07000239 | Wyre Forest | 14.33 | 10.80 | 18.77 | 7.97 | 547 |
| Digital engagement | E06000014 | York | 25.06 | 21.57 | 28.91 | 7.34 | 804 |
England, ages 16+, 2025/26. LAD25 identifies respondent residence, not library performance. Rates and 95% limits shown to two decimals; downloadable CSV preserves full source precision/cell references. Scilly suppressed c rows are excluded, not zero.
Evidence & method
How we calculated it
- The audit follows a plan declared before the calculations. It reads the official 2025/26 ODS workbook, using physical-engagement sheet K3 and digital-engagement sheet K6. Columns D, E and F supply the weighted estimate and published lower and upper 95% limits; G and H supply the unweighted count and question base. Prior-year columns I:M do not enter the analysis. National values come from the corresponding total row.
- District rows are identified through valid LAD25 codes in column N, preserving the names and geographical labels on the same source rows. The two worksheets contain matching sets of 296 distinct codes without duplicates or unmatched codes. Estimates with source flags remain flagged rather than converted to numbers. Both Isles of Scilly rows are suppressed with c and base 21, leaving 295 paired usable districts and 590 mode-specific rows.
- Each interval width is the published upper limit minus the published lower limit, in percentage points. Source values are already percentages and are not multiplied by 100. The median and display-bin summaries weight each usable district equally. Width ratios divide the median district width by the corresponding national width; they are not ratios of accuracy or bias. The median question base is 547 in each mode.
- The original weighted estimates and published confidence limits are retained. The technical report describes a survey-weighted logit interval method. The audit does not substitute simple binomial intervals, reconstruct weighted percentages from unweighted counts, pool local estimates into a new national rate or calculate intervals around the median width. Display rounding is applied only after calculations using the underlying values.
- The five width bands and the example-selection rule were specified in advance. Example districts use minimum, median and maximum mode-specific unweighted bases, with district-code tie-breaking. The containment measure counts cases where a district lower limit is at or below the national point and its upper limit is at or above it. This is descriptive geometry, not a significance, equivalence or difference test.
- Independent recomputation parsed the original ODS values separately, checked source rows and compared the derived tables and chart payloads. The arithmetic checks passed, including numerical scale, confidence bounds, district joins and suppressed rows. This verifies the transformations against the published workbook; it does not independently validate survey responses or remove the source’s collection and questionnaire limitations.
- The release combines April–September 2025 Participation responses with the much larger October 2025–March 2026 Community and Engagement collection. Workbook Note 11 states that library questions were omitted from the Community paper questionnaire in error, lowering the library question bases. Potential mode and nonresponse bias remain; the published sampling intervals do not quantify every consequence of that omission.
What the data cannot tell us
- The estimates cover England residents aged 16+ in the survey frame, not the United Kingdom as a whole. District geography identifies where respondents live, not the exclusive catchment of a library authority. Engagement estimates cannot be turned into institutional performance rankings, current access measures or administrative visit totals.
- The preceding-twelve-month recall period differs from a fixed-year transaction count. Physical and digital engagement overlap and have broad official definitions, including home/outreach for physical engagement and telephone support within digital services. No ebook-only rate or combined engagement percentage is inferred here.
- Confidence-interval width describes published sampling precision, not all error. The erroneous omission of library questions from the Community paper questionnaire, collection imbalance, possible mode effects, measurement error and nonresponse bias remain material. A narrow interval does not prove an unbiased or fully accurate estimate.
- The medians weight districts equally, regardless of population. The median base is respondents asked, not affirmative users. Width ratios are not relative-accuracy scores. The intervals containing the national point are counted descriptively and do not establish significance, equivalence or the absence of differences.
- The two Isles of Scilly estimates are suppressed rather than zero. No value is imputed for them. The analysis preserves the workbook’s estimates and limits, and it does not recalculate rates from unweighted counts or perform new national estimation.
- This is a within-year secondary audit of published cells. It supplies no cross-year trend, pairwise district test, physical-versus-digital difference test or causal explanation. The dates of release, added reports and narrative correction do not create additional survey observations.
Original sources
- Official annual libraries release and original ODS
Official 2025/26 England libraries release and workbook. Initial release 31 July 2026; detailed reports added 14 August. This audit uses K3/K6 columns D:H for 2025/26 and excludes prior-year columns.
Accessed October 28, 2026
- Corrected libraries narrative and definitions
Official definitions and corrected narrative. The 22 October 2026 commentary correction did not change the data tables. Physical and digital engagement extend beyond building visits and ebook borrowing.
Accessed October 28, 2026
- Technical report
Official survey design, weighting and published logit confidence-interval method. The combined 2025/26 collections and potential mode/nonresponse bias remain relevant to interpretation.
Accessed October 28, 2026
- Interpretation guidance
Official statistical interpretation guidance. This audit’s descriptive count of intervals containing the national point is not the publisher’s significance classification.
Accessed October 28, 2026
- Online questionnaire
Official questionnaire context. Workbook Note 11 records that library questions were omitted from the Community paper questionnaire in error; online wording does not remove that limitation.
Accessed October 28, 2026
- Open Government Licence v3.0
Open Government Licence v3.0 attribution for selected Crown/government information. Third-party rights and logos are excluded, and no endorsement is implied.
Accessed October 28, 2026
- Official libraries 2025/26 ODS workbook
Frozen official workbook, SHA-256 98298225d25ff0ac08c6c5f5e4f1bbbab5ed4b459dab55094de9fb04c8ccc33e. All 590 usable district-mode rows and the two suppressed rows were checked against original cells.
Accessed October 28, 2026
Cite & reuse this study
Alisson Bento. England’s library-use estimates: why local confidence intervals matter. Secondary audit of DCMS Community and Engagement Survey 2025/26 published tables, England residents aged 16+, reviewed 28 October 2026. https://alissonbento.com/research/england-library-survey-precision/ https://alissonbento.com/research/england-library-survey-precision/
Contains public sector information licensed under the Open Government Licence v3.0. Source: DCMS Community and Engagement Survey 2025/26; Crown copyright. Original calculations, explanation, charts and reproduction code: Alisson Bento. Reuse with source and author attribution, a link to this study, the survey year and an indication of changes. Preserve the engagement definitions, units, suppression flags and questionnaire-omission limitation. Government endorsement is not implied. Third-party Acorn material, logos and the complete source workbook are not included in these public derivatives.
Corrections or editorial questions