Four measures that should never be interchanged
A library statistic becomes easier to interpret when its unit travels with the number. In these tables, the census counts administrative units, the response count records returned questionnaires, the registration field records registered-user entries or recognised eligibility, and the visits field records events. Each answers a different question. Treating them all as counts of libraries or readers would create a misleading account even if every printed number were copied correctly.
The principal observation is Aragón in 2024, with provincial detail for Huesca, Teruel and Zaragoza. A Spain-total row is retained because the official source supplies it. This is a secondary analysis of those identified tables, not a new census or a complete study of every Spanish autonomous community. Its purpose is to make the denominators, source units and consistency checks usable for readers who encounter the figures in a report, chart or news story.
The practical lesson starts with the two largest headline quantities. The table’s 396.8 thousand registrations cannot be relabelled as 396.8 thousand distinct active readers. The 4,336.6 thousand visits cannot be relabelled as the same number of unique visitors. Putting the quantities side by side is useful; substituting one for the other changes what is being measured.
An administrative unit may cover more than one service point
The distinction between an administrative unit and a physical location is supported by the opened official 2024 library questionnaire linked in the sources. Its instructions state that administrative units complete the questionnaire and aggregate their dependent service points. The reporting unit can therefore encompass activity associated with more than one location. A count of returned questionnaires is not automatically a count of doors, branches or places a visitor can enter.
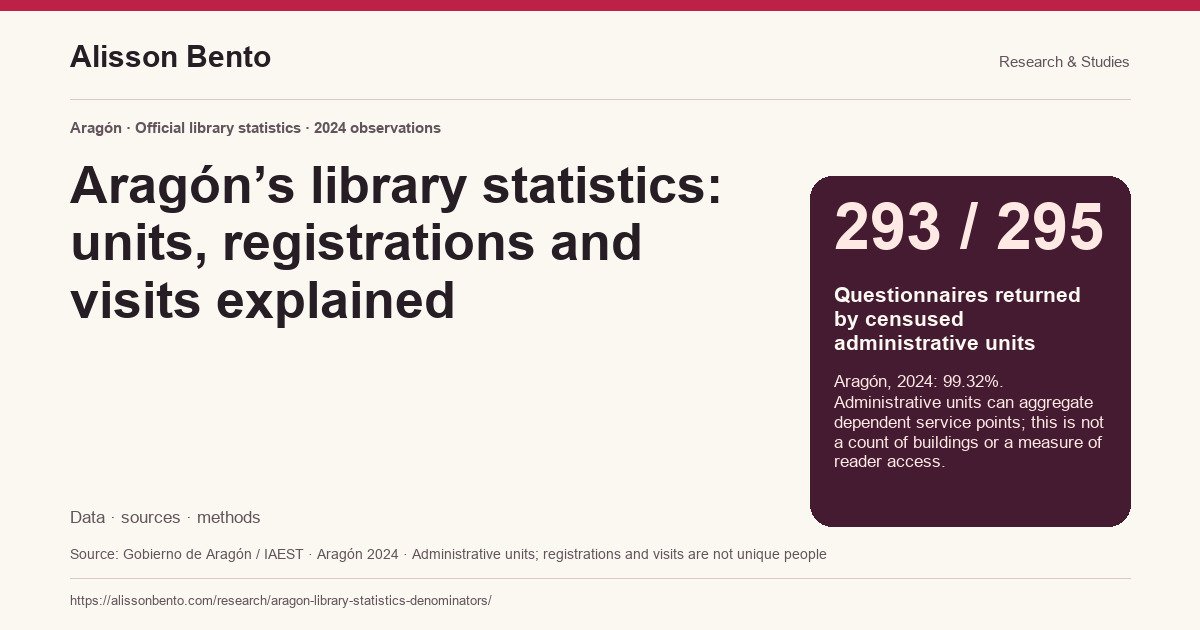
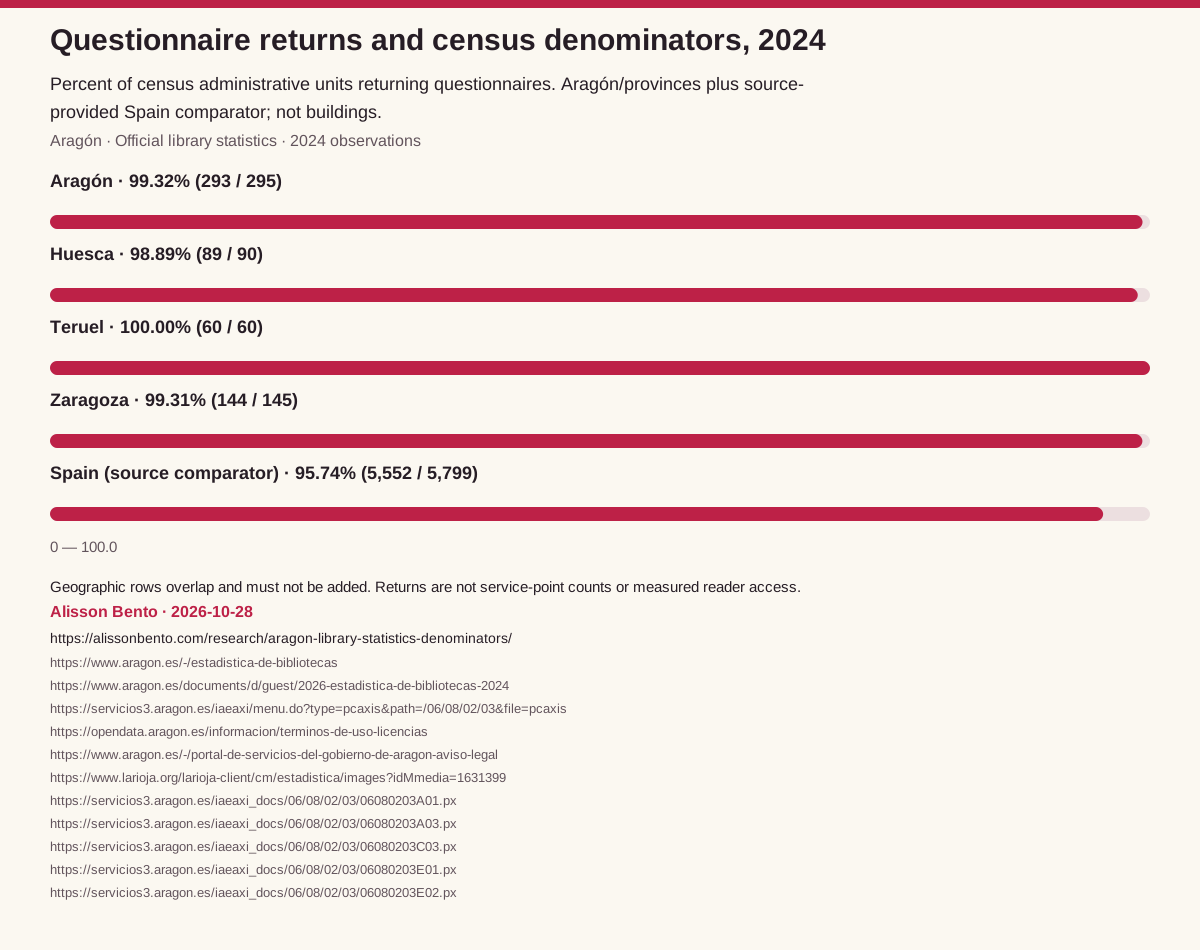
For Aragón, the source records 295 units in the census and 293 returns. Dividing returns by census units gives 99.32%. The provincial pairs are 89 out of 90 in Huesca, 60 out of 60 in Teruel, and 144 out of 145 in Zaragoza. Their return shares are 98.89%, 100.00% and 99.31% respectively. These percentages describe questionnaire coverage within the recorded administrative-unit population.
High return coverage is valuable context for reading the tables, but it does not establish complete answers to every question or universal service availability. A returned questionnaire can contain unanswered items. An administrative unit can cover several dependent service points. And the statistical observation year differs from the date on which someone may wish to visit a library. Those distinctions limit what can be concluded from the return rate alone.
Registrations and recognised eligibility are not a headcount of readers
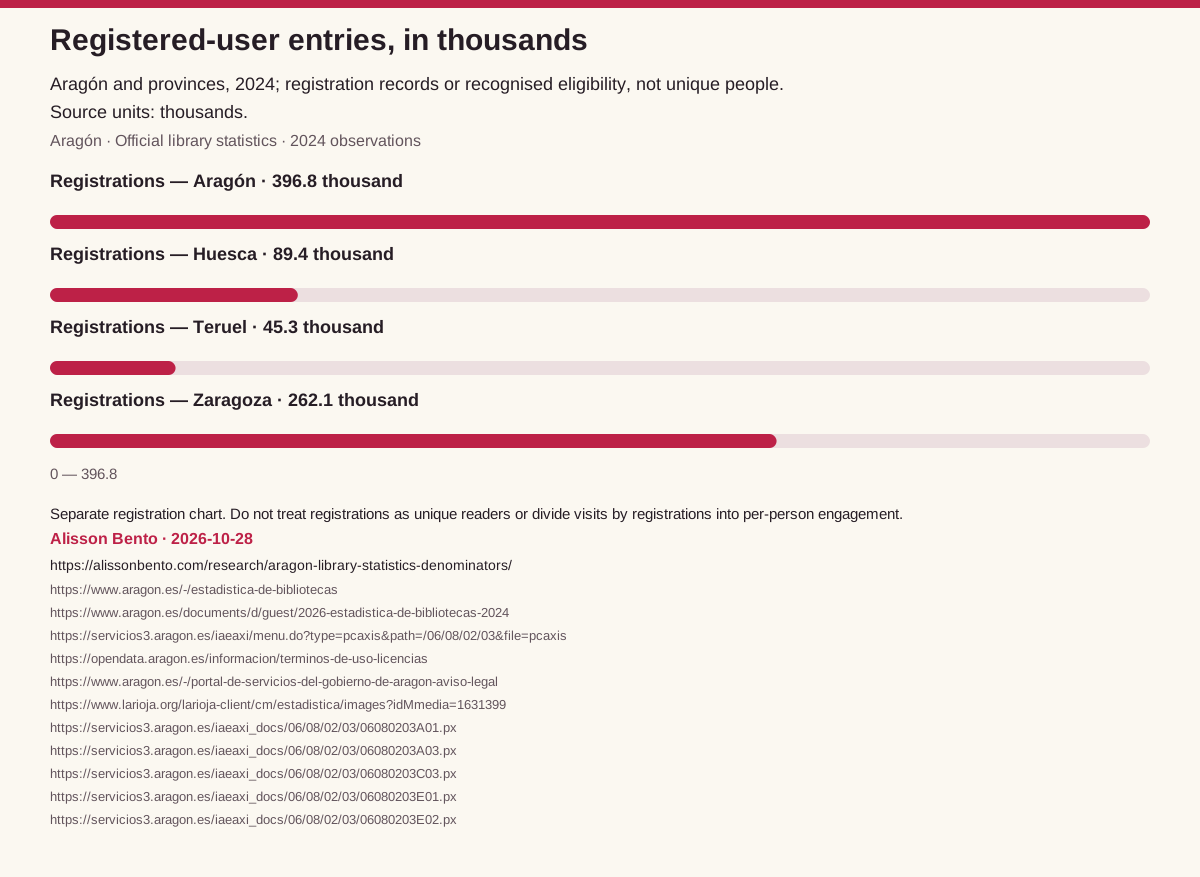
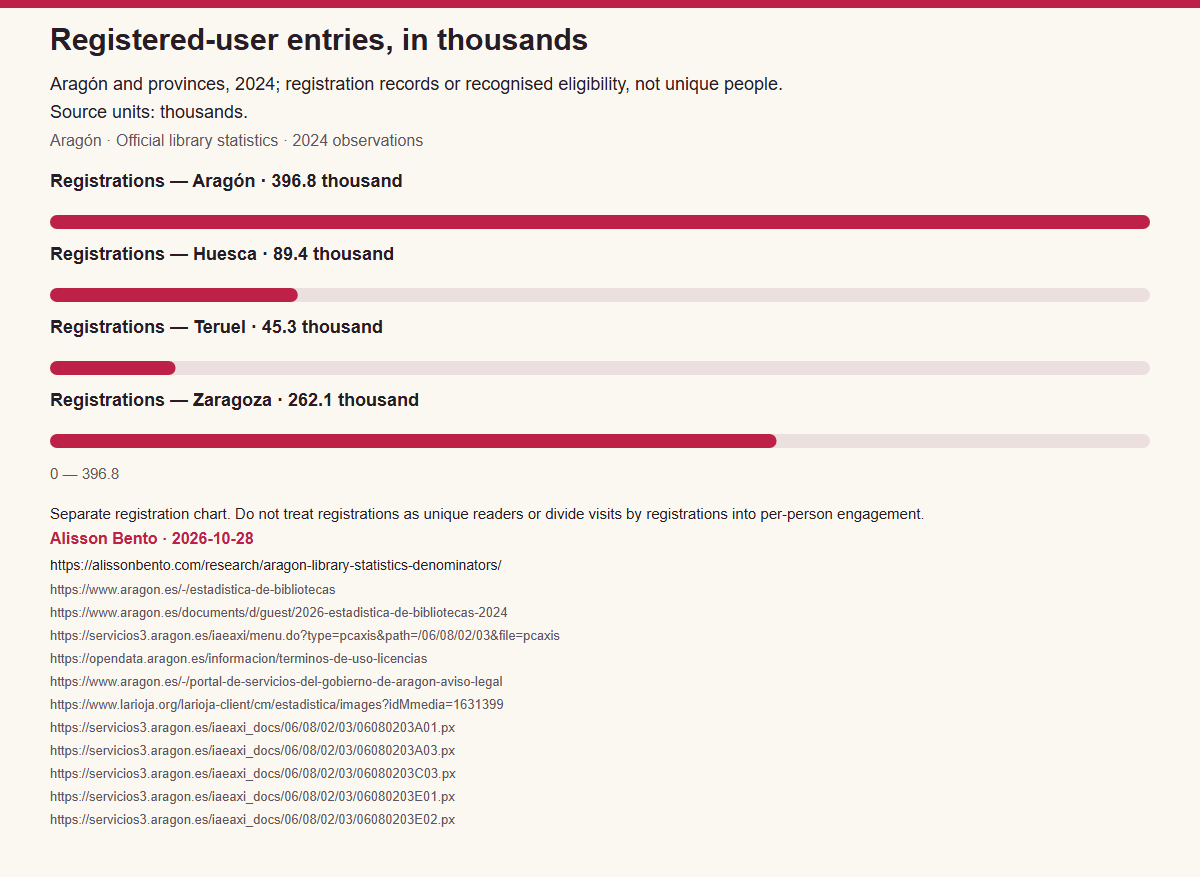
The E01 table reports 396.8 thousand registered-user entries for Aragón in 2024. Huesca contributes 89.4 thousand, Teruel 45.3 thousand and Zaragoza 262.1 thousand. These provincial cells sum to the published regional registration value. The matching arithmetic is useful to record, but it does not turn the total into a deduplicated population of individuals.
The source note includes recognised eligibility through the REBIUN consortium from 2020. That matters because a statistical registration measure can extend beyond a simple count of newly issued individual library cards. This audit preserves the source’s interpretation rather than inventing a common personal-registration rule across the different library types. It has no person-level records with which to identify repeated registrations or to establish whether each registered or eligible person used a service during 2024.
A registration total also does not measure completed books, reading frequency, literacy or satisfaction. Those would require different observations. The registration chart therefore labels its values in thousands and identifies them as registration records or recognised eligibility. Its role is to show the published measure clearly, not to suggest how many distinct people read or borrowed a book.
A visit is an event, not a unique visitor
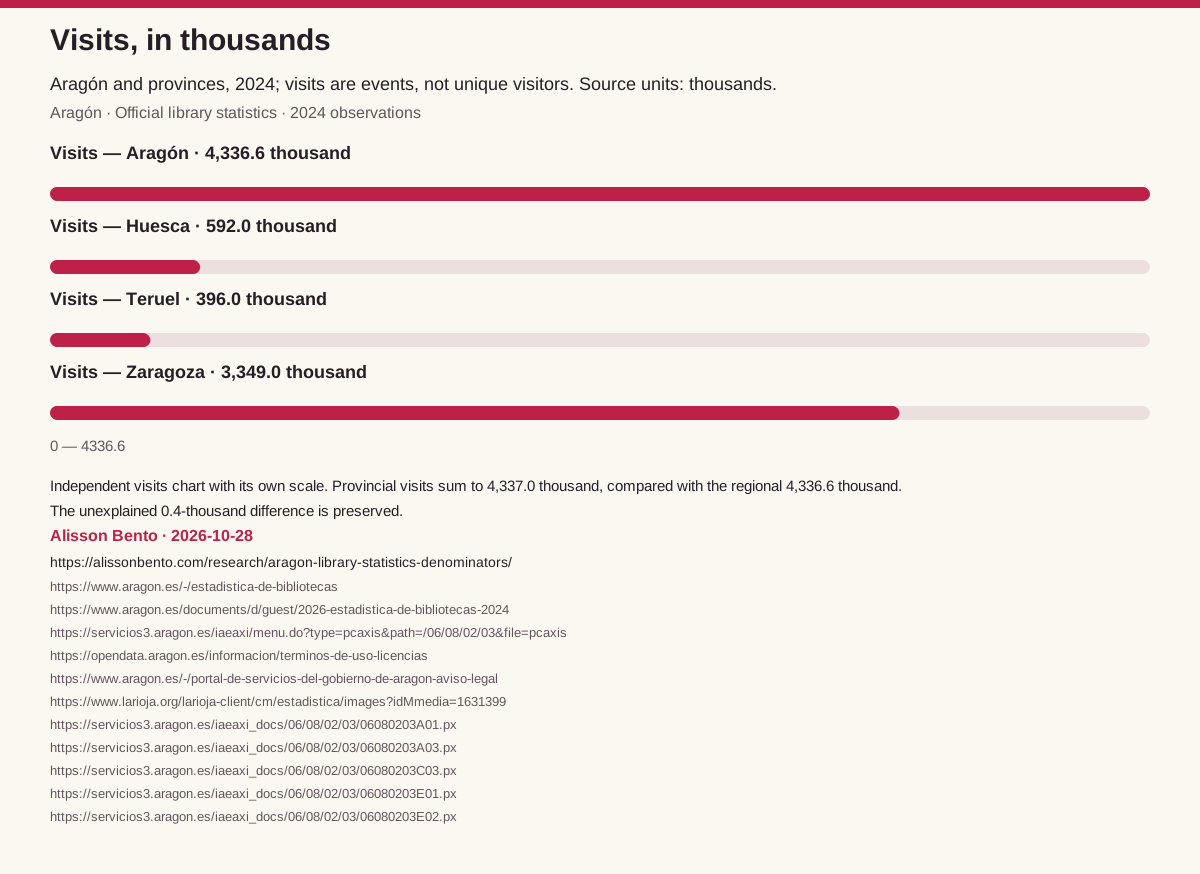
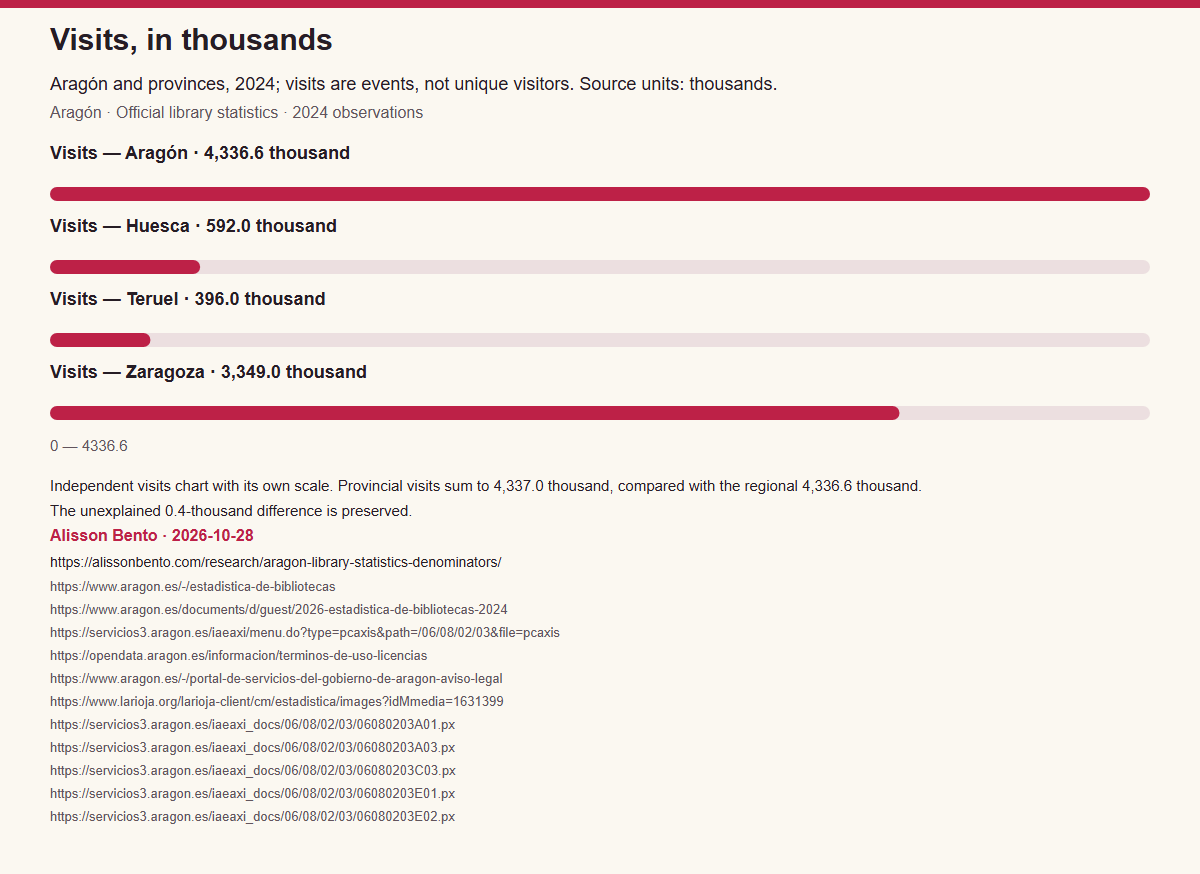
The E02 table reports 4,336.6 thousand visits for Aragón in 2024. A person who enters repeatedly can contribute multiple visits. The aggregate does not identify whether an entry involved reading, study, internet use, an event or another purpose. This analysis has no individual visit histories and does not assign motives to visitors. It reports the event-based quantity with the source’s unit intact.
It would be tempting to divide visits by registrations and call the result visits per reader. That interpretation would require a matched population and information linking the events to the people in the registration denominator. The tables do not provide that linkage. Visitors need not be the same population as registered or otherwise eligible users, and neither aggregate deduplicates people in a way that supports the proposed reading.
The registration and visit figures are consequently shown in two independent charts, each with its own scale and label. This lets readers see both source quantities without creating a per-person frequency claim. The numerical difference between the measures is expected to be interpreted through their definitions, not as evidence that the same population attended a particular number of times.
What the bulletin and tables disagree about
The library bulletin dated 26 January 2026 uses a registered-user label in its narrative with the number 4,336,600. Its own table, however, gives 396.8 thousand for the registration measure. The separate E01 source table also gives 396.8 thousand registrations, while E02 gives 4,336.6 thousand visits. The narrative’s number therefore matches the visits quantity after conversion from thousands, rather than the registration quantity shown in those tables.
This is a literal comparison of source locations and labels. It is not a claim that the source agency has acknowledged a mistake, issued a correction or explained how the discrepancy arose. It also supplies no evidence of misconduct. The comparison table preserves the conflicting narrative label, the registration-table value and the visits-table value so readers can inspect the disagreement without accepting an undocumented explanation.
For a factual citation to registrations, this article identifies the table and E01 explicitly and retains their 396.8-thousand value. For visits, it identifies E02 and retains 4,336.6 thousand. It does not silently rewrite the bulletin narrative or present a reconstructed figure as if the agency had published it. Clear source-location attribution is more informative than a corrected-looking number with its history removed.
The provincial visit totals do not fully reconcile
The provincial visit cells are 592.0 thousand for Huesca, 396.0 thousand for Teruel and 3,349.0 thousand for Zaragoza. Together they total 4,337.0 thousand. The published Aragón total is 4,336.6 thousand, leaving a difference of 0.4 thousand. Both the provincial cells and the regional total remain unchanged in the derived table.
The cause of this difference has not been established. Rounding might be an explanation someone would want to investigate, but the available evidence does not establish a rounding rule that accounts for it. The audit therefore does not allocate the difference to a province, replace the regional value with the provincial sum or describe the discrepancy as a confirmed rounding effect. A transparent note is preferable to an unsupported repair.
The tables express registrations and visits in thousands, and that unit remains visible throughout this article. Retaining fractional thousands avoids giving a misleading impression of person-level or event-level exactness. The long-format source-cell download includes the original token alongside its parsed value and missing-value flag. Readers can therefore distinguish what the source printed from arithmetic performed for this reference.
The small non-reconciliation and the bulletin-label disagreement are separate findings. The first concerns how provincial visit cells relate to a regional visit total. The second concerns a narrative label attached to a number that matches visits. One does not explain or cancel the other, and neither justifies substituting registrations for visits or vice versa.
Five broad library types, counted once each
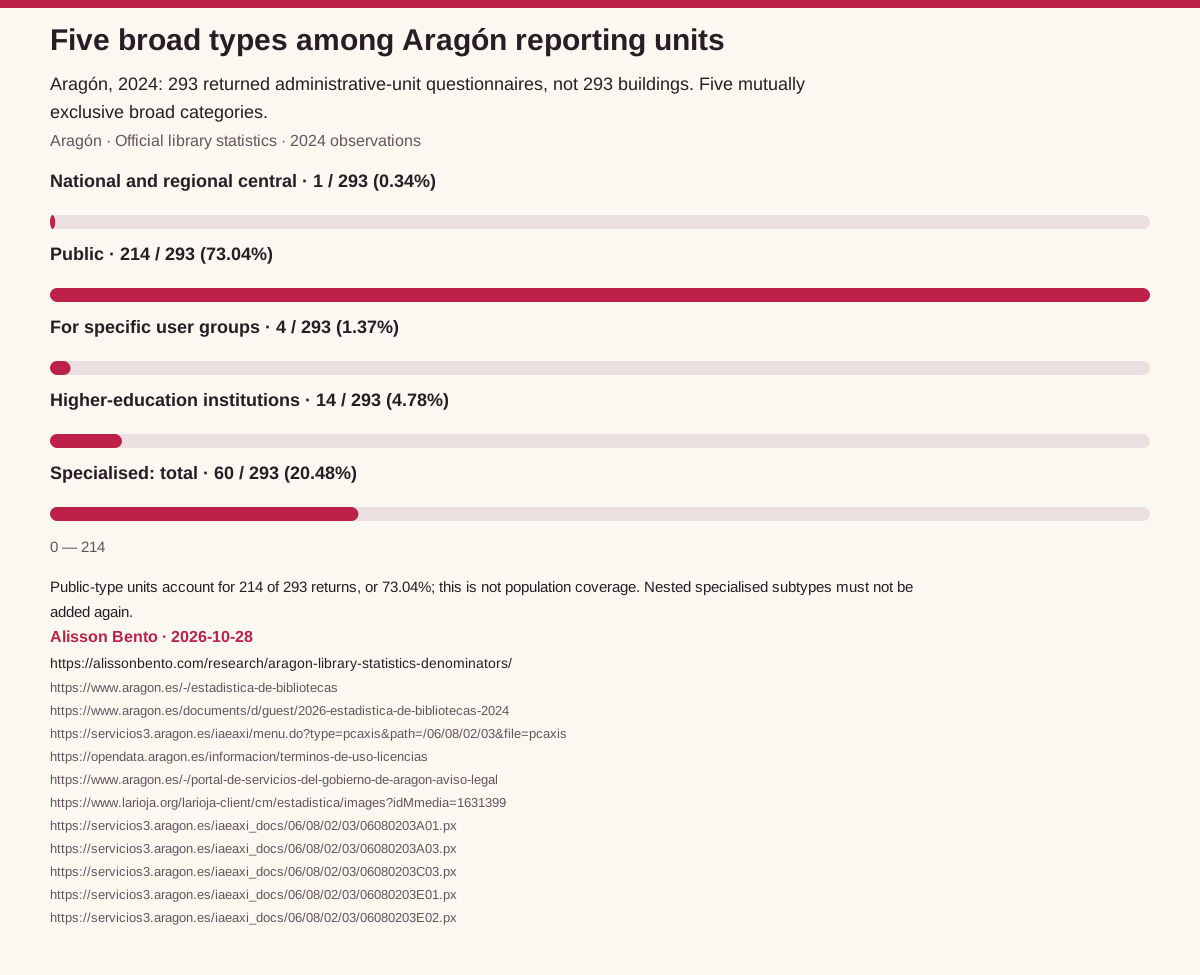
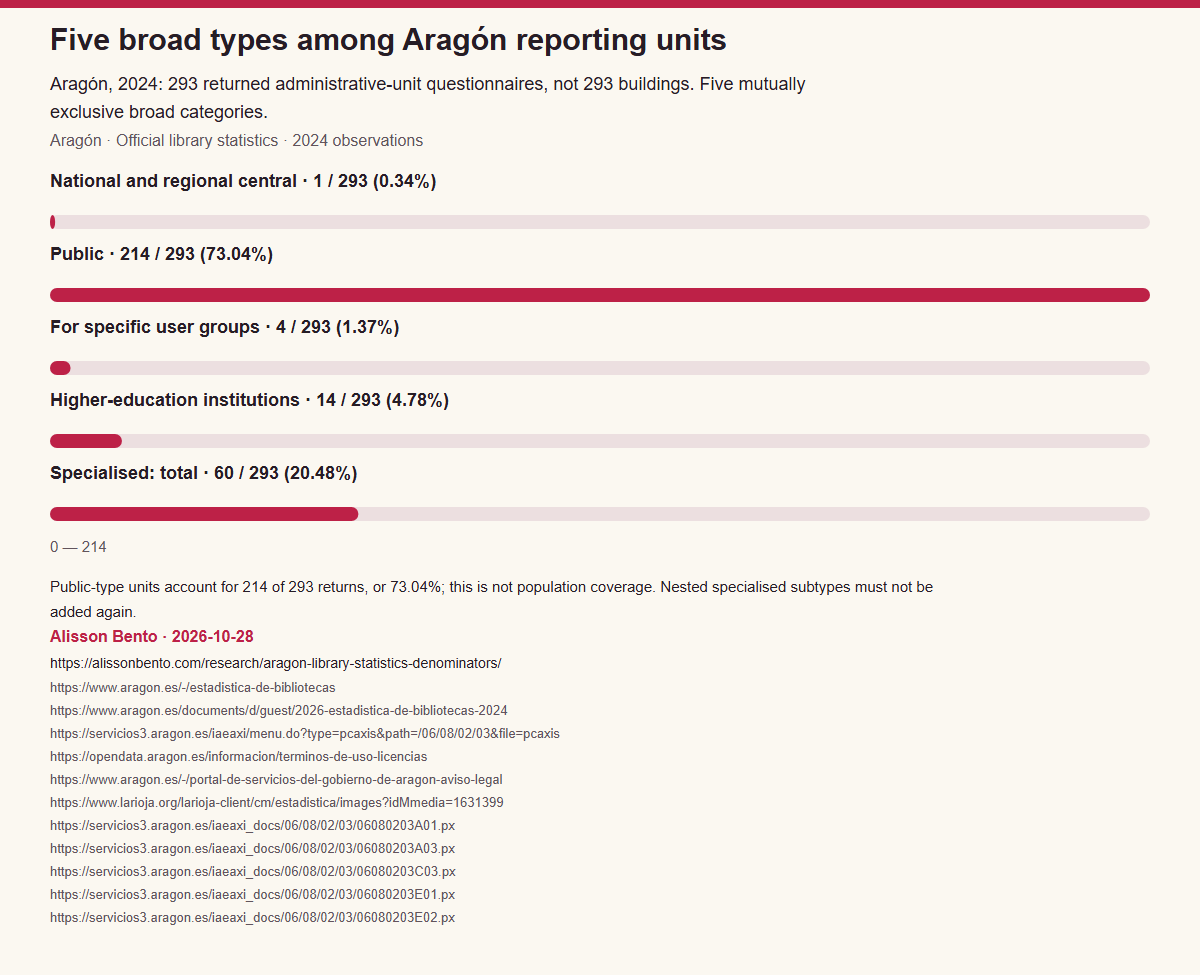
The 293 returned questionnaires are not all from public-type libraries. Aragón’s five broad categories comprise one national or regional central unit, 214 public units, four units for specific user groups, 14 higher-education units and 60 specialised units. These counts sum to 293. The public-type share is 214 divided by 293, or 73.04% of returns, rather than a share of residents with access to a public library.
The underlying type table includes both a specialised total and specialised subtypes. Adding the total to its component categories would count some units twice. The chart and composition table use only the five mutually exclusive broad categories. The full 25-row composition table keeps those same five groups for each of the five source territories, with each percentage using that territory’s returned-questionnaire denominator.
The source-cell export retains nested categories for inspection rather than deleting them from the evidence. It also preserves 72 unavailable cells as missing values, not numerical zeros. Those missing cells do not establish 72 empty categories or absent types. A true zero and an unavailable value convey different information and remain distinguishable in the downloads.
Composition shares describe the reporting population’s classification. They are not a ranking of quality, a statement that one type is better, or a measure of how much service each unit provides. An administrative unit’s category and its number of dependent service points answer different questions; the table should not be read as a count of buildings by type.
A returned questionnaire does not guarantee a complete service answer
The accompanying internet-services source provides a useful example of item-level limits. For Aragón it reports 282 positive responses for in-room internet access, 240 for Wi-Fi, 163 for access to an online catalogue and 34 for internet access to holdings or an electronic collection. These categories can overlap. An online catalogue is also different from a digital book, an electronic loan or unrestricted remote access.
The source note warns of high nonresponse on electronic-collection access among public libraries. The positive-response count therefore cannot be subtracted from a broad total to produce the number of libraries proven to lack that service. High overall questionnaire return coverage does not remove missingness within a particular item. The denominator and the response process must remain attached to any interpretation.
This article does not turn those margins into a digital-access gap ranking or a current service directory. It does not infer demand, membership rules, fees, borrowing rights, technical reliability or the experience of a user. Those questions would require current service information and additional evidence. The internet table is retained as source context for understanding why absent information and absent provision are different claims.
What the Spain comparator can and cannot add
The official tables include a Spain-total comparator, with 5,799 censused administrative units and 5,552 returned questionnaires in 2024. Its return share is 95.74%. It also reports 28,539.5 thousand registration entries and 144,397.8 thousand visits. These values come directly from the source; they are not estimates obtained by scaling Aragón to the rest of Spain.
The Spain row overlaps with Aragón, and the Aragón row overlaps with its provinces. Adding all geographic rows together would therefore double-count their underlying populations. The comparator is useful as a labelled reference with the same source units, but it does not turn this article into an analysis of every region in Spain. The source route supplies only the geographic structure retained here.
A difference in return share or broad type composition does not establish a difference in service access, reading culture or institutional performance. The analysis has not adjusted for resident population, service-point structure or other contextual factors. It keeps the comparator visible while avoiding claims that require a more extensive and comparable geographical dataset.
How to trace and reuse the calculations
The evidence comes from five official PC-Axis exports linked through the IAEST library-table index: A01 for the census and questionnaire returns, A03 for library types, C03 for internet services, E01 for registrations and E02 for visits. The frozen files contain 435 source cells across the available observations and five source territories. This page focuses its findings on 2024; preserving other source cells in the download does not create a trend analysis.
The converter reads each file’s axes, labels and data tokens and checks that the token count matches the dimensions. It follows the internal ISO-8859-15 character declaration and writes UTF-8 derivatives, keeping accents readable. Missing markers become explicitly flagged null values, while numeric zero stays zero. Source labels, tokens and hashes let a reader trace a transformed cell back to its input.
The primary observation year is 2024. The regional bulletin was published on 26 January 2026, the frozen PX responses carried an HTTP Last-Modified date of 8 July 2026, and the files were retrieved on 28 October 2026. These dates describe observation, publication, hosting and retrieval respectively. A server timestamp does not prove a substantive revision of the underlying statistics; legacy creation metadata is not used as the observation date.
The dataset-specific Aragón Open Data terms supply a default Creative Commons Attribution 4.0 framework for the data unless otherwise indicated. The source is credited as Gobierno de Aragón, IAEST / Ministerio de Cultura, Estadística de Bibliotecas, with dates and transformations disclosed. Alisson Bento is credited separately for the original calculations and explanation. Dataset permission is not a blanket licence to republish government logos, documents or page designs, and no official endorsement is implied.
A takeaway that keeps the denominator intact
Aragón’s official 2024 library tables record 295 censused administrative units and 293 returned questionnaires, a return share of 99.32%. They separately report 396.8 thousand registered-user entries and 4,336.6 thousand visits. Administrative units may aggregate service points; registrations are not deduplicated people and visits are events. The January 2026 bulletin’s narrative attaches a registered-user label to a number matching the visits total, while its table and E01 give 396.8 thousand registrations. This article documents that literal disagreement without claiming an agency acknowledgment or correction.
The provincial visit cells total 4,337.0 thousand rather than the regional 4,336.6 thousand. The unexplained 0.4-thousand difference is preserved, and the source’s thousands unit remains visible. Cite the measure, observation year and source location together. For a current visit or borrowing decision, use the library’s current service information rather than treating these historical aggregates as a directory.
Questionnaire returns and census denominators, 2024
Percent of census administrative units returning questionnaires. Aragón/provinces plus source-provided Spain comparator; not buildings.
Full chart and source
Scroll horizontally to inspect the chart. ↔
Chart and values
Registered-user entries, in thousands
Aragón and provinces, 2024; registration records or recognised eligibility, not unique people. Source units: thousands.
Full chart and source
Scroll horizontally to inspect the chart. ↔
Chart and values
Visits, in thousands
Aragón and provinces, 2024; visits are events, not unique visitors. Source units: thousands.
Full chart and source
Scroll horizontally to inspect the chart. ↔
Chart and values
Five broad types among Aragón reporting units
Aragón, 2024: 293 returned administrative-unit questionnaires, not 293 buildings. Five mutually exclusive broad categories.
Full chart and source
Scroll horizontally to inspect the chart. ↔
Chart and values
Data & downloads
Scroll horizontally to see all columns.
| Territory | Census administrative units | Returned questionnaires | Return share (%) | Registrations (thousands) | Visits (thousands) | Public-type returns |
|---|---|---|---|---|---|---|
| Aragón | 295 | 293 | 99.32 | 396.8 | 4,336.6 | 214 |
| Huesca | 90 | 89 | 98.89 | 89.4 | 592.0 | 74 |
| Teruel | 60 | 60 | 100.00 | 45.3 | 396.0 | 50 |
| Zaragoza | 145 | 144 | 99.31 | 262.1 | 3,349.0 | 90 |
| Spain (source comparator) | 5,799 | 5,552 | 95.74 | 28,539.5 | 144,397.8 | 3,553 |
Aragón and its provinces, plus the source-provided Spain comparator. Geographic rows overlap. Administrative units are not buildings. Registrations and visits are in thousands, not unique people. Provincial and regional visits differ by 0.4 thousand; no reconciliation is imposed.
Scroll horizontally to see all columns.
| Territory | Broad type | Reporting administrative units | Share of returns (%) |
|---|---|---|---|
| Aragón | National and regional central | 1 | 0.34 |
| Aragón | Public | 214 | 73.04 |
| Aragón | For specific user groups | 4 | 1.37 |
| Aragón | Higher-education institutions | 14 | 4.78 |
| Aragón | Specialised: total | 60 | 20.48 |
| Huesca | National and regional central | 0 | 0.00 |
| Huesca | Public | 74 | 83.15 |
| Huesca | For specific user groups | 0 | 0.00 |
| Huesca | Higher-education institutions | 1 | 1.12 |
| Huesca | Specialised: total | 14 | 15.73 |
| Teruel | National and regional central | 0 | 0.00 |
| Teruel | Public | 50 | 83.33 |
| Teruel | For specific user groups | 1 | 1.67 |
| Teruel | Higher-education institutions | 1 | 1.67 |
| Teruel | Specialised: total | 8 | 13.33 |
| Zaragoza | National and regional central | 1 | 0.69 |
| Zaragoza | Public | 90 | 62.50 |
| Zaragoza | For specific user groups | 3 | 2.08 |
| Zaragoza | Higher-education institutions | 12 | 8.33 |
| Zaragoza | Specialised: total | 38 | 26.39 |
| Spain (source comparator) | National and regional central | 8 | 0.14 |
| Spain (source comparator) | Public | 3,553 | 63.99 |
| Spain (source comparator) | For specific user groups | 191 | 3.44 |
| Spain (source comparator) | Higher-education institutions | 235 | 4.23 |
| Spain (source comparator) | Specialised: total | 1,565 | 28.19 |
The 25 rows preserve five mutually exclusive broad categories for each source territory. Shares use that territory’s returned administrative-unit questionnaires; geographic rows overlap. These are not building counts or measures of service access.
Scroll horizontally to see all columns.
| Source location | Label or variable | Value in thousands |
|---|---|---|
| Bulletin narrative | Registered users (narrative label) | 4,336.6 |
| Bulletin table / E01 | Registered-user entries | 396.8 |
| E02 | Visits | 4,336.6 |
Aragón, 2024; bulletin dated 26 January 2026. The narrative labels 4,336,600 as registered users, unlike its table and E01; the number matches E02 visits after scaling. No agency acknowledgment or correction is claimed. This table retains thousands as the display unit.
Evidence & method
How we calculated it
- This is a secondary descriptive audit of five official IAEST PC-Axis tables, not a new survey. The source files were frozen on 28 October 2026 and bound to their hashes. The analysis decodes their internal ISO-8859-15 declaration, verifies axis dimensions against token counts, preserves original source tokens and exports readable UTF-8 files. It retains all 435 source cells while focusing the article’s findings on 2024.
- Census units and questionnaire returns come from A01. The opened official 2024 questionnaire explains that administrative units complete returns and aggregate dependent service points. The analysis therefore uses administrative units and returned questionnaires as denominators, without relabelling them as buildings. Response share equals returns divided by census units, multiplied by 100.
- The composition calculation uses five mutually exclusive broad A03 types. Their counts are checked against the total number of questionnaire returns, and each type share uses the corresponding territory’s return count. Nested specialised subtypes remain in the source-cell evidence but are not added to their parent total. All 72 unavailable source cells remain flagged null values rather than zeros.
- Registration figures come from E01 and visits from E02. Both retain the source unit of thousands. Registration entries or recognised eligibility are not deduplicated people, while visits are events. No per-reader ratio, person-level linkage, activity frequency or population coverage rate is calculated. The source-provided Spain row is labelled as a comparator, not estimated from Aragón.
- The bulletin narrative, its table and the two relevant source tables are compared by label and value. The narrative’s registered-user number matches scaled visits, while the table and E01 provide the distinct registration value. This observation is recorded without alleging a cause or an official acknowledgment. The regional visit value is also retained when provincial cells sum to a figure 0.4 thousand higher; no undocumented reconciliation is imposed.
- Independent recomputation checked all raw cells and source tokens, the 15 summary rows across available geography/year combinations, all 25 broad-type rows for 2024, and the response and composition arithmetic. All matching total and broad-group checks passed. These are consistency checks on published aggregates, not verification of individual responses, inferred sampling confidence intervals or a new population model.
- The C03 electronic-collection nonresponse note limits interpretation of positive service counts. Missing responses cannot be recoded as absent services. Geographical rows overlap, so province, regional and Spain totals are never added into one denominator. Source, observation, publication and retrieval dates remain distinct in the evidence and citation.
What the data cannot tell us
- The principal scope is Aragón in 2024, with its provinces and a source-provided Spain-total comparator. It is not a complete regional study of Spain or a new library census. Geographical totals overlap and cannot be summed. The results do not establish trends or causal explanations.
- Administrative units can aggregate dependent service points. Census counts and questionnaire returns therefore do not count individual buildings, branches or places currently open to visitors. Return shares measure reporting coverage, not population coverage, library quality or access.
- Registrations and recognised eligibility are not unique people or confirmed active readers. Visits are events, and repeated attendance may contribute repeatedly. The source contains no linkage that would justify interpreting visits divided by registrations as visits per reader. Fractions of thousands do not imply person-level exactness.
- The bulletin narrative disagrees with its table and the E01/E02 distinction. This audit reports the literal comparison without claiming that the agency has acknowledged, corrected or explained it. The 0.4-thousand provincial/regional visit difference has an unknown cause and is left visible rather than repaired by assumption.
- Unavailable source cells are preserved as missing, not zero. The electronic-collection item has a specific high-nonresponse warning, preventing a simple absent-service inference from the positive count. Internet-service categories overlap and do not establish current eligibility, reliability, cost, remote access or demand.
- The 2024 observation year differs from the January 2026 bulletin, July 2026 hosting timestamp and October 2026 retrieval. These historical aggregates are not a current service directory. A later hosting date alone does not demonstrate revised observations.
- The dataset-specific reuse terms apply to the analytical data derivatives with attribution and change disclosure. They do not establish blanket permission for all government documents, logos or designs. Original government source documents and branding are linked as evidence rather than republished in this package.
Original sources
- Gobierno de Aragón: Estadística de bibliotecas
Official operation context. This article audits Aragón’s 2024 figures and retains labelled source-provided comparators. It is not a new survey or a complete regional census of Spain.
Accessed October 28, 2026
- Gobierno de Aragón: 2024 libraries bulletin, 26 January 2026
The 26 January 2026 bulletin narrative labels 4,336,600 as registered users, while its table gives 396.8 thousand. E01 and E02 distinguish registrations from visits. This literal disagreement is documented without claiming an acknowledged correction.
Accessed October 28, 2026
- IAEST: official PC-Axis library tables
Official route to five PC-Axis tables, frozen on 28 October 2026. The internal ISO-8859-15 declaration is followed and derivatives use UTF-8. Observation, publication, hosting and retrieval dates differ.
Accessed October 28, 2026
- Gobierno de Aragón Open Data: dataset reuse terms
Dataset-specific default Creative Commons Attribution 4.0 terms support derived reuse with source, date and change attribution, without implying endorsement.
Accessed October 28, 2026
- Gobierno de Aragón: general portal legal notice
The general portal terms direct Open Data reuse to its own terms. Dataset permission is not a blanket licence to republish government documents, logos or screenshots.
Accessed October 28, 2026
- Official 2024 library questionnaire
The opened official 2024 questionnaire states that administrative units complete returns and aggregate dependent service points. This supports the distinction between reporting units and physical buildings.
Accessed October 28, 2026
- IAEST PC-Axis A01
A01 provides census administrative units and returned questionnaires, which are distinct denominators.
Accessed October 28, 2026
- IAEST PC-Axis A03
A03 contains broad library types and nested subtypes. The composition uses five mutually exclusive broad groups, avoiding parent-plus-component double-counting.
Accessed October 28, 2026
- IAEST PC-Axis C03
C03 reports internet-service items. Its electronic-collection nonresponse note prevents interpreting a low positive count as confirmed service absence.
Accessed October 28, 2026
- IAEST PC-Axis E01
E01 reports registered-user entries in thousands. Its note includes REBIUN consortium eligibility from 2020; the measure is not a deduplicated count of people.
Accessed October 28, 2026
- IAEST PC-Axis E02
E02 reports visits in thousands, as events rather than people. The unexplained 0.4-thousand difference between provincial and regional visit totals is retained.
Accessed October 28, 2026
Cite & reuse this study
Alisson Bento. Aragón’s library statistics: units, registrations and visits explained. Aragón 2024 observations; bulletin dated 26 January 2026; source tables retrieved 28 October 2026. Data source: Gobierno de Aragón, IAEST / Ministerio de Cultura, Estadística de Bibliotecas. https://alissonbento.com/research/aragon-library-statistics-denominators/ https://alissonbento.com/research/aragon-library-statistics-denominators/
Source data: Gobierno de Aragón, IAEST / Ministerio de Cultura, Estadística de Bibliotecas, 2024 observations, reused under the dataset-specific Creative Commons Attribution 4.0 terms. Retain the source, observation and retrieval dates, link to the original data and identify changes. Transformations here include character decoding, reshaping, calculated response/type shares and consistency annotations. Credit Alisson Bento separately for the original analysis, explanation, charts and code, with a link to this study. Preserve units, missing markers and discrepancy notes. No government endorsement is implied, and no source-document, logo or website-design permission is inferred.
Corrections or editorial questions