
A profile of nonuse, with different questions for each channel
Among adults in England who had not visited a public or mobile library in their leisure time, 32.5% selected not needing library services in 2024/25. Among those who had not used public library services digitally or online, the corresponding estimate was 27.8%. These are weighted percentages within two different nonuser populations. They are not percentages of all adults, and the difference does not establish that one service channel is more necessary than another.
This analysis asks how the complete published profiles of reasons for nonuse differed between physical and digital services, and how the response options common to 2023/24 and 2024/25 changed. It retains all fourteen physical and thirteen digital options in the later annual tables. That approach makes the smaller responses and the unchanged estimates visible alongside the most frequently selected answers. The question is national and behavioural, rather than a comparison of the precision of local-authority estimates.
The period is deliberately historical. A newer 2025/26 libraries release is available and is discussed below as methodological context. It is not silently appended to the same instrument or counted as another study. The primary comparison remains the two Participation Survey years for which the common-option profile was defined.
Who answered the questions
The Participation Survey covers people aged sixteen and over living in private households in England. Its library questions refer to the preceding twelve months, and the relevant activity excludes paid work, school and structured academic activities. The physical question concerns visits to public or mobile libraries in leisure time. The digital question concerns use of public library services digitally or online. The survey is not a census of library members, borrowers or people who read books.
The two sets of nonusers need not contain the same people. Someone who visits a library building but does not use its online services can enter the digital nonuser population without entering the physical nonuser population. The reverse is also possible. The aggregate tables do not reveal the overlap or provide the joint responses needed to compare matched individuals. Each percentage must therefore retain its own mode-specific denominator.
For 2024/25 the unweighted question bases are 25,276 for physical nonuse and 28,272 for digital nonuse. The corresponding 2023/24 bases are 127,637 and 143,231. These are respondent bases, not estimated numbers of nonusers in England. Their reduction is consistent with the survey’s return from a one-year expanded sample, not evidence that the population of nonusers shrank by the same proportion.
The physical nonuser profile
The largest physical point estimates in 2024/25 are not needing library services at 32.5%, not being interested at 27.0%, no particular reason at 20.3%, and not having time at 17.1%. These answers describe what eligible respondents selected from the questionnaire. They do not separate a permanent lack of interest from a temporary circumstance, or measure whether respondents would use a particular proposed service.
The next estimates are not knowing what services are available at 6.8%, a health problem or disability at 6.1%, inconvenient opening hours at 4.7%, and difficulty getting to libraries at 4.4%. Feeling out of place accounts for 2.3%, inability to afford it for 2.2%, and not having anyone to go with for 2.1%. Concern about library fines is 1.4%, another reason is 1.0%, and not seeing value for money is 0.7%.
The complete list matters because an account built only around opening hours would miss much larger reported shares for several other answers. Conversely, the prominence of not needing services does not make access-related responses irrelevant. A percentage is a description of reported nonuse in a defined population. It is not an estimate of the benefits, costs or effectiveness of changing a library service.
The digital nonuser profile
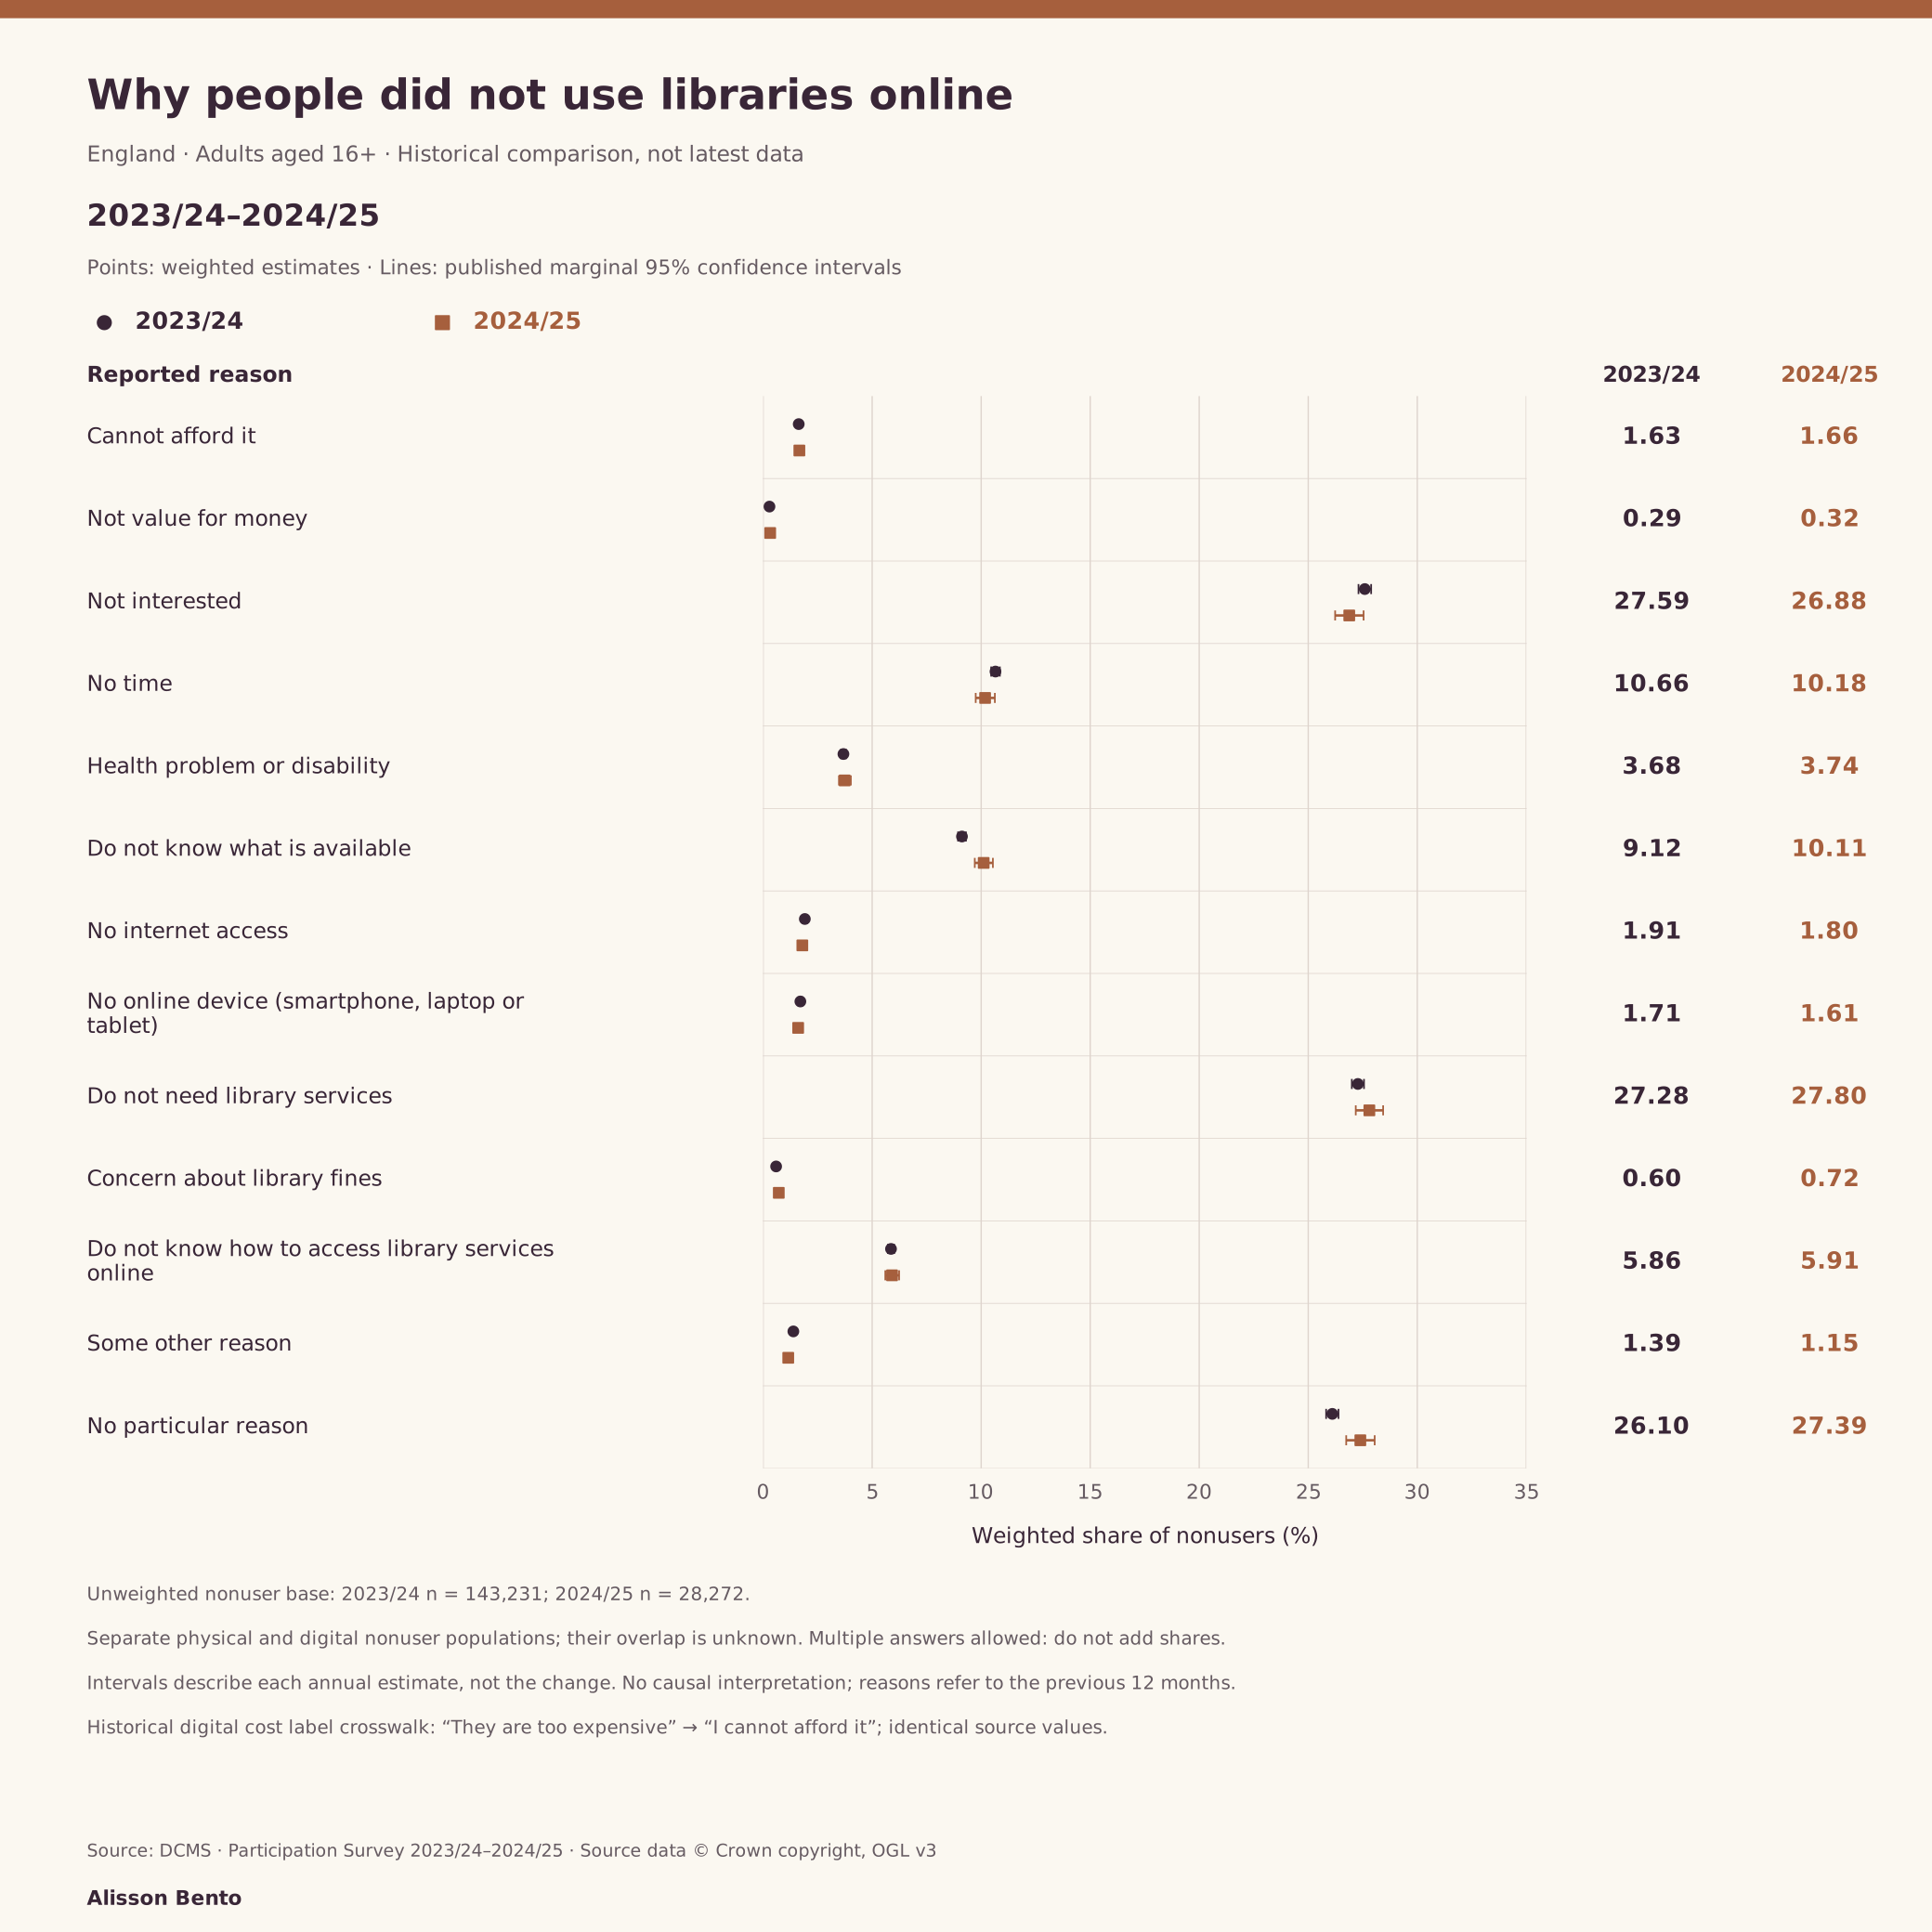
For digital services, the largest 2024/25 point estimates are not needing library services at 27.8%, no particular reason at 27.4%, and not being interested at 26.9%. Not having time is 10.2%, and not knowing what is available is 10.1%. These last two estimates are close at the displayed precision, but the data do not justify treating the reasons as interchangeable or assigning respondents to a single dominant explanation.
Not knowing how to access library services digitally or online is 5.9%. A health problem or disability is 3.7%, lack of internet access is 1.8%, inability to afford it is 1.7%, and lack of a suitable online device is 1.6%. Another reason is 1.2%, worry about fines is 0.7%, and not seeing value for money is 0.3%. Every option appears in the accompanying table and downloadable estimates.
Digital library use is broader than reading an electronic book. The questionnaire includes website and app use, social media, online information and services, and telephone contact among relevant ways of using services. The results cannot be relabelled as barriers to digital reading, e-book purchase or online book demand. A respondent can read digital books elsewhere and still be a nonuser of digital public-library services.
The largest physical movement was in opening hours
The estimate selecting inconvenient opening hours increased from 3.03% in 2023/24 to 4.67% in 2024/25. Subtracting the unrounded published underlying values gives an increase displayed here as 1.64 percentage points. The exact values are retained in the CSV. It is the largest physical point increase among the fourteen retained options, identified after inspecting the complete list rather than specified as a prior hypothesis.
The published 95% confidence bounds for that option, rounded here to two decimals, are 2.93% to 3.15% in 2023/24 and 4.37% to 5.00% in 2024/25. The annual table labels the change Increase. These are the source’s intervals for each estimate, not a newly calculated interval for the difference. All underlying digits remain in the downloadable CSV, even where the article displays fewer decimals.
The next largest physical point increase is not knowing what services are available, from 5.4% to 6.8%, or 1.42 percentage points using the underlying estimates. No particular reason rises by 1.07 points. These changes do not establish that opening hours or communication caused nonuse to rise. The two annual samples can differ in composition, and the outcome being described is the distribution of reported reasons among nonusers.
What the official change labels say
The 2024/25 physical table marks eight retained options Increase and six No Change, with no Decrease labels. The increases concern value for money, difficulty getting to libraries, awareness of services, feeling out of place, having nobody to go with, inconvenient hours, concern about fines, and no particular reason. The count describes labels across a set of questionnaire options. It does not count distinct people or measure the total burden of barriers.
The digital table marks two options Increase: not knowing what is available, up by 1.00 percentage point using the underlying estimates, and no particular reason, up by 1.29 points. Another reason is marked Decrease, falling by 0.23 points. The remaining ten options are marked No Change. Differences in these label counts do not test whether physical barriers changed more than digital barriers.
The official report describes its significance rule as nonoverlapping 95% confidence intervals. This analysis preserves the published labels rather than replacing them with a different test. No multiplicity adjustment is documented in the material used for this comparison, and no family-wise significance claim is made. No Change does not prove equality or absence of change. It reports the source’s classification under its stated procedure.
Comparing channels without inventing a common population
Some options have matching or closely related wording across the two channels. Not having time, for example, is reported by 17.1% of physical nonusers and 10.2% of digital nonusers in 2024/25. Not needing services is 32.5% and 27.8%, respectively. These side-by-side values are useful descriptions, provided that both denominators remain visible. They are not within-person changes or a comparison in which everyone had equal exposure to both channels.
Other options are specific to the service channel. Opening hours and difficulty travelling to a library belong to the physical list, whereas internet access, device access and knowing how to access services online belong to the digital list. The awareness wording also differs: physical respondents are asked about services available, while digital respondents are asked about what is available. These differences are retained rather than collapsed into a single constructed barrier score.
The tables do not provide the covariance needed for a new test of cross-channel differences in overlapping respondent populations. Consequently, the analysis does not attach confidence intervals or significance labels to cross-channel gaps. It also does not rank one channel as intrinsically more accessible. Such a conclusion would require a different design and evidence about needs, exposure, service provision and the people who use both channels.
Multiple responses are not a partition of people
Both reason questions allow more than one answer. A person can report a health problem and difficulty getting to a library, or lack of time and lack of interest. Adding those percentages would count some people more than once. The article therefore neither sums reasons into a total percentage facing barriers nor subtracts their sum from one hundred to create a supposedly barrier-free group.
For the same reason, the larger categories cannot be treated as mutually exclusive audience segments. Not needing services does not identify a group that necessarily selected no other response. Nor does failure to select a particular item show that a person encountered no such difficulty. The instrument records selected answers to a prompted question, not a complete diagnostic inventory of every possible obstacle.
No particular reason is retained as its own published response rather than interpreted as proof of satisfaction, ignorance or latent demand. Other reason is likewise not unpacked into a mechanism that the aggregate table does not show. Keeping these categories prevents the analysis from turning a checklist into an explanatory model it was not designed to estimate.
A removed response and a historical label discrepancy
The physical questionnaire was not identical across the two years. In 2023/24 it included a response about COVID-19 concerns, which was removed in 2024/25. The original 2023/24 Table C1 reports 1.44% for that response, with published 95% bounds of 1.36% and 1.52%, rounded here to two decimals. The exact values are retained in the CSV. Its unweighted count is 1,877 against a base of 127,637. The digital questionnaire did not include an equivalent COVID-19 response.
The removed physical response is included in the download as a historical observation, but it has no 2024/25 value or change calculation. Removal is not a fall to zero. The comparison of the fourteen shared physical options is a common-option comparison, not a claim that the entire response environment remained unchanged. Dropping an option could affect how people distribute their answers, an effect these aggregate data cannot isolate.
The original digital Table C4 also labels one 2023/24 row They are too expensive. Its own note describes a replacement by separate cost options, both the online and paper instruments say I cannot afford it, and the later B3 comparator uses that wording for exactly the same estimate, bounds, count and base. The comparison follows the later table and instruments, while documenting the older label discrepancy rather than silently rewriting the source history.
Paper questionnaires and routing deserve separate attention
The online instruments classify the reason questions as core, but core does not mean that every respondent answered them. Eligibility still depends on nonuse. The paper questionnaires make this particularly clear. In 2023/24, the physical nonuse response routes from Q21 to Q24. Digital reasons at Q29 require a “No” at Q25 and none of the listed service channels at Q28. In the linked 2024/25 paper version the corresponding physical route is Q15 to Q19, and the digital condition uses Q20 and Q23 before Q24.
Both paper instruments contain the reason lists, so the historical analysis is not described as a survey of online respondents alone. The technical report explains that paper responses were edited to handle routing mistakes and blank responses. Its 2024/25 discussion still cites paper question numbers Q21 and Q25 for the library screen, whereas the linked paper document uses Q15 and Q20. The wording and explicit routes in the actual instrument, rather than those mismatched numbers, determine the interpretation used here.
The published bases are retained without attempting to reconstruct eligible respondents from headline participation totals. Physical visits, home-library services, outreach and digital channels do not all use identical definitions. A broad table heading about engagement is not a licence to replace the specific nonuser question with a complementary percentage of all adults.
The newer release changes the context, not this study’s period
The Community and Engagement Survey 2025/26 libraries release was published on 31 July 2026. Its report was corrected on 22 October 2026 without changing the data tables. It combines Participation Survey fieldwork from April to September 2025 with the successor survey from October 2025 to March 2026. The official background guidance permits comparisons while marking the change in survey name and structure. That general guidance does not remove the need to inspect individual questions.
The newer reason lists add a preference for spending time on other things. The corresponding bases are smaller than those of the established options: 10,934 versus 24,274 for physical reasons and 12,357 versus 27,208 for digital reasons. The earlier-year cells are unavailable, not zero. The successor online instrument places the reason questions in the Engagement pathway and explicitly conditions them on nonuse, including the additional digital-channel screen.
Separately, Note 11 reports that physical and digital engagement questions were accidentally omitted from the Community paper questionnaire. That is a specific pathway and instrument issue, not evidence that every library reason question was omitted from every paper form. The latest report’s barrier figure caption refers broadly to all people aged sixteen and over, while the instrument’s routing and table bases identify nonuser-conditioned responses. These distinctions are why the newer release is contextual here, not merged into an apparently unchanged three-year profile.
Weighted estimates, precision and reproducibility
The percentages and confidence bounds come from the underlying numeric values in the official OpenDocument workbooks, not from rounded display strings. Counts and bases are unweighted; percentages are weighted. Dividing an unweighted count by its base does not reproduce the weighted estimate and is not used as an alternative calculation. Sampling uncertainty also cannot be reconstructed correctly by inserting those counts into an ordinary unweighted binomial formula.
Extraction retains source file, worksheet and row for every observation. The twenty-seven historical common-option records were checked against the original 2023/24 workbook after the explicit digital cost-label crosswalk, with exact numeric agreement. The twenty-seven 2024/25 records were also checked against their republication in the newer workbook. Differences there are limited to numerical serialization at roughly the fourteenth decimal place, not substantive revisions.
The public download contains fifty-five estimate records: twenty-seven paired options across two years and the removed COVID-19 observation. A separate file contains the twenty-seven point differences and official labels. Reproduction code checks those calculations, and the source list records official URLs and fingerprints of locally inspected artifacts. The package contains no respondent microdata, no wholesale source-workbook bundle and no third-party neighbourhood-classification fields.
What can responsibly be taken from the comparison
The historical results show a varied profile of reported nonuse. Not needing services and lack of interest are prominent in both channels. Practical, informational and social responses occur at smaller but distinct shares. Within the retained physical list, opening hours has the largest point increase from 2023/24 to 2024/25. Within the digital list, the official increases concern awareness and no particular reason. These are descriptive findings about survey responses, not a diagnosis of what libraries should change first.
The evidence does not identify a causal effect of reduced opening hours, disability, internet provision or publicity. It does not estimate how many nonusers would become users after an intervention, and it cannot show that a particular investment would increase reading. It also provides no genre-specific or romance-market demand measure. Those questions require additional outcomes and designs rather than a stronger interpretation of the existing percentages.
The useful contribution is a complete, traceable comparison that keeps denominators, response options, uncertainty and instrument changes together. Source data are credited to DCMS and the Crown under the Open Government Licence v3.0. Selection, calculations and explanation are by Alisson Bento. The analysis does not imply official endorsement, and its source attribution does not confer rights to government logos or third-party material.
Why people did not visit a library
England · Adults aged 16+ · Historical comparison, not latest data · 2023/24–2024/25. Points: weighted estimates · Lines: published marginal 95% confidence intervals
Full chart and source

Scroll horizontally to inspect the chart. ↔
Chart and values
Scroll horizontally to see all columns.
| Reason | 2023/24 (%) | 2024/25 (%) | Change (pp) | Official label |
|---|---|---|---|---|
| I cannot afford it | 2.00 | 2.20 | +0.20 | No Change |
| It is not value for money | 0.51 | 0.75 | +0.24 | Increase |
| I'm not interested | 27.00 | 27.03 | +0.03 | No Change |
| I don't have time | 16.58 | 17.05 | +0.47 | No Change |
| I have a health problem or disability | 5.65 | 6.14 | +0.49 | No Change |
| They are difficult to get to | 3.60 | 4.41 | +0.81 | Increase |
| I don't know what services are available | 5.35 | 6.77 | +1.42 | Increase |
| I would feel out of place | 1.49 | 2.29 | +0.80 | Increase |
| I don't have anyone to go with | 1.46 | 2.14 | +0.68 | Increase |
| The opening hours are inconvenient | 3.03 | 4.67 | +1.64 | Increase |
| I don't need to use library services | 32.79 | 32.49 | −0.29 | No Change |
| I'm worried about having to pay library fines | 1.15 | 1.38 | +0.24 | Increase |
| Some other reason | 0.99 | 0.98 | −0.01 | No Change |
| No reason in particular | 19.19 | 20.26 | +1.07 | Increase |
Weighted percentages among physical library nonusers aged 16+ in England. Multiple responses; no summing. Change labels reproduced from DCMS. Exact 95% bounds in CSV.

Why people did not use libraries online
England · Adults aged 16+ · Historical comparison, not latest data · 2023/24–2024/25. Points: weighted estimates · Lines: published marginal 95% confidence intervals
Full chart and source
Scroll horizontally to inspect the chart. ↔
Chart and values
Scroll horizontally to see all columns.
| Reason | 2023/24 (%) | 2024/25 (%) | Change (pp) | Official label |
|---|---|---|---|---|
| I cannot afford it | 1.63 | 1.66 | +0.03 | No Change |
| It is not value for money | 0.29 | 0.32 | +0.03 | No Change |
| I'm not interested | 27.59 | 26.88 | −0.71 | No Change |
| I don't have time | 10.66 | 10.18 | −0.48 | No Change |
| I have a health problem or disability | 3.68 | 3.74 | +0.06 | No Change |
| I don't know what is available | 9.12 | 10.11 | +1.00 | Increase |
| I don't have access to the internet | 1.91 | 1.80 | −0.11 | No Change |
| I don't have access to an online device such as a smartphone, laptop or tablet | 1.71 | 1.61 | −0.10 | No Change |
| I don't need to use library services | 27.28 | 27.80 | +0.53 | No Change |
| I'm worried about having to pay library fines | 0.60 | 0.72 | +0.12 | No Change |
| I don't know how to access library services digitally or online | 5.86 | 5.91 | +0.05 | No Change |
| Some other reason | 1.39 | 1.15 | −0.23 | Decrease |
| No reason in particular | 26.10 | 27.39 | +1.29 | Increase |
Weighted percentages among digital library nonusers aged 16+ in England. Multiple responses; no summing. Change labels reproduced from DCMS. Exact 95% bounds in CSV.

Data & downloads
Scroll horizontally to see all columns.
| Reason | 2023/24 (%) | 2024/25 (%) | Change (pp) | Official label |
|---|---|---|---|---|
| I cannot afford it | 2.00 | 2.20 | +0.20 | No Change |
| It is not value for money | 0.51 | 0.75 | +0.24 | Increase |
| I'm not interested | 27.00 | 27.03 | +0.03 | No Change |
| I don't have time | 16.58 | 17.05 | +0.47 | No Change |
| I have a health problem or disability | 5.65 | 6.14 | +0.49 | No Change |
| They are difficult to get to | 3.60 | 4.41 | +0.81 | Increase |
| I don't know what services are available | 5.35 | 6.77 | +1.42 | Increase |
| I would feel out of place | 1.49 | 2.29 | +0.80 | Increase |
| I don't have anyone to go with | 1.46 | 2.14 | +0.68 | Increase |
| The opening hours are inconvenient | 3.03 | 4.67 | +1.64 | Increase |
| I don't need to use library services | 32.79 | 32.49 | −0.29 | No Change |
| I'm worried about having to pay library fines | 1.15 | 1.38 | +0.24 | Increase |
| Some other reason | 0.99 | 0.98 | −0.01 | No Change |
| No reason in particular | 19.19 | 20.26 | +1.07 | Increase |
Weighted percentages among physical library nonusers aged 16+ in England. Multiple responses; no summing. Change labels reproduced from DCMS. Exact 95% bounds in CSV.
Scroll horizontally to see all columns.
| Reason | 2023/24 (%) | 2024/25 (%) | Change (pp) | Official label |
|---|---|---|---|---|
| I cannot afford it | 1.63 | 1.66 | +0.03 | No Change |
| It is not value for money | 0.29 | 0.32 | +0.03 | No Change |
| I'm not interested | 27.59 | 26.88 | −0.71 | No Change |
| I don't have time | 10.66 | 10.18 | −0.48 | No Change |
| I have a health problem or disability | 3.68 | 3.74 | +0.06 | No Change |
| I don't know what is available | 9.12 | 10.11 | +1.00 | Increase |
| I don't have access to the internet | 1.91 | 1.80 | −0.11 | No Change |
| I don't have access to an online device such as a smartphone, laptop or tablet | 1.71 | 1.61 | −0.10 | No Change |
| I don't need to use library services | 27.28 | 27.80 | +0.53 | No Change |
| I'm worried about having to pay library fines | 0.60 | 0.72 | +0.12 | No Change |
| I don't know how to access library services digitally or online | 5.86 | 5.91 | +0.05 | No Change |
| Some other reason | 1.39 | 1.15 | −0.23 | Decrease |
| No reason in particular | 26.10 | 27.39 | +1.29 | Increase |
Weighted percentages among digital library nonusers aged 16+ in England. Multiple responses; no summing. Change labels reproduced from DCMS. Exact 95% bounds in CSV.
Evidence & method
How we calculated it
- Secondary descriptive analysis of DCMS B1/B3 common-option profiles for 2023/24–2024/25; original C1/C4 and newer K1/K4 checked.
- England adults 16+ in private households; separate physical/digital nonuser populations and preceding-12-month questions.
- Weighted estimates and exact published 95% bounds retained; counts/bases unweighted. Multiple responses are not additive.
- Published change labels retained under official nonoverlapping-95%-interval rule. Largest movement selected after inspection; no new tests.
- 55 estimate rows and 27 point differences independently checked. The newer 2025/26 release is contextual, not merged into an unchanged series.
What the data cannot tell us
- Physical COVID response removed after 2023/24; no later zero imputed. Historical digital cost-label discrepancy documented.
- Mode-specific populations overlap by an unknown amount. No paired, cross-mode or causal inference; no sums into unique-person totals.
- Paper routing and report-caption discrepancies are disclosed; core does not mean unconditional.
- No documented multiplicity correction; No Change does not prove equality. Survey response and measurement error remain.
- Library services are broader than reading; no book, genre, demand, intervention or policy-effect estimate.
Original sources
- DCMS Participation Survey 2024/25 annual tables, v4
DCMS Participation Survey 2024/25 annual tables, v4: Tables B1 and B3; weighted estimates, published 95% bounds, unweighted counts and bases, and official year-change labels.
Accessed October 30, 2026
- DCMS Participation Survey 2023/24 annual tables, revised March 2025
DCMS Participation Survey 2023/24 annual tables, revised March 2025: Tables C1 and C4; original COVID response and historical label crosscheck. C4 row 31 label discrepancy documented.
Accessed October 30, 2026
- Participation Survey 2024/25 online questionnaire
Participation Survey 2024/25 online questionnaire: CNLIWHYA and CNLIWHYAD, core multiple-response nonuse questions; COVID response absent.
Accessed October 30, 2026
- Participation Survey 2023/24 online questionnaire
Participation Survey 2023/24 online questionnaire: Q058/CNLIWHYA and Q063/CNLIWHYAD; physical COVID option; digital cost wording.
Accessed October 30, 2026
- Participation Survey 2024/25 paper questionnaire
Participation Survey 2024/25 paper questionnaire: Physical Q15 to Q19; digital Q20 and Q23 condition Q24. Printed pages 7–9.
Accessed October 30, 2026
- Participation Survey 2023/24 paper questionnaire
Participation Survey 2023/24 paper questionnaire: Physical Q21 to Q24; digital Q25 and Q28 condition Q29. Printed pages 12–14.
Accessed October 30, 2026
- Participation Survey 2024/25 main report
Participation Survey 2024/25 main report: Historical national context, background methods and nonoverlapping-95%-interval significance rule; Crown/OGL notice.
Accessed October 30, 2026
- Participation Survey 2024/25 technical report
Participation Survey 2024/25 technical report: Sample size, weighting, paper routing edits; cited paper question numbers differ from linked instrument.
Accessed October 30, 2026
- Participation Survey 2023/24 technical report
Participation Survey 2023/24 technical report: Expanded annual sample and survey methods.
Accessed October 30, 2026
- Community and Engagement Survey 2025/26 libraries tables
Community and Engagement Survey 2025/26 libraries tables: K1/K4 used for vintage audit only; Notes 8 and 11, new response and Community paper omission.
Accessed October 30, 2026
- Community and Engagement Survey 2025/26 libraries release
Community and Engagement Survey 2025/26 libraries release: Published 31 July 2026; report correction 22 October 2026, data unchanged.
Accessed October 30, 2026
- Community and Engagement Survey 2025/26 libraries report
Community and Engagement Survey 2025/26 libraries report: Newer-release context only; Figure 6 broad base caption does not replace nonuser routing.
Accessed October 30, 2026
- Community and Engagement Survey 2025/26 background and methodology
Community and Engagement Survey 2025/26 background and methodology: Successor-survey transition, two fieldwork periods, comparability guidance and OGL notice.
Accessed October 30, 2026
- Community and Engagement Survey 2025/26 technical report
Community and Engagement Survey 2025/26 technical report: Pathway structure and paper processing; contextual audit, not primary comparison.
Accessed October 30, 2026
- Community and Engagement Survey 2025/26 online questionnaire
Community and Engagement Survey 2025/26 online questionnaire: Engagement-pathway nonuser routing and added preference-for-other-activities response.
Accessed October 30, 2026
- The National Archives, Open Government Licence v3.0
The National Archives, Open Government Licence v3.0: Source attribution, reuse permission and exclusions; no endorsement or third-party rights conferred.
Accessed October 30, 2026
Cite & reuse this study
Alisson Bento. Why library nonusers stayed away: physical and digital profiles in England. Secondary analysis of DCMS Participation Survey, 2023/24–2024/25, Tables B1/B3 with original C1/C4 checks. Sources accessed 30 October 2026. https://alissonbento.com/research/england-library-nonuser-barriers-2024-25/
Source: DCMS Participation Survey, © Crown copyright. Contains public sector information licensed under the Open Government Licence v3.0, https://www.nationalarchives.gov.uk/doc/open-government-licence/version/3/. Selection, calculations and explanation: Alisson Bento. Adapted presentation and documented historical label crosswalk; no official endorsement, logos or CACI fields.
Corrections or editorial questions