A comparison that does not need a complete ranking
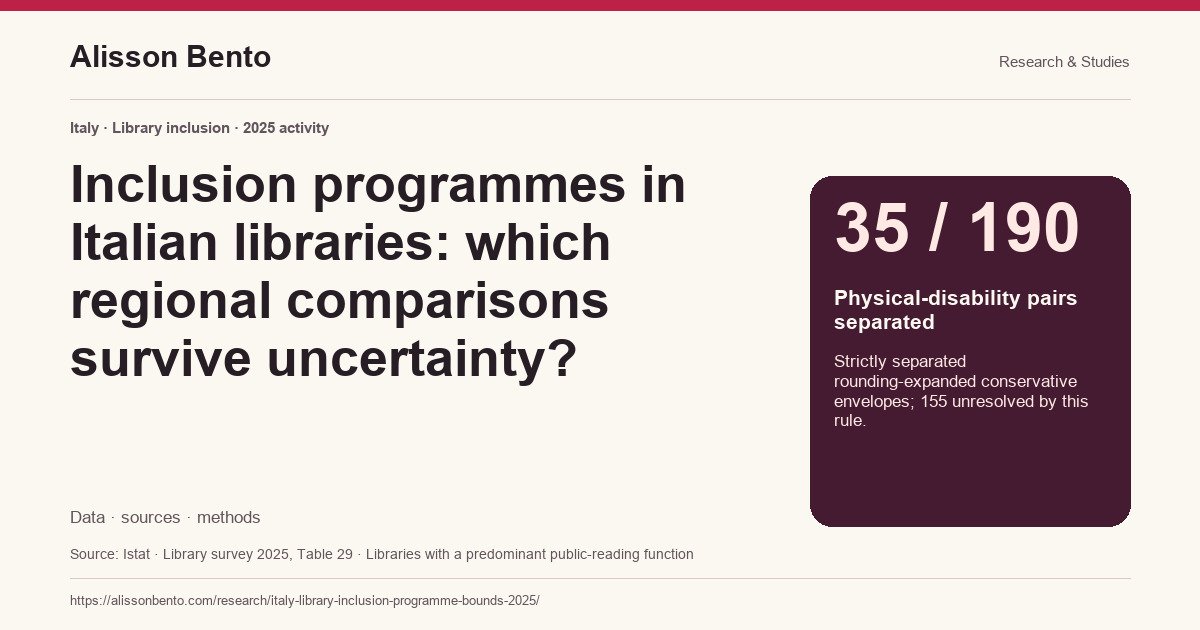
Some regional differences in disability-targeted library programmes remain visible even when we refuse to guess how autonomous and collaborative provision overlap, or whether libraries with unknown information offered a programme. Across Italy's twenty regions, a conservative comparison rule retains a direction for 35 of 190 regional pairs for programmes targeting physical disability. For the separate category covering sensory or emotional disabilities and/or cognitive disorders, it retains a direction for 37 pairs. These are results of a transparent logical rule, not significance tests or a ranking of accessibility.
The evidence comes from Istat's library survey for reference year 2025. The relevant population is the 6,252 libraries whose predominant function is public reading. Within that population, the analysis asks which comparisons remain separated after allowing uncertainty rather than replacing it with a convenient single number. It leaves 155 physical-disability comparisons and 153 comparisons for sensory or emotional disabilities and/or cognitive disorders unresolved by the selected rule. That restraint is part of the finding: most pairs do not support a directional statement under this deliberately conservative approach.
The question is narrow. It concerns the share of libraries that realised a targeted activity or project during the year, not the number of participants, the usefulness of those activities, or the quality of a library's wider services. A direction in this analysis means that one region's conservative lower boundary exceeds another's upper boundary under the stated coding and rounding assumptions. It does not mean that the first region provides a better experience to every person who needs support.
What counts as a targeted programme
Question 37 asks whether the library realised inclusion activities or projects for specified categories of users during 2025. This analysis retains two categories separately: people with physical disabilities, and people with sensory or emotional disabilities and/or cognitive disorders. The second is a combined source category. Its published percentage cannot be separated into sensory, emotional and cognitive components, and those components should not be ranked or compared as if the table supplied separate observations.
For each category, the questionnaire offers an autonomous mode, a formally collaborative mode and a ‘No’ option. The completion guide explains autonomous provision as activities organised directly with the library's own resources and staff. Formal collaboration involves a partnership or network with other libraries, public or private bodies, associations, or cultural or social institutions. These descriptions identify organisational modes. They do not measure programme duration, intensity, staff expertise, attendance or outcomes, and they do not establish that one mode is more effective than another.
Importantly, libraries that carried out activities in both modes are instructed to select both affirmative responses. A library can therefore contribute to both mode percentages. The guide defines no as having carried out no activity or project for the specified category, neither autonomously nor in partnership. This definition makes no incompatible with either affirmative mode. That documented distinction is the basis of the calculation. Istat’s Table 29 nevertheless presents the four response columns for each category as summing to 100 within rounding, with an explicit total column of 100, and neither its footnote nor the methodology note says how a library that selected both modes is classified there. The analysis therefore never adds the two mode percentages and uses only bounds that hold whether or not the published modes overlap.
The population is defined by function, not ownership
The survey's overall published frame contains 8,883 eligible libraries open to the public in 2025. It includes public and private ownership and several predominant functions. Of those libraries, 6,252 have public reading as their predominant function. The inclusion-programme question is routed specifically to that function. Its denominator is consequently not all libraries, and it is not the set of publicly owned libraries. A privately owned library can have a public-reading function, while a publicly owned library can primarily specialise in another function.
The distinction matters geographically because the composition of library functions differs between regions. In Table 3, Piemonte has 690 public-reading libraries within 890 libraries overall. Umbria has 69 within 125. The library is the unit counted in both cases: these are not counts of municipalities, service locations weighted by population, users or residents with disabilities. Regional comparisons give each eligible library a place in its region's denominator. They do not estimate the probability that a resident can reach or use a suitable service.
All twenty regional rows are retained. Trentino-Alto Adige is included as a region, while Bolzano and Trento are not additionally counted as independent regions. Adding those province rows alongside their containing region would duplicate territory and libraries. The regional public-reading frame counts sum to the national 6,252. Italy's aggregate is kept separate from the twenty-region pairwise analysis rather than treated as a twenty-first comparable region.
Why an equipment comparison would answer a different question
The same release includes information on places equipped for people with motor disabilities and on physical or communication supports. These are useful measures, but their published regional margins refer to all library functions. The inclusion-programme margins refer only to public-reading-function libraries. Their apparent numerical proximity or distance cannot therefore be interpreted as a gap between equipment and programming within the same library population. The relevant equipment numerator restricted to public-reading libraries is not supplied by those regional tables.
Knowing the two regional population totals does not solve that problem. Dividing an equipment numerator from all functions by the smaller public-reading denominator would assign equipment from other library functions to the wrong population. Multiplying an all-function percentage by the public-reading share would instead assume an allocation that is not observed. Public ownership is not a substitute restriction, because ownership and predominant function are different classifications in the source. No equipment-versus-programme percentage-point comparison is made here.
Nor would a common denominator, by itself, identify whether the same library had a particular piece of equipment and offered a programme. Separate margins do not reveal joint provision. This article consequently concentrates on the programme question alone and does not present an accessibility score. Availability of a ramp, a special reading place or a targeted activity is not a certificate of legal compliance or complete accessibility. Each describes only a particular reported feature of a broader service environment.
Building a conservative envelope
Let A denote the published percentage reporting autonomous projects for one target category, C the percentage reporting formal collaboration, and N the percentage reporting no project. At least the larger of A and C must belong to the group offering a project in either mode: every library in either affirmative category is an offerer. A conservative lower boundary is therefore the maximum of the two mode percentages. This calculation never adds them and never assumes that their memberships are disjoint.
At the other end, a library reporting no project cannot belong to that offering group under the guide's definition. A conservative upper boundary is therefore one hundred minus N. This upper boundary allows every library with unknown information to have offered a project. The lower boundary does not require those unknowns to offer anything. Taken together, the two boundaries leave missing information unresolved rather than transforming it into either confirmed absence or confirmed provision. Both boundaries concern the same target category and eligible library population.
The envelope is deliberately conservative, not a claim to the narrowest mathematically possible interval. Additional assumptions about completeness, response categories or published mode processing could potentially tighten it. This analysis does not need those assumptions to establish its retained comparisons. Its count of separated pairs should therefore be read as the result of this particular transparent rule, not as proof that every remaining pair would be impossible to order with better information or a different justified analysis.
Rounding and the meaning of separation
The published percentages are rounded to one decimal place. Before comparing regions, this analysis expands each lower boundary downward by 0.05 percentage points and each upper boundary upward by 0.05, clipping the result to the possible range from zero to one hundred. This is a conservative closed expansion under conventional rounding to the nearest tenth. Istat documents automatic rounding but does not specify the treatment of exact ties, so the rounding model is stated rather than hidden inside the calculation.
For each pair of regions, a direction is retained only if one expanded lower boundary is strictly above the other expanded upper boundary. Touching boundaries are not enough. Neither are overlapping intervals with different midpoints. The rule does not choose a midpoint as a best estimate, assign probabilities to values inside the envelope, or assume that wider envelopes are normally distributed. A broad envelope represents unresolved information under the selected assumptions, not a standard error.
These are deterministic logical and rounding envelopes, not confidence intervals. Separation does not mean statistical significance, and nonseparation does not establish equality. The rule concerns feasibility given the reported categories and their interpretation. It does not account for every possible reporting error, missing library or frame limitation. In particular, a census-style survey does not become error-free simply because the calculation does not use sampling confidence intervals.
Physical-disability programmes: an illustrative separated pair
Umbria reports 5.8% autonomous projects and 27.5% formal collaboration for people with physical disabilities, with 66.7% reporting no project. Its conservative envelope before rounding expansion is therefore 27.5% to 33.3%. Piemonte reports 4.6% autonomous provision, 11.2% collaboration and 82.6% no project, producing an envelope of 11.2% to 17.4%. The comparison does not require knowing exactly how many libraries in either region selected both affirmative modes.
After expansion, Umbria's lower boundary is 27.45% and Piemonte's upper boundary is 17.45%. The boundaries remain separated by 10.00 percentage points. This establishes a direction under the stated conservative rule, not an exact ten-point difference between actual provision rates. The underlying difference could be larger within the envelopes. The calculation also does not establish that all Umbrian libraries offer programmes or that a particular library in Piemonte lacks them; those would be different, unsupported statements.
This pair is an illustration selected after the complete regional inspection, not a preselected hypothesis. The analysis checks all 190 unordered pairs among the twenty regions and publishes every check. Thirty-five physical-disability pairs meet the strict separation condition, while 155 do not. Reporting the full set prevents the illustrative comparison from being mistaken for a comprehensive national ranking or for a result chosen without examining alternatives.
A separate result for the combined category of sensory or emotional disabilities and/or cognitive disorders
For the combined category of sensory or emotional disabilities and/or cognitive disorders, Umbria reports 13.0% autonomous programmes and 31.9% formal collaboration, with 55.1% reporting no programme. Its conservative envelope is 31.9% to 44.9% before rounding expansion. Liguria reports 4.9% autonomous provision, 9.8% collaboration and 84.6% no project, yielding 9.8% to 15.4%. The expanded lower boundary for Umbria is 31.85%, above Liguria's expanded upper boundary of 15.45%.
The separation between those boundaries is 16.40 percentage points. Again, this is a minimum separation between the selected envelopes, not an estimated programme effect or an exact difference in underlying service quality. This pair was chosen for explanation after all regions were inspected. The full comparison retains directions for 37 of 190 pairs and leaves 153 unresolved by the same conservative rule. The method is identical to the physical-disability analysis, but the target category is different.
The two sets of results must not be added to estimate the share offering any disability-related inclusion programme. A library can serve both categories, and the published margins do not identify that overlap. Likewise, adding the 35 and 37 pair totals would not produce a count of distinct regional relationships across all inclusion needs: the same regional pair may appear in both. Separate targets remain separate throughout the tables, calculations and interpretation.
Unknown information changes what can responsibly be compared
Unknown and nonresponse information is substantial in some places. For the selected programme categories, Trentino-Alto Adige has a published unknown share of 40.6%. Its physical-disability envelope runs from 8.9% to 53.3% before rounding expansion. The width should not be presented as evidence that provision itself varies within the region over that range. It represents what this conservative calculation leaves unresolved when it does not decide the status of libraries with missing programme information.
The methodology gives an important reason to avoid treating all missingness as refusal. In Bolzano, 88 of the 269 libraries in the overall library frame completed the Istat online questionnaire; information for other libraries came from provincial monitoring using a nonidentical questionnaire. Istat recorded variables absent from that monitoring as unavailable. The published unknown share for the selected programme categories in Bolzano is 62.4%. These province details explain a source-coverage issue; they are not extra observations added to the regional comparisons.
The analysis neither removes the region to obtain a cleaner ranking nor calls all unknown libraries nonproviders. Omitting difficult rows would change the question, while recoding unknowns would assert knowledge the data do not provide. Retaining all twenty regions with their respective envelopes makes the limitation visible. A future release with more complete information could narrow some intervals and retain additional comparisons without any actual change in programme provision.
What the survey establishes, and what it leaves open
The reference year is 2025; collection took place between March and July 2026, and the tables were released in October 2026. The results describe reported activity during the reference year, not a live inventory of programmes available today. The census-style survey covers eligible public and private libraries open to external users and excludes school and university libraries, alongside other specified ineligible institutions. A statement about these libraries is not automatically a statement about every institution where reading or support activities occur.
The initial list contained 9,963 units, of which 265 remained unresolved. The methodology's 97.3% response or resolution measure includes resolved ineligible units. It must not be confused with the completion rate for the inclusion-project question. Coverage, reporting and item-information limitations remain relevant even after the eligible open-library frame is established. The envelopes handle selected uncertainties in programme overlap, unknown status and rounding; they do not pretend to remove all those broader limitations.
No attendance counts, participant characteristics, frequency of sessions, service capacity or independent outcome assessments are used here. A reported project does not prove that it met all relevant needs, and no project does not prove that a library supplied no useful support in other ways. The analysis cannot establish unmet demand, financial causes, staff effects, benefits to reading, or barriers experienced by a particular person. Those questions require additional evidence with different units and measures.
A reproducible partial comparison rather than a score
The public aggregate files preserve each selected source percentage or symbol, its table and cell, its target category and its eligible population. A separate regional denominator file distinguishes all library functions from the public-reading subset. The programme calculation uses only the correctly restricted programme margins. Its outputs include forty region-by-target envelopes and all 380 pair checks, with strict directional decisions and their boundary separations. This allows readers to inspect results that are not highlighted in the narrative.
The arithmetic was also checked independently. A second procedure reads the workbook's underlying XML rather than relying on the extraction library and performs comparisons using integer hundredths of a percentage point. It reproduces the 35 and 37 retained-pair counts and checks the extracted source values. Such reproducibility verifies the implementation of the stated rule; it does not turn the rule into a causal model or resolve information that was never published.
The central result is a limited but useful one: some regional comparisons of targeted organised inclusion survive a refusal to guess unknown status or programme-mode overlap. Many others remain unresolved under the same rule. Keeping those two statements together provides a more faithful account than a league table built from added modes or missing values treated as absence. It also keeps organised activity distinct from equipment, legal compliance and users' lived experience of accessibility, each of which deserves its own evidence.
Inclusion projects: physical disability
Italy · 6,252 libraries with predominant public-reading function · Activity in 2025; collection in 2026. Logical / rounding bounds — NOT confidence intervals. 35 of 190 region pairs have strictly separated envelopes under this rule.
Full chart and source

Scroll horizontally to inspect the chart. ↔
Chart and values
Scroll horizontally to see all columns.
| Region | Eligible frame N | Autonomous (%) | Collaborative (%) | No project (%) | Unknown (%) | Expanded lower (%) | Expanded upper (%) |
|---|---|---|---|---|---|---|---|
| Piemonte | 690 | 4.6 | 11.2 | 82.6 | 1.6 | 11.15 | 17.45 |
| Valle d'Aosta - Vallée d'Aoste | 50 | 0 | 8 | 92 | 0 | 7.95 | 8.05 |
| Lombardia | 1321 | 4.9 | 12 | 81.2 | 1.9 | 11.95 | 18.85 |
| Trentino-Alto Adige | 360 | 3.9 | 8.9 | 46.7 | 40.6 | 8.85 | 53.35 |
| Veneto | 560 | 6.4 | 13 | 78.9 | 1.6 | 12.95 | 21.15 |
| Friuli-Venezia Giulia | 220 | 8.6 | 10.9 | 79.5 | 0.9 | 10.85 | 20.55 |
| Liguria | 143 | 9.1 | 9.1 | 81.1 | 0.7 | 9.05 | 18.95 |
| Emilia-Romagna | 410 | 6.1 | 10.5 | 82.4 | 1 | 10.45 | 17.65 |
| Toscana | 275 | 8.7 | 14.2 | 74.2 | 2.9 | 14.15 | 25.85 |
| Umbria | 69 | 5.8 | 27.5 | 66.7 | 0 | 27.45 | 33.35 |
| Marche | 160 | 4.4 | 11.9 | 76.9 | 6.9 | 11.85 | 23.15 |
| Lazio | 274 | 8 | 15 | 71.9 | 5.1 | 14.95 | 28.15 |
| Abruzzo | 100 | 7 | 8 | 72 | 13 | 7.95 | 28.05 |
| Molise | 37 | 8.1 | 8.1 | 81.1 | 2.7 | 8.05 | 18.95 |
| Campania | 338 | 9.5 | 14.8 | 56.8 | 18.9 | 14.75 | 43.25 |
| Puglia | 222 | 9.9 | 23 | 54.1 | 13.1 | 22.95 | 45.95 |
| Basilicata | 77 | 7.8 | 9.1 | 61 | 22.1 | 9.05 | 39.05 |
| Calabria | 200 | 8 | 9.5 | 64 | 18.5 | 9.45 | 36.05 |
| Sicilia | 353 | 8.5 | 9.1 | 71.4 | 11 | 9.05 | 28.65 |
| Sardegna | 393 | 6.4 | 13.2 | 79.9 | 0.5 | 13.15 | 20.15 |
Percent of public-reading-function libraries. Autonomous and collaborative modes can overlap. Unknown is not No. Expanded endpoints allow ±0.05 percentage points for conventional nearest-tenth rounding; deterministic conservative envelopes, not confidence intervals.

Inclusion projects: sensory/emotional disabilities and/or cognitive disorders
Italy · 6,252 libraries with predominant public-reading function · Activity in 2025; collection in 2026. Logical / rounding bounds — NOT confidence intervals. 37 of 190 region pairs have strictly separated envelopes under this rule.
Full chart and source

Scroll horizontally to inspect the chart. ↔
Chart and values
Scroll horizontally to see all columns.
| Region | Eligible frame N | Autonomous (%) | Collaborative (%) | No project (%) | Unknown (%) | Expanded lower (%) | Expanded upper (%) |
|---|---|---|---|---|---|---|---|
| Piemonte | 690 | 6.1 | 16.7 | 75.7 | 1.6 | 16.65 | 24.35 |
| Valle d'Aosta - Vallée d'Aoste | 50 | 4 | 14 | 82 | 0 | 13.95 | 18.05 |
| Lombardia | 1321 | 5.9 | 16.5 | 75.7 | 1.9 | 16.45 | 24.35 |
| Trentino-Alto Adige | 360 | 3.9 | 10.3 | 45.3 | 40.6 | 10.25 | 54.75 |
| Veneto | 560 | 7.7 | 15.7 | 75 | 1.6 | 15.65 | 25.05 |
| Friuli-Venezia Giulia | 220 | 5.9 | 13.2 | 80 | 0.9 | 13.15 | 20.05 |
| Liguria | 143 | 4.9 | 9.8 | 84.6 | 0.7 | 9.75 | 15.45 |
| Emilia-Romagna | 410 | 7.3 | 19 | 72.7 | 1 | 18.95 | 27.35 |
| Toscana | 275 | 9.8 | 18.2 | 69.1 | 2.9 | 18.15 | 30.95 |
| Umbria | 69 | 13 | 31.9 | 55.1 | 0 | 31.85 | 44.95 |
| Marche | 160 | 3.8 | 18.8 | 70.6 | 6.9 | 18.75 | 29.45 |
| Lazio | 274 | 12 | 16.8 | 66.1 | 5.1 | 16.75 | 33.95 |
| Abruzzo | 100 | 6 | 10 | 71 | 13 | 9.95 | 29.05 |
| Molise | 37 | 5.4 | 8.1 | 83.8 | 2.7 | 8.05 | 16.25 |
| Campania | 338 | 5.9 | 12.4 | 62.7 | 18.9 | 12.35 | 37.35 |
| Puglia | 222 | 9.5 | 26.1 | 51.4 | 13.1 | 26.05 | 48.65 |
| Basilicata | 77 | 9.1 | 6.5 | 62.3 | 22.1 | 9.05 | 37.75 |
| Calabria | 200 | 7.5 | 10 | 64 | 18.5 | 9.95 | 36.05 |
| Sicilia | 353 | 10.8 | 8.8 | 69.4 | 11 | 10.75 | 30.65 |
| Sardegna | 393 | 8.1 | 13 | 78.4 | 0.5 | 12.95 | 21.65 |
Percent of public-reading-function libraries. Autonomous and collaborative modes can overlap. Unknown is not No. Expanded endpoints allow ±0.05 percentage points for conventional nearest-tenth rounding; deterministic conservative envelopes, not confidence intervals.

Data & downloads
Scroll horizontally to see all columns.
| Region | Eligible frame N | Autonomous (%) | Collaborative (%) | No project (%) | Unknown (%) | Expanded lower (%) | Expanded upper (%) |
|---|---|---|---|---|---|---|---|
| Piemonte | 690 | 4.6 | 11.2 | 82.6 | 1.6 | 11.15 | 17.45 |
| Valle d'Aosta - Vallée d'Aoste | 50 | 0 | 8 | 92 | 0 | 7.95 | 8.05 |
| Lombardia | 1321 | 4.9 | 12 | 81.2 | 1.9 | 11.95 | 18.85 |
| Trentino-Alto Adige | 360 | 3.9 | 8.9 | 46.7 | 40.6 | 8.85 | 53.35 |
| Veneto | 560 | 6.4 | 13 | 78.9 | 1.6 | 12.95 | 21.15 |
| Friuli-Venezia Giulia | 220 | 8.6 | 10.9 | 79.5 | 0.9 | 10.85 | 20.55 |
| Liguria | 143 | 9.1 | 9.1 | 81.1 | 0.7 | 9.05 | 18.95 |
| Emilia-Romagna | 410 | 6.1 | 10.5 | 82.4 | 1 | 10.45 | 17.65 |
| Toscana | 275 | 8.7 | 14.2 | 74.2 | 2.9 | 14.15 | 25.85 |
| Umbria | 69 | 5.8 | 27.5 | 66.7 | 0 | 27.45 | 33.35 |
| Marche | 160 | 4.4 | 11.9 | 76.9 | 6.9 | 11.85 | 23.15 |
| Lazio | 274 | 8 | 15 | 71.9 | 5.1 | 14.95 | 28.15 |
| Abruzzo | 100 | 7 | 8 | 72 | 13 | 7.95 | 28.05 |
| Molise | 37 | 8.1 | 8.1 | 81.1 | 2.7 | 8.05 | 18.95 |
| Campania | 338 | 9.5 | 14.8 | 56.8 | 18.9 | 14.75 | 43.25 |
| Puglia | 222 | 9.9 | 23 | 54.1 | 13.1 | 22.95 | 45.95 |
| Basilicata | 77 | 7.8 | 9.1 | 61 | 22.1 | 9.05 | 39.05 |
| Calabria | 200 | 8 | 9.5 | 64 | 18.5 | 9.45 | 36.05 |
| Sicilia | 353 | 8.5 | 9.1 | 71.4 | 11 | 9.05 | 28.65 |
| Sardegna | 393 | 6.4 | 13.2 | 79.9 | 0.5 | 13.15 | 20.15 |
Percent of public-reading-function libraries. Autonomous and collaborative modes can overlap. Unknown is not No. Expanded endpoints allow ±0.05 percentage points for conventional nearest-tenth rounding; deterministic conservative envelopes, not confidence intervals.
Scroll horizontally to see all columns.
| Region | Eligible frame N | Autonomous (%) | Collaborative (%) | No project (%) | Unknown (%) | Expanded lower (%) | Expanded upper (%) |
|---|---|---|---|---|---|---|---|
| Piemonte | 690 | 6.1 | 16.7 | 75.7 | 1.6 | 16.65 | 24.35 |
| Valle d'Aosta - Vallée d'Aoste | 50 | 4 | 14 | 82 | 0 | 13.95 | 18.05 |
| Lombardia | 1321 | 5.9 | 16.5 | 75.7 | 1.9 | 16.45 | 24.35 |
| Trentino-Alto Adige | 360 | 3.9 | 10.3 | 45.3 | 40.6 | 10.25 | 54.75 |
| Veneto | 560 | 7.7 | 15.7 | 75 | 1.6 | 15.65 | 25.05 |
| Friuli-Venezia Giulia | 220 | 5.9 | 13.2 | 80 | 0.9 | 13.15 | 20.05 |
| Liguria | 143 | 4.9 | 9.8 | 84.6 | 0.7 | 9.75 | 15.45 |
| Emilia-Romagna | 410 | 7.3 | 19 | 72.7 | 1 | 18.95 | 27.35 |
| Toscana | 275 | 9.8 | 18.2 | 69.1 | 2.9 | 18.15 | 30.95 |
| Umbria | 69 | 13 | 31.9 | 55.1 | 0 | 31.85 | 44.95 |
| Marche | 160 | 3.8 | 18.8 | 70.6 | 6.9 | 18.75 | 29.45 |
| Lazio | 274 | 12 | 16.8 | 66.1 | 5.1 | 16.75 | 33.95 |
| Abruzzo | 100 | 6 | 10 | 71 | 13 | 9.95 | 29.05 |
| Molise | 37 | 5.4 | 8.1 | 83.8 | 2.7 | 8.05 | 16.25 |
| Campania | 338 | 5.9 | 12.4 | 62.7 | 18.9 | 12.35 | 37.35 |
| Puglia | 222 | 9.5 | 26.1 | 51.4 | 13.1 | 26.05 | 48.65 |
| Basilicata | 77 | 9.1 | 6.5 | 62.3 | 22.1 | 9.05 | 37.75 |
| Calabria | 200 | 7.5 | 10 | 64 | 18.5 | 9.95 | 36.05 |
| Sicilia | 353 | 10.8 | 8.8 | 69.4 | 11 | 10.75 | 30.65 |
| Sardegna | 393 | 8.1 | 13 | 78.4 | 0.5 | 12.95 | 21.65 |
Percent of public-reading-function libraries. Autonomous and collaborative modes can overlap. Unknown is not No. Expanded endpoints allow ±0.05 percentage points for conventional nearest-tenth rounding; deterministic conservative envelopes, not confidence intervals.
Evidence & method
How we calculated it
- Secondary exploratory analysis of Istat 2025 library Table 29; Q37 eligibility is predominant public-reading function, established by Q15=1 routing. Table 3 supplies frame counts.
- The guide defines No as no activity in either programme mode and allows both affirmative responses. For each target separately, lower=max(autonomous, collaborative); upper=100−No. Unknown status is unresolved.
- Expand lower downward and upper upward by 0.05 percentage points under conventional nearest-tenth rounding, clipped to 0–100. Strict separation alone retains a direction. These are conservative logical envelopes, not confidence intervals or sharp identified sets.
- All 20 regions and all 190 unordered pairs per target are included. Pair selection for narrative illustration is exploratory after complete inspection.
- Source cells independently checked via workbook ZIP/XML; integer-hundredths calculations reproduce 35 and 37 retained pairs. Public standard-library code reproduces all envelopes and pair decisions.
What the data cannot tell us
- The original equipment-versus-programme comparison is not made: all-library equipment margins cannot be restricted to public-reading function using population counts alone.
- Bounds are conditional on documented category meaning and the stated rounding model, not guarantees against reporting or frame error; no statistical significance or causal interpretation.
- Unknown is not absence; regional information completeness differs, including provincial data integration in Bolzano. Unresolved pairs are not equality and may become orderable with more information.
- No programme-mode overlap estimate, cross-target union, joint equipment provision, service quality, legal compliance, complete accessibility, realised access or demand is inferred. The published Table 29 response columns sum to 100 and do not document how libraries selecting both modes are classified, so the modes are never added.
Original sources
- Istat library survey 2025 release
Istat library survey 2025 release: Reference year 2025; released 12 October 2026.
Accessed October 30, 2026
- Istat 2025 library tables
Istat 2025 library tables: Table 3 library-function bases; Tables 9 and 28 equipment universe audit; Table 29 disability-targeted inclusion projects. Table 29, cell G5, one combined category: “Persone con disabilità sensoriale, emotiva e/o con disturbi cognitivi” — sensory or emotional disabilities and/or cognitive disorders. No separate component estimates are available.
Accessed October 30, 2026
- Istat library methodology
Istat library methodology: Census-style collection March–July 2026; coverage and nonresponse; Bolzano data integration; symbols and rounding.
Accessed October 30, 2026
- Istat official questionnaire
Istat official questionnaire: Printed p16: Q35 for all functions, Q37 only Q15=1 public-reading function; both affirmative programme modes may be selected.
Accessed October 30, 2026
- Istat completion guide
Istat completion guide: Printed p24 / PDF page25: Q37 No means no activity in either mode; libraries with both modes select both.
Accessed October 30, 2026
- Istat legal and reuse terms
Istat legal and reuse terms: Default CC BY 4.0, attribution and modification disclosure; no logo or third-party rights conveyed.
Accessed October 30, 2026
Cite & reuse this study
Alisson Bento. Inclusion programmes in Italian libraries: which regional comparisons survive uncertainty? Secondary analysis of Istat, Indagine sulle biblioteche pubbliche e private, reference year 2025, Table 29 and Table 3. Sources accessed October 30, 2026. https://alissonbento.com/research/italy-library-inclusion-programme-bounds-2025/
Source: Istat, Indagine sulle biblioteche pubbliche e private, reference year 2025, collection 2026, Tables 3 and 29; equipment-universe audit Tables 9 and 28. CC BY 4.0, https://creativecommons.org/licenses/by/4.0/. Selection, English labels, calculations and presentation adapted by Alisson Bento; no Istat endorsement or logo rights implied.
Corrections or editorial questions