
What the comparison shows
Statistics about Canadian books can describe the nationality assigned to a book’s authorship, the country controlling a publishing business, or the destination of a publisher’s sale. These are different dimensions. Treating them as interchangeable can turn a correct number into an incorrect account of the market.
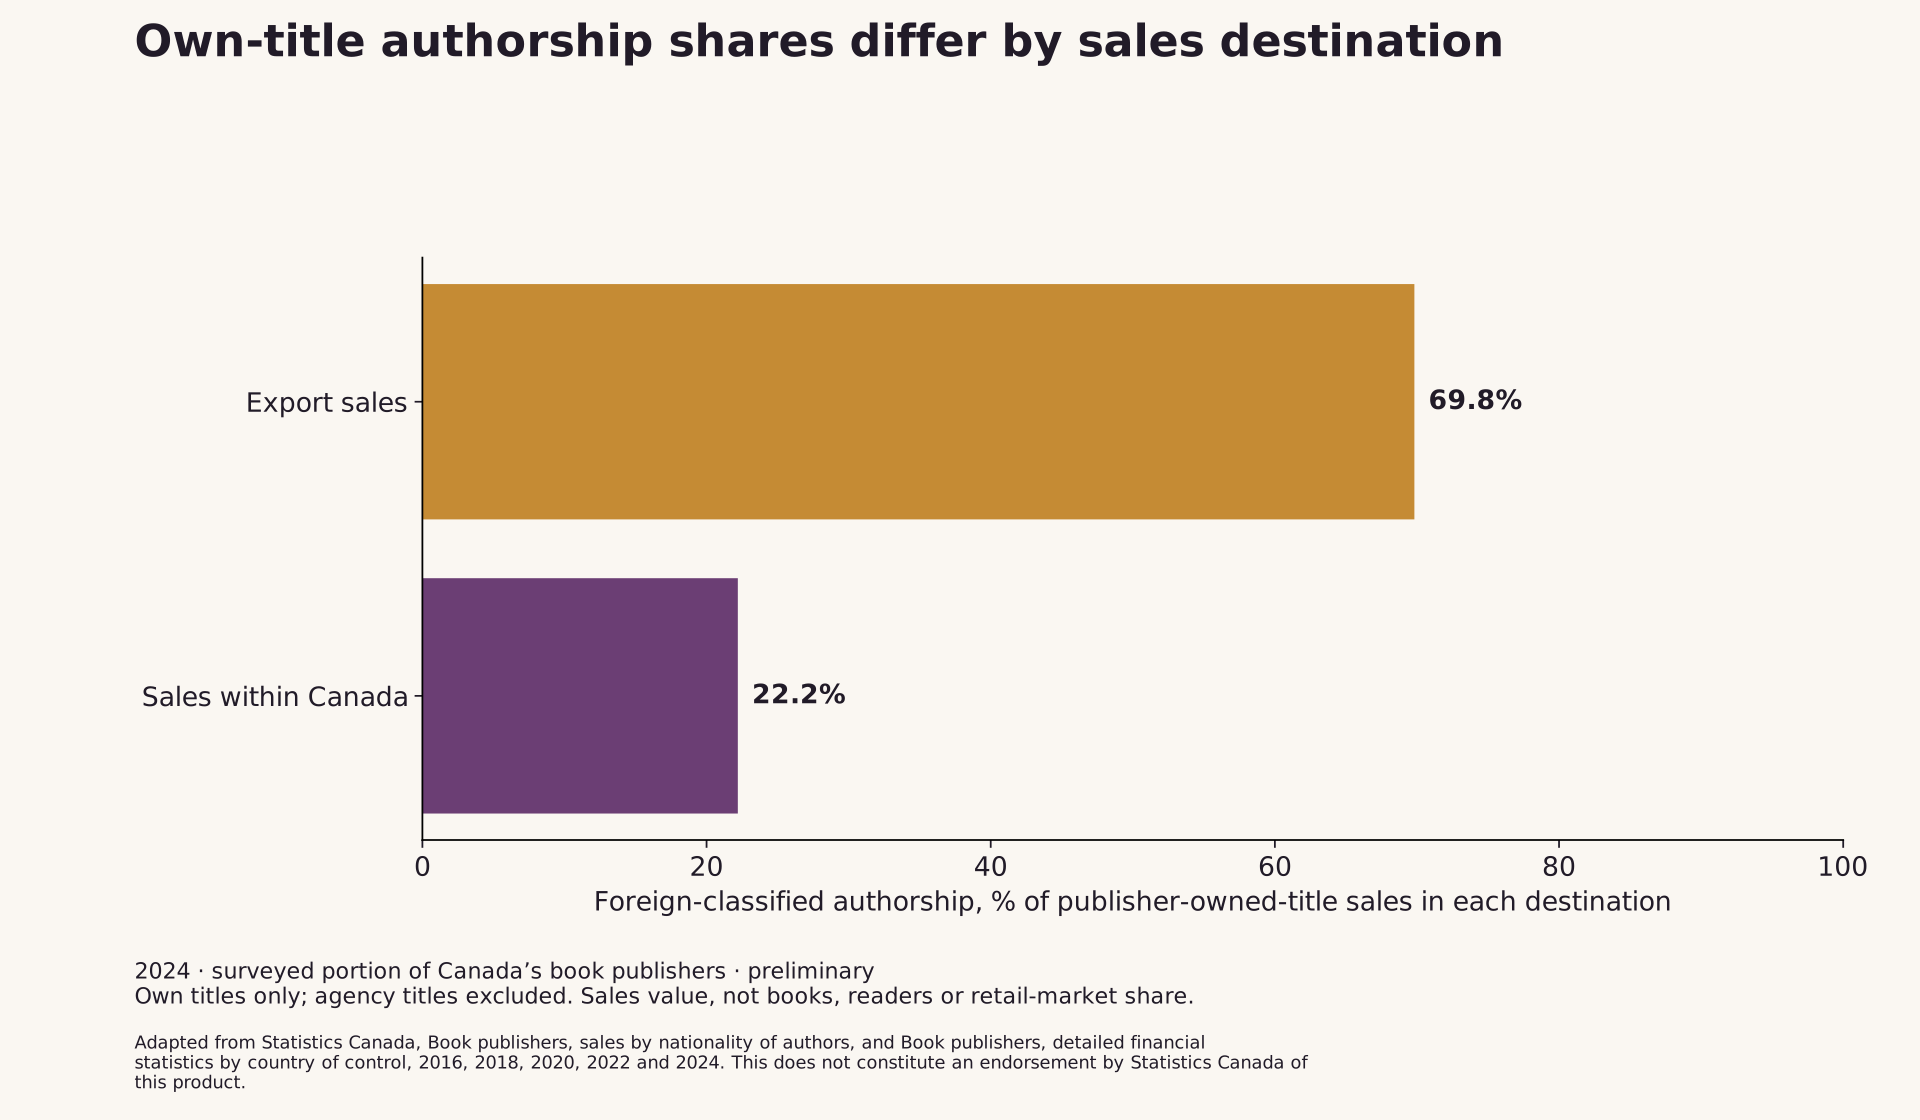
The current Statistics Canada tables illustrate the distinction clearly. In the 2024 surveyed portion of the book-publishing industry, foreign-authorship titles account for about 22.2% of publishers’ own-title sales within Canada, but about 69.8% of their own-title export sales. Neither percentage is the foreign-authorship share of all retail books. The same tables also classify publishers by country of control, but they do not publish the joint author-nationality-by-business-control table needed to assign every sale to both dimensions.
This study reconstructs the directly available authorship-and-destination comparison, keeps agency-title sales separate, and shows the broad range of joint outcomes compatible with the domestic own-title marginals. The purpose is to make an important absence visible. Two published totals can constrain an unknown intersection without identifying its actual value. A feasible range is not a new observation about a company, an author or a title.
Three questions that need three labels
Authorship asks how a title is classified under the survey’s nationality rules. Country of control asks about the publishing business. Destination asks whether a publisher reports a sale within Canada or as an export. A Canadian-classified author can be published by a foreign-controlled business operating in Canada. A Canadian-controlled publisher can sell a foreign-classified author. Either type of publisher can sell a title to a customer outside Canada.
Even the authorship label requires care. The questionnaire’s rules are not simply a count of writers’ current home addresses. They include a Canadian citizen living abroad, apply rules for co-authored and collective works, and can classify a translated book as Canadian-authored when its author or translator is Canadian. The analysis uses the source’s classification rather than inventing a new nationality test or treating the labels as judgments about a book’s cultural identity.
Readers should therefore resist replacing foreign authorship with imported books, foreign-controlled publishing with foreign authors, or export sales with royalties paid abroad. The tables do not measure the nationality of each buyer, the physical route of every copy, a complete rights-payment flow, or the citizenship of every contributor. Their strength comes from the specific business-reporting categories that they do provide.
The sources and their shared boundary
The main inputs are Statistics Canada Table 21-10-0204-01, Book publishers, sales by nationality of authors, and Table 21-10-0202-01, Book publishers, detailed financial statistics by country of control. Both belong to the Survey of Service Industries: Book Publishers. The analysis uses the current release retrieved on 31 October 2026. It selects 2016, 2018, 2020, 2022 and 2024 for descriptive context, with 2022 and 2024 as the primary comparison.
These detailed tables cover the surveyed portion of the industry. Their notes state that the smallest firms by revenue are excluded from these particular estimates, although those firms contribute a relatively small part of total industry revenue. This boundary differs from the broader summary-statistics table. The present ratios must not be described as exact shares of every book-publishing business, every self-publishing author or the Canadian consumer book market.
The figures are nominal net sales expressed in millions of Canadian dollars, not copies or unique titles. The questionnaire calls for sales net of returns. The most recent year is preliminary; earlier estimates can be revised. The official February 2026 release explicitly notes revisions to 2020 and 2022. Keeping one release vintage is essential when comparing years, especially when a previous article or industry profile quotes different historical values.
Own titles and agency titles must remain separate
The source defines own titles as works published or co-published in Canada by a firm holding the Canadian territorial rights. Agency titles are published or reprinted outside Canada but sold in Canada. These terms describe the publisher’s role and rights relationship. They do not by themselves identify the author’s nationality, the language of the book or where a reader ultimately sits.
The hierarchy in the authorship table is particularly important. Its within-Canada and export rows sit under publishers’ own titles. They do not split the entire own-plus-exclusive-agency total into an authorship-by-destination table. A calculation that attaches those destination rows to the broader total would mix universes. This study records that nesting explicitly in the source matrix and excludes agency-title sales from its destination comparison.
For 2024, the broader own-and-agency total is CAD 1,371.6 million. Foreign-authorship sales within that broader total are CAD 702.8 million, or about 51.2%, as already reported in the official release. That familiar headline is retained as context. It is not the denominator used for the own-title domestic and export percentages, and it is not presented here as an original discovery.
The directly observed authorship-by-destination matrix
Within publishers’ own titles, the 2024 released cells show CAD 530.2 million of Canadian-classified authorship sales within Canada and CAD 151.3 million of foreign-classified authorship sales within Canada. Their sum is CAD 681.5 million. Dividing the foreign-classified component by that sum gives approximately 22.201%, displayed as 22.2% in the article chart.
The corresponding export cells are CAD 108.2 million for Canadian-classified authorship and CAD 250.3 million for foreign-classified authorship. Their sum is CAD 358.5 million. The foreign-classified export share is therefore approximately 69.819%, displayed as 69.8%. The difference between the two conditional shares is about 47.6 percentage points. This is a comparison between destinations within the own-title sales scope, not a difference in reading preferences established by a survey of consumers.
The size of that difference makes the denominator distinction consequential. A reporter asking which authorship category accounts for a larger share of publishers’ own-title export sales is asking a different question from one about own-title sales in Canada, and a different question again from one about own-plus-agency sales. Using a single unqualified phrase such as share of the book market would conceal those differences.
Why the matrix does not reveal reader demand
The destination comparison aggregates business sales values. It does not hold constant book prices, format, genre, educational use, title availability, rights agreements, business size or distribution practices. A higher share can reflect a different combination of those factors. It cannot establish that an individual reader prefers one nationality, that a particular category is more profitable, or that an author should change a publishing strategy.
Nor does an export value identify the final country of reading. The source category is the publisher’s reporting of sales. Distribution chains, rights territories and later transactions can be more complicated than the aggregate label suggests. The study does not reconstruct a physical trade balance, compare these figures with customs quantities, or infer cross-border copyright payments.
The figures also span formats under the source’s book definitions. They are not an ebook-only analysis, a print-only retail panel or an audiobook listening measure. That breadth is useful for an industry account, but it prevents a claim that one medium explains the authorship difference without additional format-by-authorship-by-destination information. Marginal tables cannot supply an unreported joint relationship merely because their headings sound compatible.
Business control provides another marginal, not the missing joint table
The country-of-control table reports CAD 401.2 million of domestic own-title sales for Canadian-controlled book publishers in 2024 and CAD 280.3 million for foreign-controlled book publishers. Together these equal the CAD 681.5 million domestic own-title total. This is the same domestic own-title universe used by the authorship cells, allowing a limited mathematical comparison of their marginal totals.
What is not observed is the four-cell cross-tabulation of Canadian or foreign authorship against Canadian or foreign publisher control. The public marginals tell us the size of each category but do not say which individual sales belong to both. Assuming independence would fill the missing cells with a model. Assuming that Canadian authors always use Canadian-controlled publishers would fill them with a different model. Neither assumption is warranted by the tables.
The downloadable analysis consequently does not estimate an actual author-by-control cross-tab. It also does not derive suppressed export-control cells by subtraction. Suppressed values retain their status; they are outside the calculation. The worked example below uses only released, unsuppressed domestic own-title marginals and describes a broad identification range rather than a hidden source statistic.
A feasible range makes the missing information tangible
Let A be domestic own-title sales classified as Canadian authorship, B be domestic own-title sales reported by foreign-controlled publishers, and T be all domestic own-title sales. Any overlap between A and B must be at least the larger of zero and A plus B minus T. It can be no larger than the smaller of A and B. These are ordinary bounds for two sets measured on a common additive base.
Substituting the released 2024 values gives a lower bound of CAD 129.0 million and an upper bound of CAD 280.3 million. The interval is wide: CAD 151.3 million. It means the displayed marginal values are compatible with many different assignments of authorship to publisher control. It does not mean the actual joint value has been observed, that every value is equally likely, or that a midpoint is a reasonable estimate.
The lower bound arises because the Canadian-authorship marginal is larger than the total sales capacity of Canadian-controlled publishers in this domestic own-title universe. If the marginals were exact and referred to precisely the same additive total, at least some Canadian-classified authorship sales would have to sit in the foreign-controlled category. That is a logical implication of the marginals, not evidence about a named publisher or a reconstruction of any confidential company record.
Rounding and uncertainty limit the interpretation
The public monetary cells are rounded to one decimal place in millions. Treating each displayed input as an interval of approximately plus or minus CAD 0.05 million gives an outer range of CAD 128.85 million to CAD 280.35 million for this illustrative overlap bound. These outer endpoints allow for decimal serialization of the released marginals. They do not account for sampling error, nonresponse, classification error or future revision.
The distinction between an identification range and a confidence interval is essential. An identification range describes which joint arrangements are compatible with specified marginals and assumptions. A confidence interval concerns repeated-sampling uncertainty around an estimated quantity. This analysis does not have a joint survey covariance matrix or a directly estimated overlap value, so it does not claim a design-based confidence level for the bound or for the destination-share contrast.
The calculations retain small source reconciliation residuals instead of forcing all rounded components to agree. For example, the 2024 Canadian-authorship own-title domestic and export cells sum to CAD 638.4 million, whereas the independently rounded published own-title total is CAD 638.5 million. That CAD 0.1 million difference is recorded in the downloadable table. It is not allocated to either destination or silently repaired by changing a source cell.
Comparing 2022 and 2024 responsibly
The same extraction and calculation rules are applied to both primary years. This allows a reader to inspect whether the conditional destination pattern or the width of the feasible overlap range changes in the current released estimates. It does not establish a statistically significant trend or identify a mechanism for any movement. The tables describe an industry domain for each period, with changes in business composition as well as reported sales.
Earlier selected years remain descriptive reference points from the same current table. The source notes that the NAICS code changed beginning with reference year 2022. The main comparison stays within the newer code period. Lines or adjacent bars across the earlier observations should not imply annual measurements, a stable business panel or a proof that every relevant classification remained economically identical across the entire span.
The source survey allows qualifying fiscal periods as well as calendar-year reporting. It integrates survey and administrative information and uses weighting, editing and imputation. These methods make the aggregate estimates possible; they also mean the data should not be described as a direct census of authors’ publishing contracts. The analysis never claims to observe individual author affiliations or the contractual terms linking an author to a business.
A practical reporting checklist
Before quoting a share, name the reporting unit, the sales scope, the category and the denominator. In this case, an accurate caption might specify foreign-classified authorship as a share of surveyed publishers’ own-title sales within Canada in 2024. A shorter headline can still be readable, but the complete scope needs to appear beside the number rather than being buried after a stronger, unsupported claim.
Before joining two tables, inspect their hierarchy and coverage. Matching years and units is necessary but insufficient: own titles, agency titles, all book sales and operating revenue are not interchangeable bases. Before filling an absent joint table, state which relationship is observed and which is assumed. If the purpose is to explain what cannot be inferred, a visible range or an explicit absence can be more informative than a precise-looking synthetic cross-tabulation.
The public source matrix retains table identifiers, vectors, coordinates and released values. The code reproduces the conditional shares, rounding residuals and mathematical bounds without accounts or paid data. Together they provide a reusable way to distinguish a book’s survey authorship classification from the control of its publisher and the destination of its sales. Keeping those dimensions separate makes the statistics clearer while preserving the questions that the available data leave unanswered.
Adapted from Statistics Canada, Book publishers, sales by nationality of authors, and Book publishers, detailed financial statistics by country of control, 2016, 2018, 2020, 2022 and 2024. This does not constitute an endorsement by Statistics Canada of this product.
Own-title authorship shares differ by sales destination
2024 · surveyed portion of Canada’s book publishers · preliminary Own titles only; agency titles excluded. Sales value, not books, readers or retail-market share.
Full chart and source
Scroll horizontally to inspect the chart. ↔
Chart and values
Scroll horizontally to see all columns.
| Year | Canadian-classified authorship: domestic own titles (CAD m) | Foreign-classified authorship: domestic own titles (CAD m) | Canadian-classified authorship: own-title exports (CAD m) | Foreign-classified authorship: own-title exports (CAD m) | Foreign authorship share: domestic own titles (%) | Foreign authorship share: own-title exports (%) | Foreign-authorship share: exports minus domestic (pp) |
|---|---|---|---|---|---|---|---|
| 2016 | 525.3 | 143.0 | 101.1 | 140.6 | 21.398 | 58.171 | 36.774 |
| 2018 | 458.4 | 241.7 | 129.3 | 123.9 | 34.524 | 48.934 | 14.410 |
| 2020 | 492.7 | 177.7 | 113.9 | 174.0 | 26.507 | 60.438 | 33.931 |
| 2022 | 547.8 | 161.5 | 111.4 | 199.8 | 22.769 | 64.203 | 41.434 |
| 2024 | 530.2 | 151.3 | 108.2 | 250.3 | 22.201 | 69.819 | 47.618 |
Surveyed portion only; agency titles excluded from the destination matrix. Sales value, not copies or retail market share.

Authorship and publisher control do not identify their intersection
Surveyed portion only. Canadian-classified authorship AND foreign-controlled publishers, domestic own-title sales Purple: released-marginal bounds. Gold: decimal-rounding outer envelope. Neither is a sampling confidence interval.
Full chart and source

Scroll horizontally to inspect the chart. ↔
Chart and values
Scroll horizontally to see all columns.
| Year | Canadian-authorship marginal (CAD m) | Foreign-control marginal (CAD m) | Domestic own-title sales total (CAD m) | Feasible overlap lower limit (CAD m) | Feasible overlap upper limit (CAD m) | Rounding outer lower limit (CAD m) | Rounding outer upper limit (CAD m) |
|---|---|---|---|---|---|---|---|
| 2016 | 525.3 | 303.6 | 668.3 | 160.6 | 303.6 | 160.45 | 303.65 |
| 2018 | 458.4 | 324.4 | 700.1 | 82.7 | 324.4 | 82.55 | 324.45 |
| 2020 | 492.7 | 278.6 | 670.4 | 100.9 | 278.6 | 100.75 | 278.65 |
| 2022 | 547.8 | 290.7 | 709.3 | 129.2 | 290.7 | 129.05 | 290.75 |
| 2024 | 530.2 | 280.3 | 681.5 | 129.0 | 280.3 | 128.85 | 280.35 |
Surveyed portion only. Canadian-classified authorship AND foreign-controlled publishers, domestic own-title sales. Feasible ranges are not observed joint values or confidence intervals. The outer range addresses decimal rounding only.

Data & downloads
Scroll horizontally to see all columns.
| Year | Canadian-classified authorship: domestic own titles (CAD m) | Foreign-classified authorship: domestic own titles (CAD m) | Canadian-classified authorship: own-title exports (CAD m) | Foreign-classified authorship: own-title exports (CAD m) | Foreign authorship share: domestic own titles (%) | Foreign authorship share: own-title exports (%) | Foreign-authorship share: exports minus domestic (pp) |
|---|---|---|---|---|---|---|---|
| 2016 | 525.3 | 143.0 | 101.1 | 140.6 | 21.398 | 58.171 | 36.774 |
| 2018 | 458.4 | 241.7 | 129.3 | 123.9 | 34.524 | 48.934 | 14.410 |
| 2020 | 492.7 | 177.7 | 113.9 | 174.0 | 26.507 | 60.438 | 33.931 |
| 2022 | 547.8 | 161.5 | 111.4 | 199.8 | 22.769 | 64.203 | 41.434 |
| 2024 | 530.2 | 151.3 | 108.2 | 250.3 | 22.201 | 69.819 | 47.618 |
Surveyed portion only; agency titles excluded from the destination matrix. Sales value, not copies or retail market share.
Scroll horizontally to see all columns.
| Year | Canadian-authorship marginal (CAD m) | Foreign-control marginal (CAD m) | Domestic own-title sales total (CAD m) | Feasible overlap lower limit (CAD m) | Feasible overlap upper limit (CAD m) | Rounding outer lower limit (CAD m) | Rounding outer upper limit (CAD m) |
|---|---|---|---|---|---|---|---|
| 2016 | 525.3 | 303.6 | 668.3 | 160.6 | 303.6 | 160.45 | 303.65 |
| 2018 | 458.4 | 324.4 | 700.1 | 82.7 | 324.4 | 82.55 | 324.45 |
| 2020 | 492.7 | 278.6 | 670.4 | 100.9 | 278.6 | 100.75 | 278.65 |
| 2022 | 547.8 | 290.7 | 709.3 | 129.2 | 290.7 | 129.05 | 290.75 |
| 2024 | 530.2 | 280.3 | 681.5 | 129.0 | 280.3 | 128.85 | 280.35 |
Surveyed portion only. Canadian-classified authorship AND foreign-controlled publishers, domestic own-title sales. Feasible ranges are not observed joint values or confidence intervals. The outer range addresses decimal rounding only.
Evidence & method
How we calculated it
- Extract 70 released Canada cells across five selected years from Tables 21-10-0204-01 and 21-10-0202-01. Retain the exact source hierarchy and public coordinates.
- Destination rows are nested under publisher-owned titles. Compute foreign-authorship shares separately within domestic own-title sales and own-title export sales. Keep agency sales and broader headline shares separate.
- Compare only unsuppressed domestic own-title authorship and country-of-control marginals on their explicitly aligned base. For Canadian-authorship A, foreign-control B and total T, the overlap limits are max(0,A+B−T) and min(A,B).
- Retain component rounding residuals. The outer decimal-rounding envelope is max(0,A+B−T−0.15) to min(A+0.05,B+0.05), in CAD millions. Neither range is a sampling confidence interval.
- Reproduce all numerical outputs offline with the supplied pinned matrix and standard-library code. Do not reconstruct suppressed export-by-control cells.
What the data cannot tell us
- Detailed tables cover the surveyed portion, excluding the smallest firms by revenue, not the full consumer book market or every self-publisher.
- Authorship follows questionnaire nationality, co-author, collective-work and translator rules. It is not a new cultural-identity classification; publisher country of control is a separate dimension.
- Own-title destination shares exclude agency titles. Values are nominal net publisher sales, not copies, unique titles, readers, royalties, author income or profit.
- The actual author-by-control joint table is unobserved. Mathematical identification ranges do not establish its midpoint, probability distribution or a confidence level.
- 2024 is preliminary, prior years may be revised and the 2022 NAICS replacement is noted. No causal explanation, consumer preference or statistically significant trend is established.
Original sources
- Statistics Canada: Book publishers, detailed financial statistics by country of control (21-10-0202-01)
Country-of-control table: released domestic own-title marginals. Suppressed export-control cells are not reconstructed.
Accessed October 31, 2026
- Statistics Canada: Book publishers, sales by nationality of authors (21-10-0204-01)
Authorship table: destination rows are nested under publisher-owned titles; the broader own-plus-agency total remains separate.
Accessed October 31, 2026
- Statistics Canada: 2024 book-publisher questionnaire
Actual 2024 questionnaire: own and agency titles, net sales and the nationality/co-author/translator classification rules.
Accessed October 31, 2026
- Statistics Canada: Book-publisher survey methods
Survey methods: industry coverage, weighting, administrative information, fiscal periods, imputation and uncertainty.
Accessed October 31, 2026
- Statistics Canada: Book publishing industry, 2024
The official release already reports headline growth, margins and authorship results; these are prior findings, not discoveries of this analysis.
Accessed October 31, 2026
- Statistics Canada Open Licence
Source reuse terms require attribution and nonendorsement notices; no agency insignia or confidential data are used.
Accessed October 31, 2026
Cite & reuse this study
Alisson Bento. 2026. A Canadian author is not a Canadian-controlled publisher: reading three book-market classifications. Original secondary analysis of Statistics Canada’s current released publishing tables. https://alissonbento.com/research/canada-book-sales-authorship-control-destination-boundaries/
Adapted from Statistics Canada, Book publishers, sales by nationality of authors, and Book publishers, detailed financial statistics by country of control, 2016, 2018, 2020, 2022 and 2024. This does not constitute an endorsement by Statistics Canada of this product. Original analysis and charts: Alisson Bento. Source information remains under the Statistics Canada Open Licence; original reproduction code is MIT-licensed. No agency endorsement or licence for third-party book content is implied.
Corrections or editorial questions