Where the difference appears
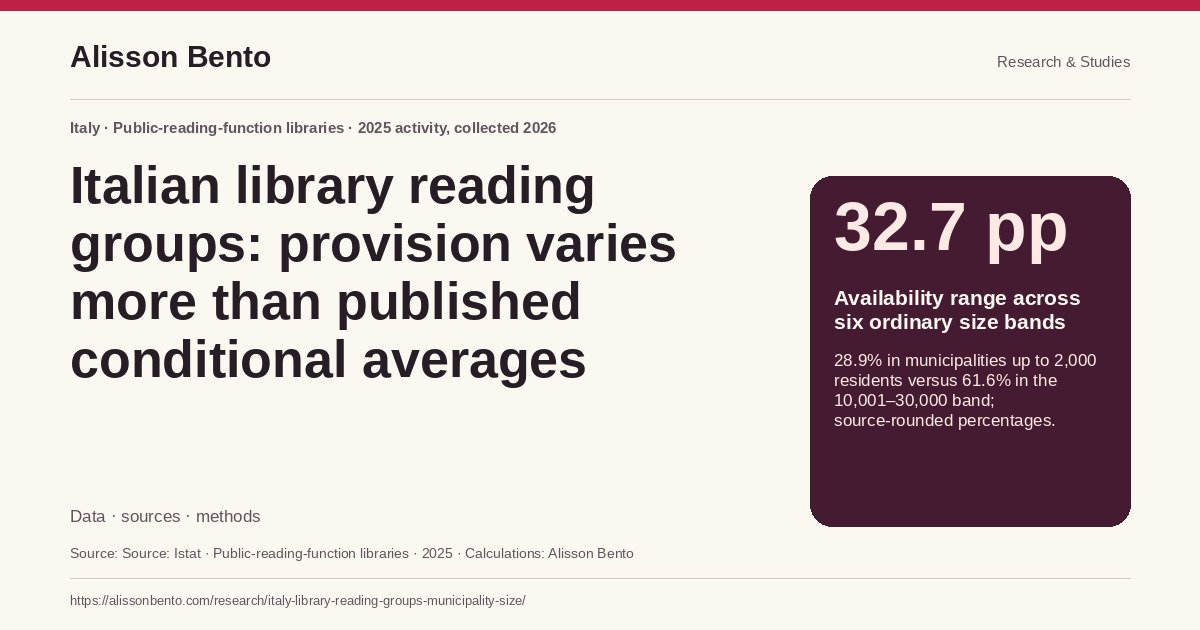
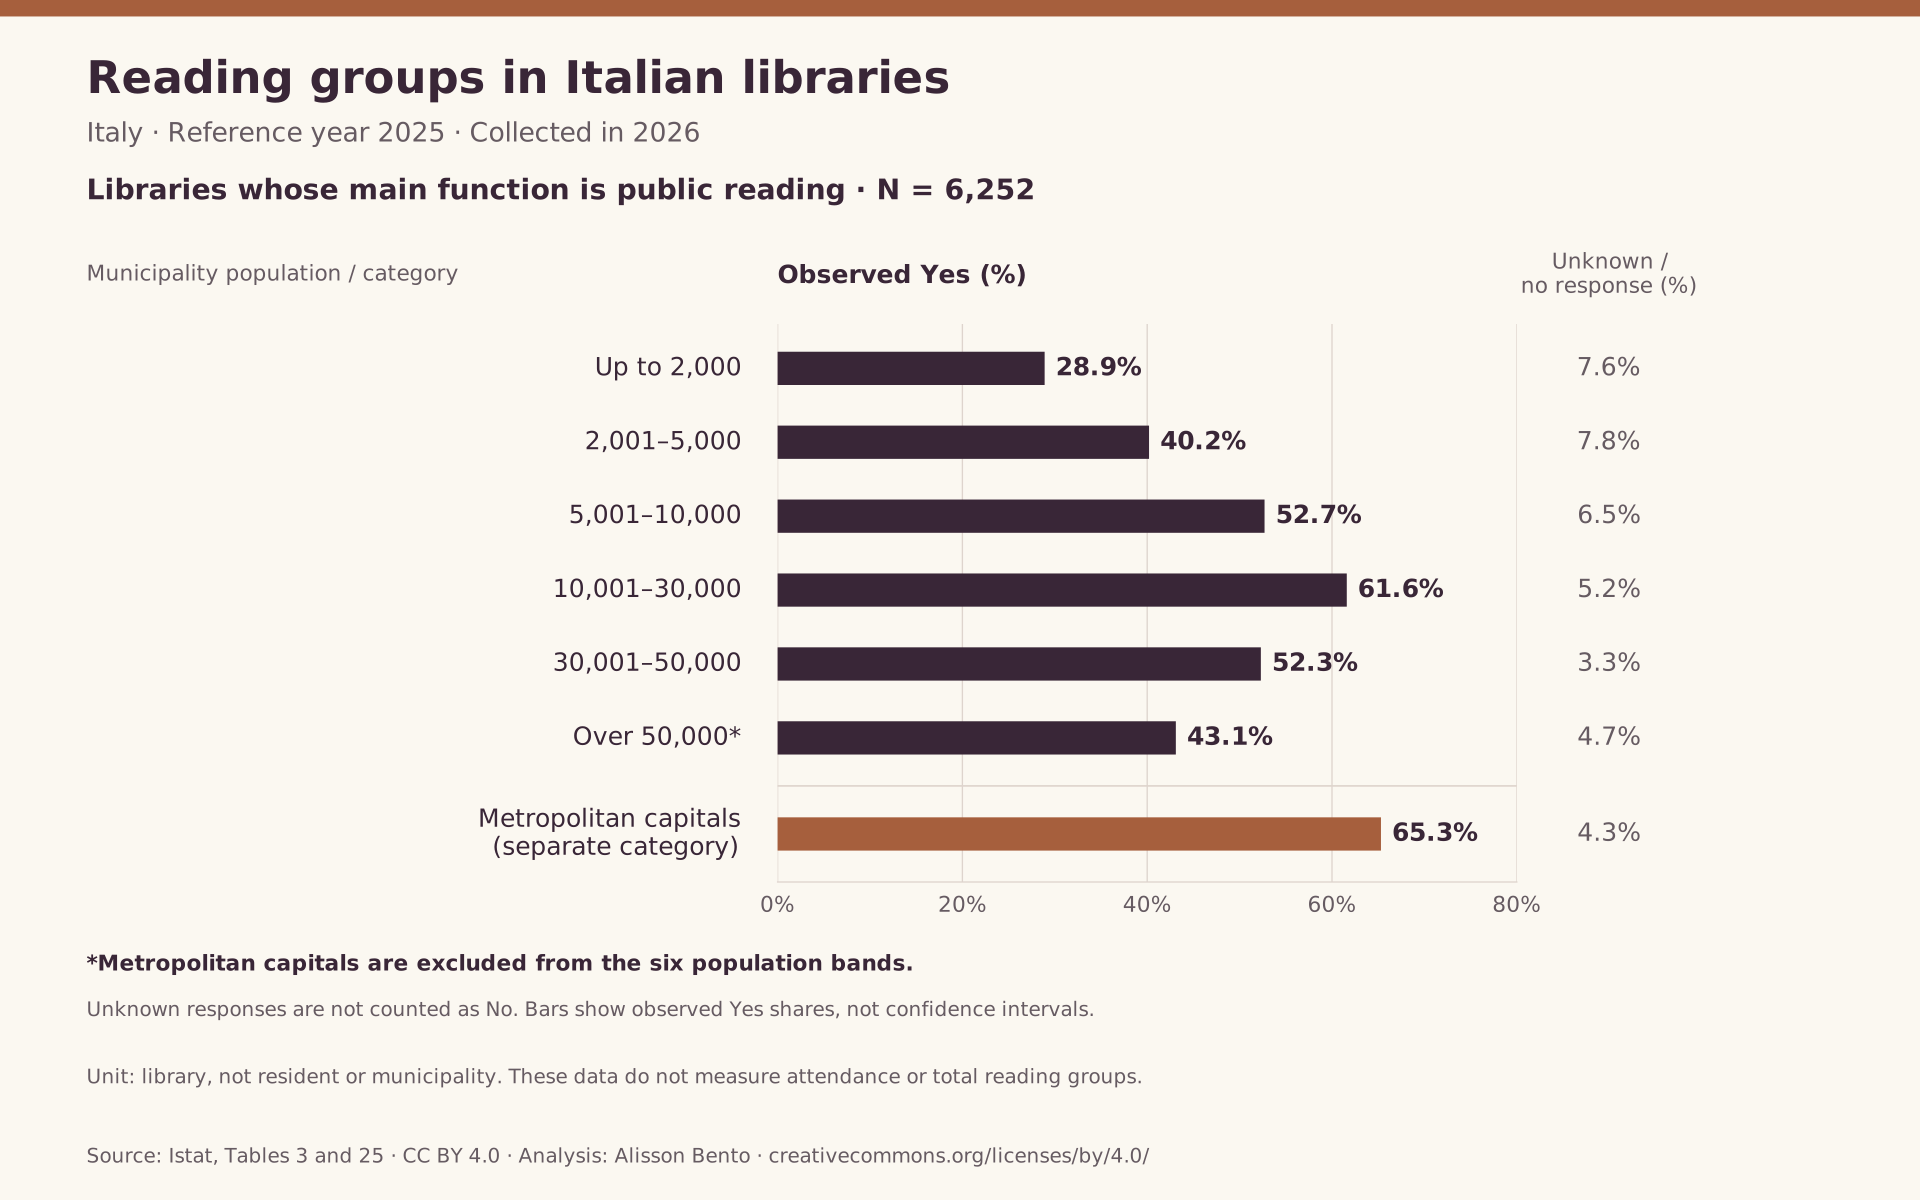
In Italian municipalities with no more than 2,000 residents, 28.9% of libraries whose main function was public reading reported organizing a reading group in 2025. In municipalities with 10,001 to 30,000 residents, the proportion was 61.6%. That difference of 32.7 percentage points is the clearest result in this comparison. The published average number of groups among responding libraries that offered them was three in both categories. The contrast separates whether a library organizes a group from how many groups an established programme reports. Those questions describe different aspects of library provision, and their denominators must remain visible.
Across the six ordinary municipality-size bands, reported availability varied more widely in relative terms than the displayed conditional averages. Availability did not simply increase with municipality size: it rose through the 10,001–30,000 band and then fell in the next two bands. Metropolitan-capital municipalities appear separately in the source and had a higher reported availability rate of 65.3%. Their libraries must not be folded into the ordinary largest-size row without rebuilding the calculation. The result therefore supports a specific account of uneven library provision rather than a general rule that larger places always have more reading groups. It also leaves a substantial question unanswered: the tables do not reveal whether residents attended, wanted to attend, or could conveniently reach any of those groups.
The denominator is public-reading function, not public ownership
The most consequential source check concerns which libraries were asked about reading groups. Istat's wider census identified 8,883 eligible libraries open to the public in 2025, but that is not the denominator for this analysis. Question 15 of the official questionnaire identifies a library's predominant function. Response one is public reading, covering general services for the community. Question 20.1a, which asks whether the library organized reading groups, is directed only to libraries choosing that response. Table 3 counts 6,252 such libraries. The restriction is easy to miss because the titles of Tables 25 and 26 refer simply to libraries, while the routing instruction appears in the questionnaire.
Public-reading function and public ownership are different classifications. Of the 6,252 libraries in the relevant functional category, 5,851 were publicly owned and 401 privately owned. A privately owned institution can provide public-reading services, while a publicly owned institution can principally specialize in a subject or conserve collections. The distinction also passes an arithmetic check. Weighting the published ownership-specific availability percentages by those functional-category counts gives approximately 44.48%, consistent with the national published value of 44.5%. Weighting them by the broader ownership counts for all library functions gives about 43.14%, which does not reconcile. Both the questionnaire and the numerical check therefore support the narrower denominator. Every availability percentage here refers to public-reading-function libraries in its category, including the explicitly recorded unknown responses.
Six population bands, with metropolitan capitals kept separate
The six ordinary municipality-size bands contain 5,975 public-reading libraries. Their respective counts are 1,621 in municipalities of up to 2,000 residents; 1,608 in the 2,001–5,000 band; 1,107 in the 5,001–10,000 band; 934 in the 10,001–30,000 band; 239 in the 30,001–50,000 band; and 466 in the band above 50,000. Another 277 public-reading libraries belong to metropolitan-capital municipalities. Adding that separate category produces the national total of 6,252. This reconciliation establishes that the metropolitan-capital row is not an extra overlapping subtotal to add to the ordinary largest-size band. The table presented with this study retains all seven categories and the national reference row.
The population thresholds classify the municipality containing a library; they do not describe the library's membership or catchment population. A municipality with several libraries contributes several library observations. A municipality without an eligible library contributes none to this comparison of library provision. Consequently, the percentage of libraries organizing groups cannot be converted into the percentage of towns with a group, or the percentage of residents with access to one. Travel between municipalities, opening hours, transport and the distribution of libraries within a town can all matter to practical access, but those relationships are not established by these tables. Keeping the geographic category separate from the statistical unit prevents a library-level finding from becoming an unsupported claim about residents' opportunities.
Availability rises through medium-sized municipalities, then falls
The six reported availability percentages are 28.9%, 40.2%, 52.7%, 61.6%, 52.3% and 43.1%, in ascending order of municipality size. The first four bands therefore show progressively higher reported provision, followed by lower proportions in the two larger ordinary categories. The highest ordinary-band percentage is approximately 2.13 times the lowest. This is a ratio of published rounded percentages, not an estimate of the number of groups available to each resident. The 32.7-point range provides a simpler absolute summary, while retaining all six values prevents the range from concealing the shape of the relationship. Comparing only the smallest and largest categories would miss the peak in the middle of the classification.
Metropolitan-capital municipalities had 65.3% reported availability, alongside 30.3% reporting no group and 4.3% with unknown status or nonresponse. Nationally, the corresponding percentages were 44.5%, 48.9% and 6.6%. These national values describe the actual mixture of public-reading libraries across categories; they should not be recreated by averaging the seven percentages equally. Libraries in the smallest two bands together account for more than half of the relevant national base, while the 30,001–50,000 band is much smaller. The category counts are useful context for interpreting the aggregate, but they do not explain why provision differs. The tables do not isolate resources, staffing, local preferences or organizational choices as causes of the observed pattern.
The group-count measure is conditional and rounded
After a library answers that it organized reading groups, question 20.1b asks how many groups it organized during 2025. The questionnaire explicitly distinguishes groups from meetings. A group meeting repeatedly is not represented as a new group each time it meets. The measure therefore cannot be interpreted as an annual event count, a frequency of meetings or an amount of staff time devoted to the activity. Table 26 reports a mean of three groups in five of the six ordinary size bands and four in the 30,001–50,000 band. Metropolitan capitals and the national total also have a published mean of three. These are whole-number rounded means, rather than statements that every offering library ran exactly that many groups.
The footnote to Table 26 adds a second qualification: the mean is calculated over libraries that answered the question. The safe description is therefore the published average among responding group-offering public-reading libraries. The table does not supply the exact number of valid numerical responses for each size category. It cannot establish that every library reporting the presence of a group also supplied a usable group count. Moreover, an average alone conceals the distribution. Table 26 separately reports percentages with one, two, three and more than three groups; the final category has no specified upper endpoint. Substituting four for every observation in that category would manufacture information and would not reproduce the official mean. The analysis preserves the published averages without reconstructing unobserved group totals.
How far the two measures can be compared
Availability and conditional group counts use different units. A range measured in percentage points cannot meaningfully be subtracted from a range measured in groups per responding library. Relative comparisons provide a more coherent descriptive check. The largest availability percentage divided by the smallest is approximately 2.13. The largest displayed conditional mean divided by the smallest displayed mean is four divided by three, or about 1.33. This second number is only the ratio of the rounded values printed in the source. Reporting it as the exact ratio of the underlying averages would overstate precision. The useful conclusion is that the published availability profile shows a wider relative spread than the published conditional mean profile, within the six ordinary size bands.
A rounding sensitivity check helps distinguish that observation from a formatting accident. Under conventional nearest-integer rounding, a mean printed as three lies approximately between 2.5 and 3.5, while one printed as four lies between 3.5 and 4.5. The greatest possible ratio across those intervals approaches 1.8. Applying nearest-tenth rounding to the availability endpoints leaves their ratio above approximately 2.12. This check is conditional on the stated rounding model; Istat notes automatic rounding without specifying tie handling. More importantly, rounding analysis cannot correct differences in response completeness or selection into offering groups. The comparison remains descriptive of the reported measures. It is not a significance test, an estimate of inequality among residents, or proof that the same pattern would hold if every missing group count were known.
Unknown responses are visible, and the main contrast survives a simple sensitivity check
Table 25 retains a category for unknown status or nonresponse. Its percentages across the six ordinary bands are 7.6%, 7.8%, 6.5%, 5.2%, 3.3% and 4.7%. Treating those entries as confirmed absence would conceal a measurement distinction. One alternative calculation divides the published Yes percentage by the sum of the Yes and No percentages. Using the rounded source values gives approximately 31.3%, 43.6%, 56.4%, 65.0%, 54.1% and 45.3%. These are availability proportions among known-status responses, not replacements for the source measure. They would represent all eligible libraries without bias only under additional assumptions about missingness that the aggregate tables cannot verify. Their role here is to show how a transparent denominator change affects the descriptive pattern.
A different sensitivity assigns every unknown status first to no group and then to having a group. The resulting approximate ranges are 28.9–36.5%, 40.2–48.1%, 52.7–59.2%, 61.6–66.8%, 52.3–55.6% and 43.1–47.9%. The upper endpoints use 100 minus the published No percentage; independent rounding can make this differ slightly from adding Yes and Unknown. Even if every unknown in the smallest band had a group, its approximate upper endpoint of 36.5% would remain 25.1 points below the observed 61.6% in the 10,001–30,000 band. These scenarios address unknown group status within the tabulated population. They are not confidence intervals and do not cover libraries omitted from the census frame or missing numerical group counts among confirmed providers.
A 2025 observation collected in 2026
The observation year is 2025. Istat conducted collection between March and July 2026 and published the first results on October 12, 2026. Those dates serve different purposes: a 2026 fieldwork date does not turn the reading-group activity into a 2026 observation. The wider census began from a list of 9,963 units. Its methodological note records 265 unresolved units, equivalent to 2.7% of that initial list, and 8,883 eligible libraries open to the public. The reported 97.3% resolution or response rate includes resolved units subsequently found ineligible. It must not be presented as a 97.3% response rate to the reading-group question, or as the response rate among libraries asked for a numerical group count.
The census covers public and private libraries meeting its eligibility rules and providing access to an external public. School and university libraries are excluded, along with other ineligible structures described in the methods. Collection and integration also vary in ways relevant to missingness. In Bolzano province, 88 of 269 libraries completed the Istat online questionnaire; information for other libraries came through provincial monitoring, with unavailable items recorded as missing. Table 25 reports 62.4% unknown or nonresponse for Bolzano's reading-group status. That example cautions against interpreting every missing entry as refusal or lack of interest, and against building a regional ranking without examining the source differences. This study retains the national municipality classification rather than extending the analysis into an inadequately qualified regional league table.
What this tells libraries, and what it cannot tell publishers
For a library reader, the distinction between presence and conditional number is useful because a single average can overlook institutions with no programme at all. A reported mean of three groups among responding providers says little by itself about how widespread provision is. The smallest ordinary municipality band combines that mean with 28.9% reported availability; the 10,001–30,000 band combines the same displayed mean with 61.6% availability. Looking at both measures makes the institutional difference visible without assuming that one particular delivery model is better. It also suggests a concrete requirement for further descriptive work: information on institutions that do not offer groups should be examined separately from the characteristics of established programmes, rather than inferred from the latter's averages.
For publishers and authors, the evidence has narrower commercial implications than the topic might suggest. No attendance, membership, book selection, purchasing, genre preference or willingness to pay is measured in these rows. A library reporting no group does not demonstrate unmet demand, and it does not establish that the surrounding community lacks a reading group elsewhere. Independent groups, informal meetings and other nonlibrary arrangements fall outside this specific measure. Even a library reporting several groups may have overlapping participants or very different meeting schedules. The table therefore supports an account of institutional provision, not a sales forecast or a market-size estimate. Any practical outreach strategy would require additional local evidence and a separate decision about whom to contact; neither activity is part of these calculations.
Reproducing the result without inventing a total
The accompanying download preserves the published percentages and rounded means alongside the public-reading base counts and calculated sensitivities. Source-cell references identify the relevant rows in Tables 25 and 26, while Table 3 supplies the functional-category counts. The calculation script recomputes percentage-point ranges, relative ratios, known-status percentages and missing-status endpoints from those retained inputs. It keeps the national and metropolitan-capital rows separate from the six-band comparison. The public files contain a small analytical table and the methods needed to inspect it, rather than a redistribution of the complete official workbook. Readers who want to verify extraction can follow the source link to Istat and compare the identified cells directly.
One tempting calculation is deliberately absent: multiplying availability by the conditional mean to estimate groups per library or a national group total. That identity would require aligned denominators and sufficient information about valid group-count responses. The published footnote does not establish complete numerical response among all libraries answering Yes, and the means are rounded. A defensible extension would need category-specific Yes counts, valid numerical-response counts and total groups, with explicit treatment of missing values. Until those are available, the two measures should stay side by side. Istat's data carry its default CC BY 4.0 terms unless otherwise indicated, so reuse should retain source attribution, the license link and a description of modifications. Original explanation and calculations are credited to Alisson Bento; no agency endorsement or permission to reuse Istat's logo is implied.
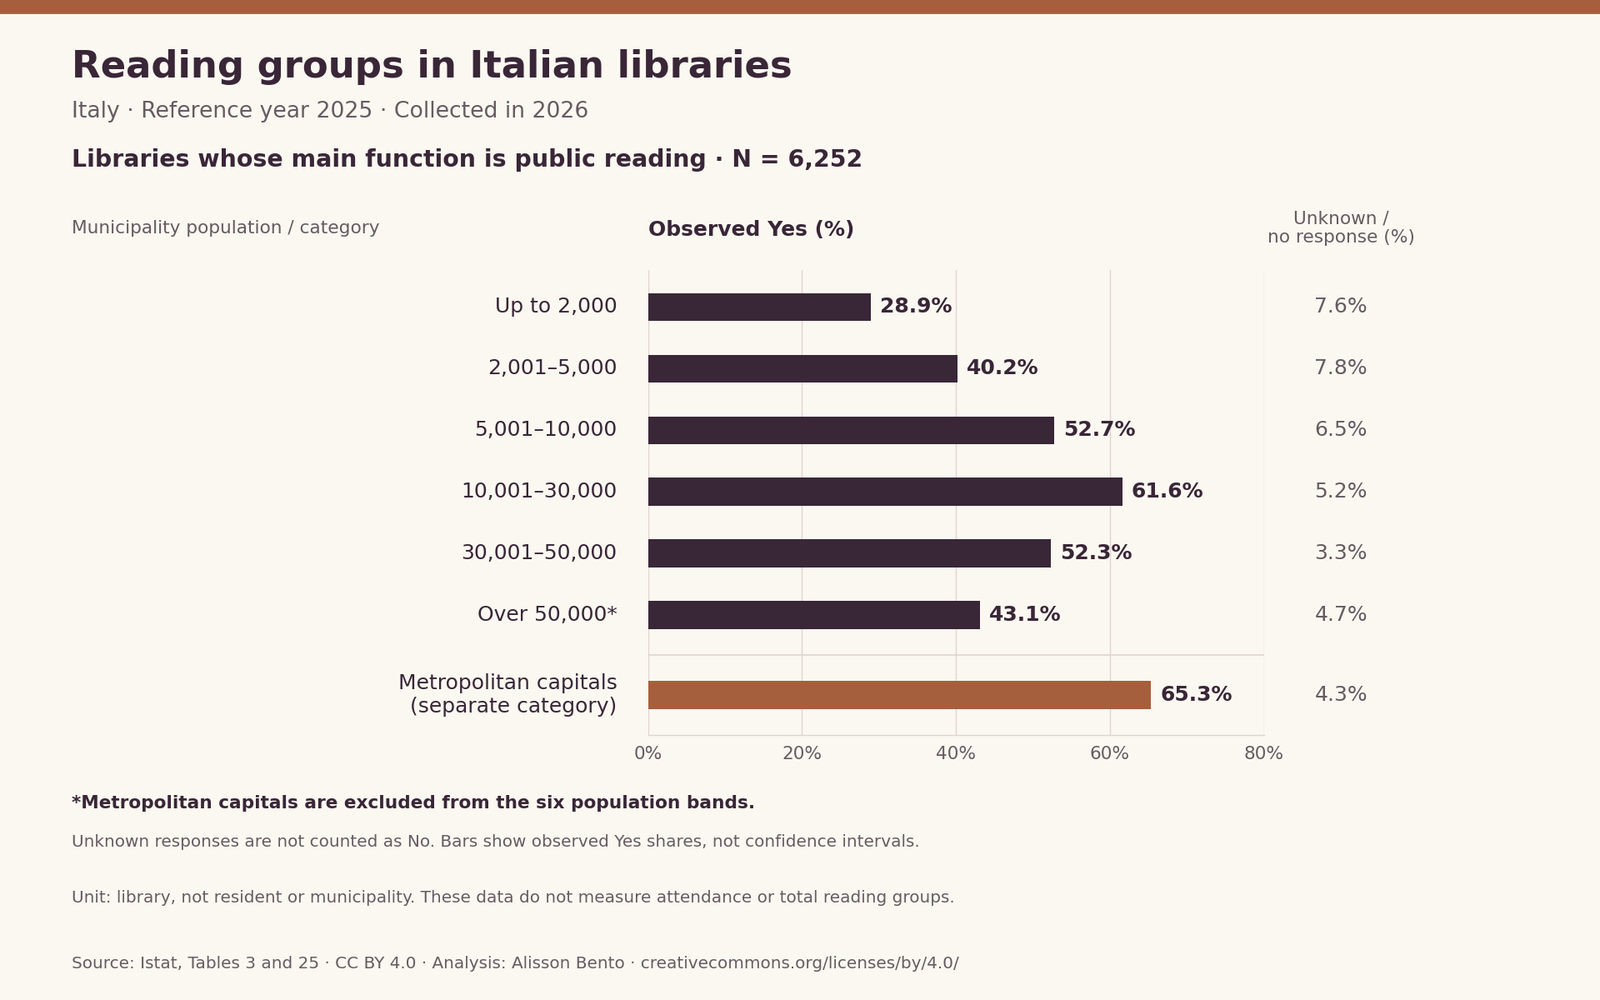
Reading groups in Italian libraries
Italy · Reference year 2025 · Collected in 2026. Libraries whose main function is public reading · N = 6,252
Full chart and source
Scroll horizontally to inspect the chart. ↔
Chart and values
Scroll horizontally to see all columns.
| Municipality residents/category | Public-reading base N | Yes (%) | No (%) | Unknown/nonresponse (%) | Rounded conditional mean groups |
|---|---|---|---|---|---|
| Up to 2,000 | 1621 | 28.9 | 63.5 | 7.6 | 3 |
| 2,001–5,000 | 1608 | 40.2 | 51.9 | 7.8 | 3 |
| 5,001–10,000 | 1107 | 52.7 | 40.8 | 6.5 | 3 |
| 10,001–30,000 | 934 | 61.6 | 33.2 | 5.2 | 3 |
| 30,001–50,000 | 239 | 52.3 | 44.4 | 3.3 | 4 |
| More than 50,000, excluding metropolitan capitals | 466 | 43.1 | 52.1 | 4.7 | 3 |
| Metropolitan-capital municipalities (separate) | 277 | 65.3 | 30.3 | 4.3 | 3 |
| Italy | 6252 | 44.5 | 48.9 | 6.6 | 3 |
Public-reading-function libraries. N is the Table 3 presence-question base, not the unreported valid-number-response denominator. Percentages and means retain source rounding. Metropolitan capitals are separate from the six ordinary bands.
Data & downloads
Scroll horizontally to see all columns.
| Municipality residents/category | Public-reading base N | Yes (%) | No (%) | Unknown/nonresponse (%) | Rounded conditional mean groups |
|---|---|---|---|---|---|
| Up to 2,000 | 1621 | 28.9 | 63.5 | 7.6 | 3 |
| 2,001–5,000 | 1608 | 40.2 | 51.9 | 7.8 | 3 |
| 5,001–10,000 | 1107 | 52.7 | 40.8 | 6.5 | 3 |
| 10,001–30,000 | 934 | 61.6 | 33.2 | 5.2 | 3 |
| 30,001–50,000 | 239 | 52.3 | 44.4 | 3.3 | 4 |
| More than 50,000, excluding metropolitan capitals | 466 | 43.1 | 52.1 | 4.7 | 3 |
| Metropolitan-capital municipalities (separate) | 277 | 65.3 | 30.3 | 4.3 | 3 |
| Italy | 6252 | 44.5 | 48.9 | 6.6 | 3 |
Public-reading-function libraries. N is the Table 3 presence-question base, not the unreported valid-number-response denominator. Percentages and means retain source rounding. Metropolitan capitals are separate from the six ordinary bands.
Scroll horizontally to see all columns.
| Municipality residents/category | Known-status Yes (%) | All unknown No: lower (%) | All unknown Yes: upper (%) |
|---|---|---|---|
| Up to 2,000 | 31.3 | 28.9 | 36.5 |
| 2,001–5,000 | 43.6 | 40.2 | 48.1 |
| 5,001–10,000 | 56.4 | 52.7 | 59.2 |
| 10,001–30,000 | 65.0 | 61.6 | 66.8 |
| 30,001–50,000 | 54.1 | 52.3 | 55.6 |
| More than 50,000, excluding metropolitan capitals | 45.3 | 43.1 | 47.9 |
Calculations from rounded percentages. Known-status share = 100×Yes/(Yes+No). Missing-status endpoints = Yes and 100−No. Scenarios are not confidence intervals and do not address missing numerical group counts.
Evidence & method
How we calculated it
- Secondary descriptive analysis of Istat Tables 3, 25 and 26, observation year 2025; collection March–July 2026; first release October 12, 2026; accessed October 30, 2026.
- Questionnaire pp. 9 and 11 verifies public-reading-function eligibility and conditional group-count routing. Public-reading bases reconcile to 6,252; metropolitan capitals remain separate.
- Retain rounded source percentages and whole-number means. Calculate percentage-point range, relative ratios, known-status percentages and missing-status scenarios. No inferential testing or combined group totals.
- Download reproduction script recalculates derivatives from the analytical CSV; source URLs and worksheet cell references permit independent extraction review.
What the data cannot tell us
- Libraries are the unit, not towns, residents, members or attendees. Public-reading function is not public ownership.
- Valid numerical-response counts are not supplied for the conditional means; do not multiply availability by those means to estimate totals.
- Census coverage, item missingness, administrative-source differences and rounding remain. Unknown-status scenarios are not confidence intervals.
- No meeting frequency, group membership, participation, seats, demand, book purchases, genre preference or causal mechanism is established.
Original sources
- Istat: Indagine sulle Biblioteche, reference year 2025
Istat: Indagine sulle Biblioteche, reference year 2025: First results published October 12, 2026; collection March–July 2026.
Accessed October 30, 2026
- Istat statistical tables, 2025
Istat statistical tables, 2025: Table 3 public-reading-function bases; Table 25 group presence; Table 26 conditional distribution and rounded means. Means footnote at row 63.
Accessed October 30, 2026
- Istat methodological note
Istat methodological note: Census frame, eligibility, collection, unresolved units, provincial source differences and rounding; pages 1–4.
Accessed October 30, 2026
- Istat glossary
Istat glossary: Predominant public-reading function, distinct from ownership; page 2.
Accessed October 30, 2026
- Istat official questionnaire, 2026 collection
Istat official questionnaire, 2026 collection: Page 9 Q15 identifies function; page 11 Q20.1a applies only if Q15=1, and Q20.1b only if Yes. Groups, not meetings.
Accessed October 30, 2026
- Istat legal and reuse terms
Istat legal and reuse terms: Default CC BY 4.0 unless otherwise indicated; attribution, license link and modification notice required. Logos and third-party materials have separate restrictions.
Accessed October 30, 2026
Cite & reuse this study
Alisson Bento. Italian library reading groups: provision varies more than published conditional averages. Original secondary analysis of Istat, reference year 2025; fieldwork 2026. Sources accessed October 30, 2026. https://alissonbento.com/research/italy-library-reading-groups-municipality-size/
Source: Istat, Indagine sulle biblioteche pubbliche e private, 2025 observations, 2026 collection, Tables 3, 25 and 26. Source data: CC BY 4.0, https://creativecommons.org/licenses/by/4.0/. Original calculations and English explanation: Alisson Bento. Selection, labels and calculated sensitivities are modifications; no Istat endorsement or rights to its logo are implied.
Corrections or editorial questions