Which readers are in the denominator?
A statistic about fiction can describe several different groups. It might refer to all adults, people who read books, people who read novels, or customers buying a particular genre. Those groups overlap, but they are not interchangeable. This study asks a specific question: among adults reporting that they read a book during the previous twelve months, how many also reported reading novels or short stories? The answer concerns the composition of a survey-defined reading public. It does not measure demand for books, loyalty to a genre, or the likelihood that someone will join a reading group.
The analysis uses individual responses from the 2017 and 2022 Survey of Public Participation in the Arts, collected through the U.S. Census Bureau's Current Population Survey for the National Endowment for the Arts. Each estimate links the book and fiction answers given for the same person. That link matters because the fiction question covers material beyond books. The result is an overlap measure rather than a ratio assembled from two separate headline percentages. Age and education tables extend the same calculation without changing its denominator rule. All results concern the survey years, not current reading in 2026, and the two waves describe different samples rather than tracking the same readers.
What the two survey questions cover
The general book question asks about reading books during the previous twelve months, excluding books required for work or school. The fiction question asks separately about novels or short stories and includes material appearing in books, magazines, newspapers, on paper or online. A short story read on a website can therefore count as fiction even when the person reports no book reading. Conversely, a person can read books about history, practical subjects or religion without reporting any novel or short story. Neither response is an error simply because it differs from the other.
There are important limits to the wording. The fiction question itself does not repeat the general book question's work-or-school exclusion, so this analysis does not quietly impose that exclusion on all reported fiction. Separate questions about listening are not added to the numerator, although respondents may have understood reading broadly. The 2022 questionnaire explicitly mentions print and electronic books; the 2017 instrument instead includes a clarification about religious texts. That wording difference deserves attention alongside the change in proxy interviewing discussed below. The results do not isolate romance, literary fiction, completed novels, purchases, library borrowing, pages read or time spent reading. A single reported short story is enough to satisfy the fiction participation question.
The overall overlap, with its comparison limits
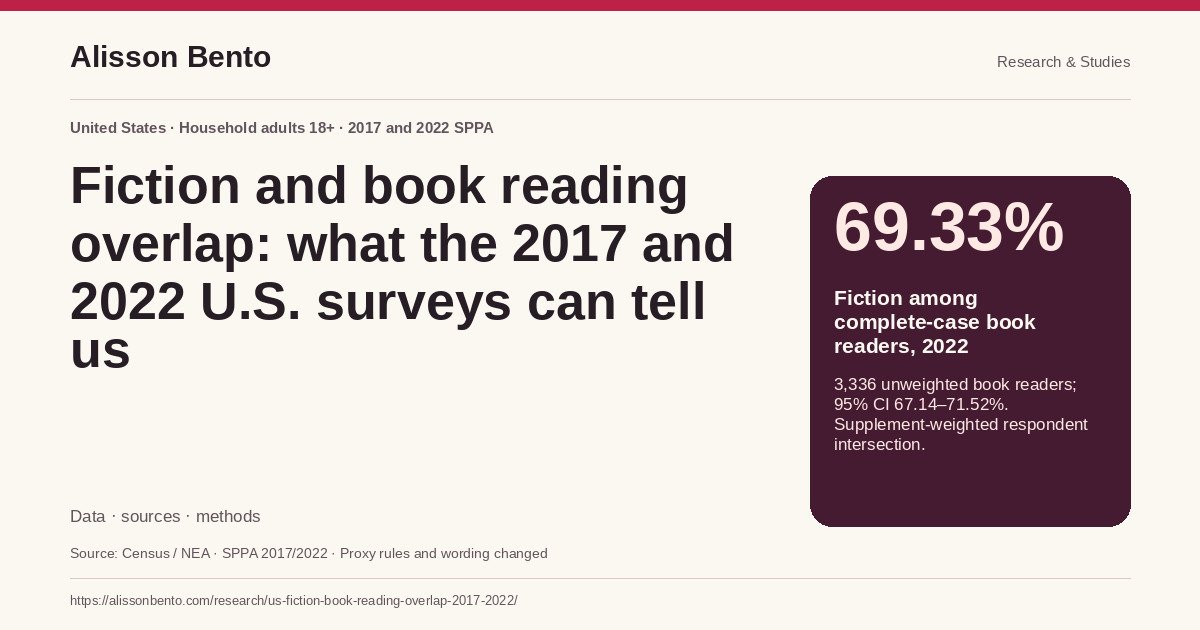
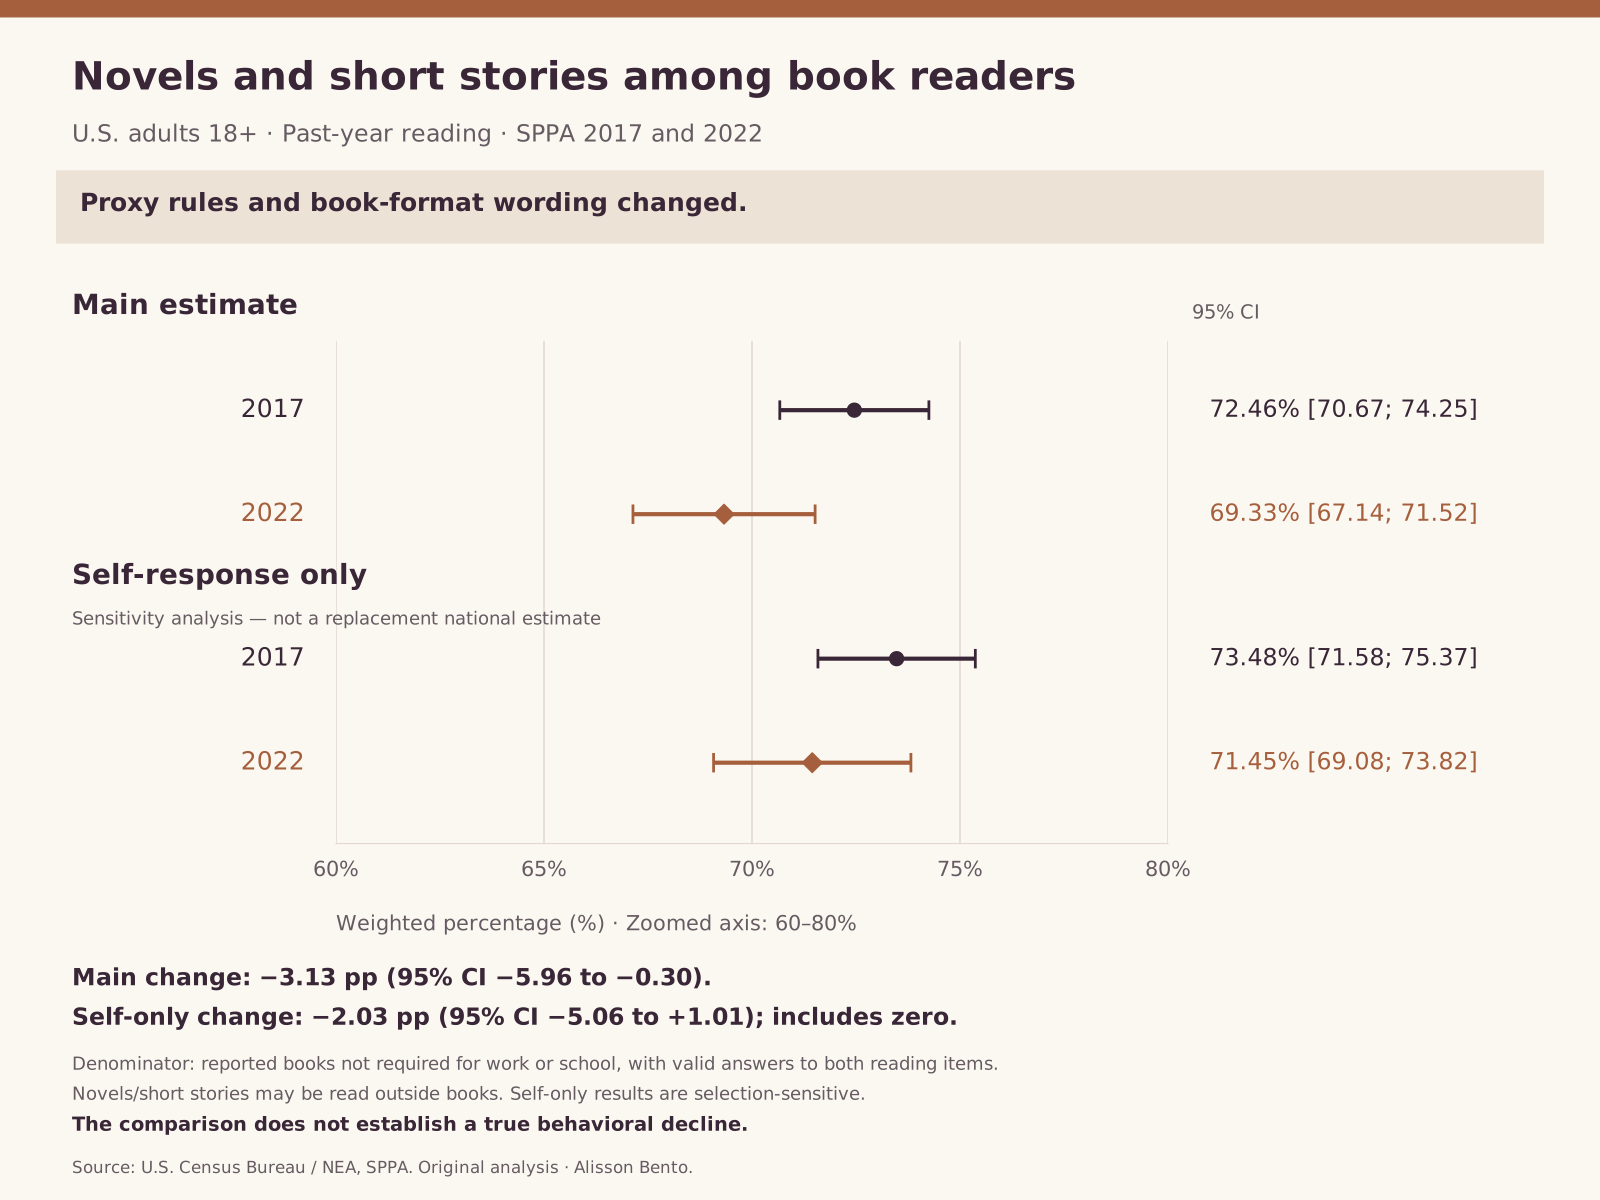
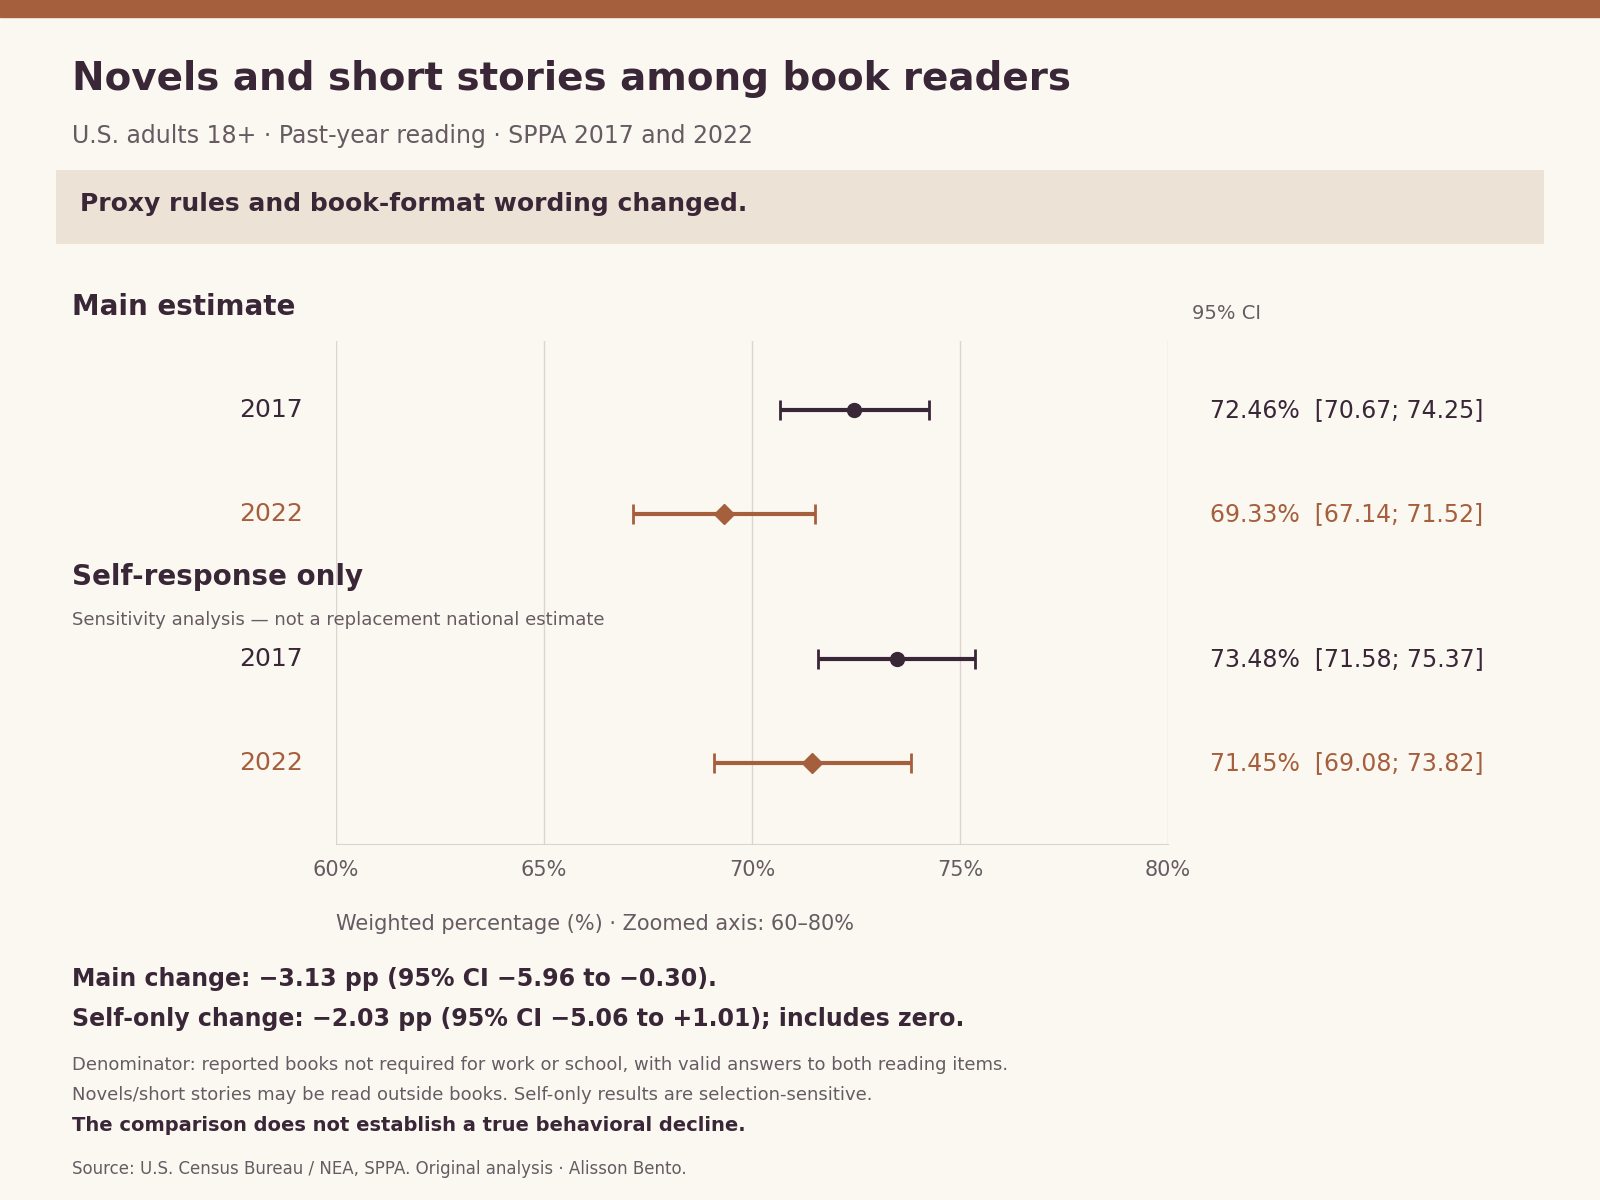
Among book readers with a valid yes-or-no answer to the fiction question, the weighted fiction share was 72.46% in 2017 and 69.33% in 2022. The corresponding unweighted denominators were 4,813 and 3,336 people. In those samples, 3,561 and 2,372 respondents respectively reported both activities. The 95% confidence intervals were 70.67% to 74.25% for 2017 and 67.14% to 71.52% for 2022. These intervals use the supplied supplement replicate weights, rather than assuming that every respondent was independently sampled with equal probability.
The overall difference was minus 3.13 percentage points, with a 95% confidence interval from minus 5.96 to minus 0.30. That is a descriptive difference between the two weighted survey estimates. It should not be presented as an unqualified decline in people's underlying behavior. Proxy eligibility changed, the share of proxy responses increased, and the book wording gained an electronic-format clarification. In a self-response-only sensitivity analysis, the difference was minus 2.03 points and its interval included zero. Any summary of the overall comparison needs this qualification beside the result. An estimate can be arithmetically sound while its interpretation across survey waves remains limited by how the answers were collected.
Why dividing headline percentages gives the wrong answer
A conditional percentage requires the number of people who satisfy both conditions. Dividing the percentage reporting fiction by the percentage reporting books would work only if every fiction reader also belonged to the book-reading group and the denominators otherwise matched. Neither condition should be assumed from the labels. In these data, some respondents explicitly answer no to books and yes to novels or short stories. The questionnaire allows this because stories can be read outside books. The correct numerator for fiction among book readers is therefore the weighted intersection of the two yes responses.
The observed responses make the issue concrete. Among non-book readers with valid answers to both questions, 7.92% reported fiction in 2017 and 7.65% did so in 2022. These people contribute to general fiction prevalence but must not enter a numerator describing fiction within the book-reading public. The public data tables retain both conditional measures so that readers can inspect this distinction. They should not be added together: each has a different denominator. This is also why broad literary reading, which may combine novels, stories, poetry and plays, cannot automatically stand in for this study's fiction measure. Each proposed ratio needs its own respondent-level set definition before any calculation is meaningful.
Proxy responses materially affect the interpretation
The questionnaire instructions show a change in when interviewers could accept answers on someone else's behalf. The 2017 instruction restricted proxy use to specified callback, closeout or household-irritation circumstances. The 2022 instruction allowed a proxy when the respondent was unavailable. Within the complete-case book-reader group used here, the weighted proxy-response share increased from 19.60% to 28.22%. Three book-reader complete cases in 2022 had an unknown proxy flag and remain in the overall estimate. Changes in response mode and respondent availability can influence a comparison even when the substantive reading questions appear similar.
Restricting the calculation to self responses gives fiction shares of 73.48% in 2017 and 71.45% in 2022. The self-response denominators are 4,124 and 2,660 people. The difference of minus 2.03 percentage points has a 95% interval from minus 5.06 to plus 1.01, so this sensitivity does not distinguish the change from zero at that confidence level. Self-only estimates are not automatically better population estimates: people available to answer for themselves may differ from people represented by proxies. The sensitivity instead identifies a real interpretive limitation. The data do not tell us how much of the overall difference comes from behavior, questionnaire wording, response mode, sample composition or other unmeasured factors.
Age differences are descriptive, not generational diagnoses
The age table applies the same within-book-reader calculation to seven age bands, from eighteen to twenty-four through seventy-five and older. This keeps the comparison focused on people who reported book reading rather than allowing the prevalence of book reading itself to define the result. The estimates do not follow a birth cohort. Someone in a given age band in 2017 may have moved into another band by 2022, and the survey samples are different. Labels such as Generation Z would introduce a new definition that this analysis has not established.
The youngest group's fiction share was 70.84% in 2017 and 63.81% in 2022, but its change interval was wide and included zero. Its 2022 denominator was only 183 complete-case book readers. The age sixty-five to seventy-four group had estimates of 75.87% and 67.51%; that observed contrast also needs the general proxy and wording qualifications. The full table is more useful than a ranking of point estimates because it includes sample sizes and uncertainty. Several age groups show different numerical directions, and small differences should not be treated as reliable separations. No correction for multiple subgroup comparisons has been applied, so age-specific contrasts are exploratory rather than a collection of independently confirmed findings about how generations read.
Education describes the sample, not the effect of schooling
The education table groups respondents by reported educational attainment: less than high school, high-school graduate, some college or an associate degree, bachelor's degree, and graduate education. Within each group, the denominator remains people reporting books and answering the fiction question. This differs from asking whether people with more education are more likely to read any book at all. Conditioning on book reading deliberately narrows the question, and the resulting association cannot be generalized into an effect of schooling on the entire adult population.
In 2022, the within-reader fiction estimates ranged from 58.85% among respondents below high-school completion to 76.33% among those with graduate education. The first estimate rests on 112 complete-case book readers and has greater uncertainty than the larger groups. The some-college or associate-degree category had estimates of 73.05% in 2017 and 64.00% in 2022, an exploratory numerical difference that should not be converted into a claim about particular courses, institutions or reading skills. Age, household circumstances, income, occupation and response mode can differ across education groups. This study does not fit a causal model or isolate their contributions. The tables describe observed survey associations and provide enough detail to discourage confident explanations that the available measures cannot test.
A limited check on changes in reader composition
The mix of ages and educational qualifications among book readers can change between surveys. To examine that issue descriptively, the supplementary calculations hold one distribution at a time to the 2017 complete-case book-reader composition. Age standardization applies the same 2017 age-group shares to the within-age estimates from each wave. Education standardization repeats the exercise with education groups. The two adjustments answer separate questions; they do not jointly control for age and education and do not account for all possible compositional differences.
With the 2017 age distribution used as the reference, the 2022 fiction share is 69.36%, close to the unadjusted 69.33%. With the 2017 education distribution used instead, it is 68.89%. These calculations suggest that either single compositional adjustment, on its own, does not erase the numerical overall contrast. They do not resolve the changed proxy instructions or book wording. Their reported standard errors treat the reference shares as fixed even though those shares were estimated from a survey. For that reason, the standardized outputs are presented as descriptive sensitivity results, not as a new adjusted significance test. An unconditional uncertainty analysis would also need to account for estimation of the reference distribution and the relevant covariance structure.
Missing fiction answers remain visible
The main denominator excludes book readers whose fiction answer is missing, refused or unknown. It does not recode those answers as no. There were 4,848 observed book readers in 2017, including thirty-five without a valid fiction answer, and 3,359 in 2022, including twenty-three without one. In weighted terms, missing fiction responses represented 1.38% and 0.97% of observed book readers. Structural skips associated with the survey's other core are kept distinct from these item-response exclusions; people who were not asked a question are not evidence of nonparticipation.
A simple sensitivity check assigns all missing fiction answers first to no and then to yes. The resulting bounds are 71.46% to 72.84% in 2017 and 68.66% to 69.62% in 2022. These ranges show the maximum effect of the observed fiction-item missingness under those assignments. They are not confidence intervals and do not address missing book responses, survey nonresponse or inaccurate reporting. Requiring valid answers to both questions also means that a marginal percentage calculated from this analytic sample can differ from an official publication using a different response denominator. Such differences should be explained, not silently corrected to make an original calculation resemble a published rounded headline.
How weights and confidence intervals were calculated
Both reading variables belong to Core One in each survey. The calculation uses the SPPA supplement weight rather than a general labor-force weight. For each estimate, the weighted number of people satisfying the numerator is divided by the weighted number satisfying its denominator. The core-specific population scaling factor cancels in this ratio, as does the common implied-decimal scaling in the downloaded weight fields. This study reports percentages and sample counts, not estimated national counts of people. Diagnostic raw weight sums in the validation file must not be displayed as population totals.
Uncertainty is calculated by repeating the entire ratio with each of the 160 supplied supplement replicate weights. The variance is four divided by 160 times the sum of squared differences between replicate estimates and the full-sample estimate. Normal intervals use 1.96 standard errors on each side. Cross-wave differences use the square root of the sum of the two estimated variances, treating the surveys five years apart as independent cross-sections. An independent implementation reproduced the overall results and all twenty-four age and education cells for the main conditional measure, including sample counts and standard errors. Replication checks arithmetic and coding; it cannot remove recall error, social desirability, proxy uncertainty or other nonsampling bias.
What this adds to other reading statistics
Time-use diaries, book-sales totals and annual participation surveys answer different questions. A diary can show whether reading happened on a particular day and how long it lasted. A sales series records transactions under its own coverage rules. The SPPA asks about participation over twelve months and permits both self and proxy responses. The present analysis therefore complements a reading-days study without supplying another version of the same metric. A respondent can report one fiction encounter during the year while recording no reading on a particular diary day, with no contradiction between the two observations.
For libraries, book groups and researchers, the useful contribution is a defensible denominator and an account of how definitions shape the answer. The non-fiction-reporting remainder among book readers should not be described as an untapped sales audience. Some people may prefer other material, encounter fiction without identifying it that way, or simply report imperfectly. The survey does not ask whether they want more fiction, would buy a recommended book, or would respond to a campaign. Similarly, reading participation says nothing here about literary quality, comprehension or personal worth. Practical use starts with the observed question and population, rather than turning a conditional percentage into a marketing or cultural judgment that the source cannot support.
Sources, reproducibility and responsible reuse
The source files were downloaded directly from the Census Bureau's public 2017 and 2022 SPPA data pages. These routes provided the observations, replicate weights and technical documentation without an account, institutional membership or an API key. Official NEA reports supplied methodological context. Source URLs, downloaded byte lengths and cryptographic hashes are retained in the manifest so that another analyst can identify the exact inputs. The public reproduction scripts fetch those official files into a local working directory and calculate the published aggregates. Downloading source data for reproduction is separate from redistributing it on this website.
Only aggregate results, methods, source references and code belong in the public study package. The raw respondent records and replicate-weight files remain outside the publication repository. Anyone reusing a table should retain the survey years, adult household population, conditional denominator, uncertainty and proxy/wording caveat. The substantive conclusions apply to civilian noninstitutionalized household adults aged eighteen and older, not children or residents of institutions. The results are an original secondary analysis and do not imply endorsement by the Census Bureau or the National Endowment for the Arts. Future survey releases may offer a new comparison, but they should be checked for question and collection changes before being appended to this series. Reproducibility includes preserving those interpretive limits as well as reproducing the numbers.
Novels and short stories among book readers
U.S. adults 18+ · Past-year reading · SPPA 2017 and 2022. Point estimate and 95% confidence interval.
Full chart and source
Scroll horizontally to inspect the chart. ↔
Chart and values
Scroll horizontally to see all columns.
| Year | Response scope | Denominator n | Both yes n | Weighted percent | 95% CI lower | 95% CI upper |
|---|---|---|---|---|---|---|
| 2017 | All responses | 4813 | 3561 | 72.46 | 70.67 | 74.25 |
| 2022 | All responses | 3336 | 2372 | 69.33 | 67.14 | 71.52 |
| 2017 | Self responses only | 4124 | 3085 | 73.48 | 71.58 | 75.37 |
| 2022 | Self responses only | 2660 | 1919 | 71.45 | 69.08 | 73.82 |
Conditional on reported books and a valid fiction answer; weighted estimates, unweighted sample counts. Proxy instructions and book wording changed. Self-only change confidence interval includes zero; the all-response comparison is not a causal behavioral estimate.
Data & downloads
Scroll horizontally to see all columns.
| Year | Response scope | Denominator n | Both yes n | Weighted percent | 95% CI lower | 95% CI upper |
|---|---|---|---|---|---|---|
| 2017 | All responses | 4813 | 3561 | 72.46 | 70.67 | 74.25 |
| 2022 | All responses | 3336 | 2372 | 69.33 | 67.14 | 71.52 |
| 2017 | Self responses only | 4124 | 3085 | 73.48 | 71.58 | 75.37 |
| 2022 | Self responses only | 2660 | 1919 | 71.45 | 69.08 | 73.82 |
Conditional on reported books and a valid fiction answer; weighted estimates, unweighted sample counts. Proxy instructions and book wording changed. Self-only change confidence interval includes zero; the all-response comparison is not a causal behavioral estimate.
Scroll horizontally to see all columns.
| Year | Group | Denominator n | Both yes n | Weighted percent | 95% CI lower | 95% CI upper |
|---|---|---|---|---|---|---|
| 2017 | 18-24 | 295 | 219 | 70.84 | 64.34 | 77.34 |
| 2017 | 25-34 | 808 | 596 | 73.62 | 69.82 | 77.43 |
| 2017 | 35-44 | 769 | 571 | 72.58 | 68.61 | 76.56 |
| 2017 | 45-54 | 702 | 504 | 70.64 | 66.52 | 74.77 |
| 2017 | 55-64 | 875 | 650 | 71.60 | 67.88 | 75.32 |
| 2017 | 65-74 | 823 | 622 | 75.87 | 71.79 | 79.95 |
| 2017 | 75+ | 541 | 399 | 71.58 | 66.76 | 76.40 |
| 2022 | 18-24 | 183 | 121 | 63.81 | 53.84 | 73.79 |
| 2022 | 25-34 | 515 | 380 | 73.48 | 68.92 | 78.03 |
| 2022 | 35-44 | 578 | 428 | 66.79 | 61.36 | 72.21 |
| 2022 | 45-54 | 474 | 339 | 74.28 | 69.97 | 78.59 |
| 2022 | 55-64 | 526 | 358 | 67.56 | 62.34 | 72.78 |
| 2022 | 65-74 | 634 | 448 | 67.51 | 62.75 | 72.26 |
| 2022 | 75+ | 426 | 298 | 69.17 | 63.61 | 74.73 |
Exploratory complete-case subgroup estimates, all response modes. No multiple-comparison adjustment. Preserve sample sizes, intervals and cross-wave proxy/wording limitations.
Scroll horizontally to see all columns.
| Year | Group | Denominator n | Both yes n | Weighted percent | 95% CI lower | 95% CI upper |
|---|---|---|---|---|---|---|
| 2017 | Less than HS | 221 | 115 | 55.90 | 46.97 | 64.82 |
| 2017 | HS graduate | 1010 | 679 | 65.21 | 61.42 | 69.00 |
| 2017 | Some college/associate | 1383 | 1031 | 73.05 | 70.10 | 76.00 |
| 2017 | Bachelor | 1307 | 1009 | 76.41 | 73.33 | 79.50 |
| 2017 | Graduate | 892 | 727 | 79.45 | 76.13 | 82.78 |
| 2022 | Less than HS | 112 | 60 | 58.85 | 47.06 | 70.65 |
| 2022 | HS graduate | 553 | 349 | 63.25 | 57.03 | 69.46 |
| 2022 | Some college/associate | 948 | 646 | 64.00 | 59.79 | 68.20 |
| 2022 | Bachelor | 1005 | 764 | 75.80 | 72.48 | 79.12 |
| 2022 | Graduate | 718 | 553 | 76.33 | 72.89 | 79.77 |
Exploratory complete-case subgroup estimates, all response modes. No multiple-comparison adjustment. Preserve sample sizes, intervals and cross-wave proxy/wording limitations.
Evidence & method
How we calculated it
- Original secondary analysis of actual Census SPPA public-use files for July 2017 and July 2022. Both reading items belong to Core 1; adult records require age at least 18 and positive supplement weight.
- The primary numerator is PEC1Q14A=1 and PEC1Q15A=1. Its denominator is PEC1Q14A=1 and PEC1Q15A in {1,2}. Missing fiction answers are excluded, not treated as No. Fiction and book sets are not assumed nested.
- PWSUPWGT is the point weight. Each conditional ratio is recomputed using 160 matched supplement replicate weights; variance equals 4/160 times the squared-deviation sum. Normal 95% intervals use 1.96 standard errors. Independent cross-wave variances are added for change intervals.
- PUNXTPR3 identifies self/proxy sensitivity groups. Separate one-dimensional standardizations use fixed 2017 complete-case book-reader age or education shares; they are descriptive, not joint adjustments or unconditional adjusted inference.
- Independent raw-file implementation reproduced the overall estimates and all 24 age/education main-metric cells to tolerance 1e-9. Study design and checks were developed during this analysis; this is not a prospectively preregistered study.
What the data cannot tell us
- The proxy-response instruction became more permissive in 2022, and proxy share increased. The self-only change interval includes zero. Do not interpret the overall contrast as a causal or measurement-invariant behavioral decline.
- The 2022 book question explicitly mentions print/electronic formats, whereas the 2017 instrument includes religious-text clarification. Fiction includes material outside books and does not repeat the work/school exclusion. Listening questions are not added.
- Annual recall, proxy knowledge, nonresponse and social desirability can bias estimates. Replicate intervals do not measure all nonsampling bias. Coverage is civilian noninstitutionalized household adults aged 18+, not all residents.
- Small subgroup estimates are imprecise; contrasts are exploratory without multiplicity correction. Age bands are not generations. Education associations are not schooling effects.
- No purchase intent, romance readership, book completion, duration, reading quality or marketing opportunity is measured. This is one original study with translated editions, not separate studies by subgroup or language.
Original sources
- jul22pub.csv
Census 2022 SPPA public-use CSV: respondent-level book and fiction answers, age, education, self/proxy flag and supplement weight used for the 2022 estimates. Raw respondent records are not included in the public study downloads.
Accessed October 30, 2026
- jul22rep.csv
Census 2022 SPPA replicate-weight CSV: 160 supplement replicate weights, matched by QSTNUM and OCCURNUM, support ratio standard errors. Replicate zero is checked against the point weight; raw weight values are not population counts.
Accessed October 30, 2026
- jul17pub.zip
Census 2017 SPPA public-use ZIP: fixed-width respondent records provide the 2017 answers and characteristics. The fiction field occupies positions 1050–1051; its layout must not be assumed identical to 2022. Raw records remain outside the public study package.
Accessed October 30, 2026
- jul17rep.zip
Census 2017 SPPA replicate-weight ZIP: fixed-width supplement weights are joined to the 2017 records to recompute each conditional ratio across 160 replicates. This file supports uncertainty estimation, not a separate reading measure.
Accessed October 30, 2026
- cpsjul17.pdf
Census 2017 technical documentation: record layouts and questionnaire establish the two reading items and the more restrictive proxy-response instruction. The book question includes a religious-text clarification; fiction includes stories outside books.
Accessed October 30, 2026
- cpsjul22.pdf
Census 2022 technical documentation: questionnaire and weighting instructions establish Core 1 eligibility, supplement weights and the core scaling factor. The book question explicitly mentions print/electronic books, and proxies are allowed when the respondent is unavailable; these changes limit cross-wave interpretation.
Accessed October 30, 2026
- SPPA_Comprehensive_Report_FINAL.pdf
NEA comprehensive report on the 2022 SPPA: official context and published participation estimates, not the respondent-level input to our conditional calculations. Its published marginal percentages must not be divided to estimate fiction among book readers.
Accessed October 30, 2026
- SPPA_2022_Technical_Appendix_FINAL.pdf
NEA 2022 technical appendix: methodological support for replicate-based uncertainty, including BRR with Fay factor 0.5 and mean-squared-error variance. Our 160-replicate ratio variance uses the corresponding factor 4/160.
Accessed October 30, 2026
- cps_ppa_repwgt_jul17.sas
Census 2017 SAS replicate-file layout: documents QSTNUM/OCCURNUM identifiers, replicate fields 0–160 and four implied decimal places. It validates parsing and scaling; it is documentation code, not respondent observations.
Accessed October 30, 2026
- cps_ppa_repwgt_jul22.sas
Census 2022 SAS replicate-file layout: documents the supplement replicate-file structure and weight scaling, providing a check on interpretation of the 2022 CSV weights. Common scaling cancels in ratios; raw weight totals are not reported as numbers of people.
Accessed October 30, 2026
Cite & reuse this study
Alisson Bento. Fiction and book reading overlap: what the 2017 and 2022 U.S. surveys can tell us. Original secondary analysis of Census Bureau / National Endowment for the Arts SPPA public-use data; accessed 30 October 2026. https://alissonbento.com/research/us-fiction-book-reading-overlap-2017-2022/
Original calculations and explanatory presentation: Alisson Bento. Source: U.S. Census Bureau / National Endowment for the Arts, 2017 and 2022 SPPA. Preserve the conditional denominator, survey years, household adult population, intervals and proxy/wording caveats. No official endorsement is implied. Public downloads contain aggregates and code; raw respondent files and replicate weights are not redistributed here. Third-party report illustrations or logos are not licensed by this analysis.
Corrections or editorial questions