
What a shared reporting base changes
A spreadsheet can contain an ebook column and an electronic-audio column without providing an immediately comparable account of the two formats. In the frozen FY2024 Public Libraries Survey file examined here, adding every available value in each column produces an e-audio proportion of 43.645% of the combined ebook and e-audio amounts. Restricting both components to the same administrative entities produces 48.119%. The difference is approximately 4.474 percentage points, created by a reporting-base choice within one file rather than by a change in library use over time.
Neither figure is an estimate of the audiobook share of the American reading market. The e-audio definition includes music as well as audiobooks, the denominator excludes electronic serials and video, and some eligible entities do not supply usable figures. The first calculation also combines components from unequal sets of reporters. Its purpose here is to demonstrate the consequence of that mismatch, not to recommend it as a statistic.
This study is an audit of a released reporting structure. It asks which comparisons are possible before interpreting what people borrowed. Its practical contribution is a complete, reproducible account of the relevant missing values, common reporting cohorts and computable totals. Library staff, researchers and journalists can use it to check the base of a chart before giving the chart a larger meaning.
The file contains systems, not a list of individual branches
The source is the FY2024 Public Libraries Survey public-use administrative-entity file, collected by the Institute of Museum and Library Services. An administrative entity is the agency responsible for library service in a jurisdiction. It may operate one outlet or many. A record therefore does not necessarily represent one building, and an equal-weight average across records is not an equal-weight average across branches or people.
The saved source archive contains 9,249 administrative-entity records. The main audit applies a declared frame: the fifty states and the District of Columbia, entities marked as meeting the FSCS public-library definition, and entities not marked temporarily closed. Applying those exclusions in that order removes 44 records outside the geographic frame, 171 records not meeting the definition and four temporarily closed records, leaving 9,030 eligible records. These are mutually exclusive steps in this funnel. They should not be mixed with the documentation’s separate count of all five temporarily closed records in the complete file.
The source also supplies an outlet file, but this analysis does not join it to the administrative entities. It does not match records to external directories or attempt to identify protected information. Expenditure fields, salaries, addresses, telephone numbers and individual library names are outside the calculation. The public outputs contain aggregates and the code needed to reproduce them from the exact local source archive.
The reporting label is FY2024, but the source explains that fiscal periods differ among states and sometimes among local jurisdictions. The figures are not a perfectly synchronized January-to-December observation of the entire country. They are transactions reported under the survey’s fiscal-year conventions, not a count of unique borrowers, completed books or distinct titles.
A reported zero is a value; a missing value is a different state
Seven fields are relevant to the audit: ebook, e-audio, e-serial and e-video circulation; the electronic-material total; physical circulation; and the overall circulation total. Nonnegative integers are released values, including zero. The source’s negative codes are retained as distinct states. A missing response is not converted to zero, and a temporarily closed, not-applicable or suppressed value is not treated as an ordinary observation.
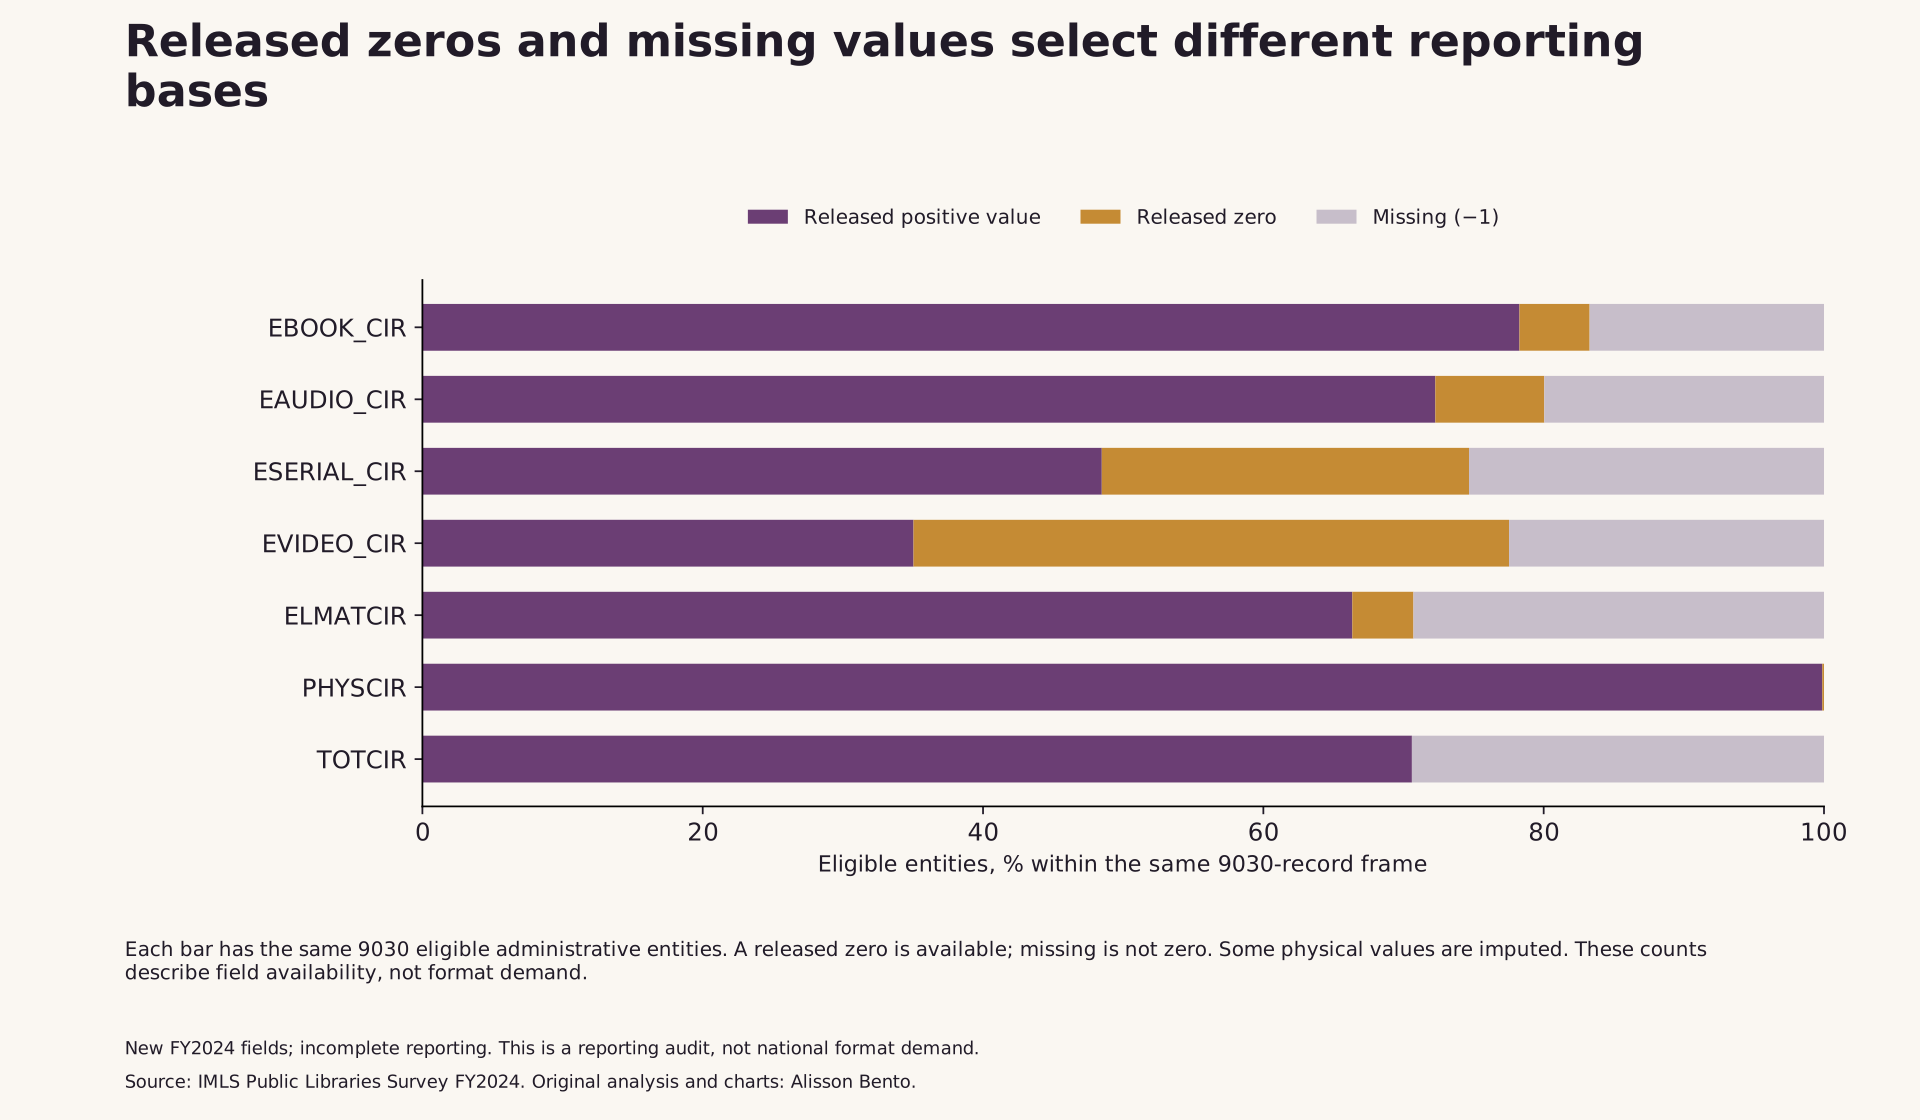
Within the main 9,030-record frame, ebook circulation is available for 7,520 entities and e-audio circulation for 7,228. The corresponding counts are 6,743 for e-serials and 7,001 for e-video. The electronic-material total is available for 6,385 entities, while the overall total is available for 6,375. Physical circulation has nonnegative released values for all 9,030 eligible entities, although some of those physical values were imputed.
Those figures already show why the presence of seven column headings is not enough. Each heading can select a different set of entities. A chart assembled from separate column sums may consequently compare different reporting bases even if every arithmetic operation is correct. The missingness is also uneven across the component fields: knowing that an entity supplied an ebook figure does not establish that it supplied an electronic-serial figure.
Zeros deserve their own place in the table. There are 452 reported ebook zeros and 702 reported e-audio zeros in the main frame. The e-video field has 3,837 zeros. Treating those values as missing would discard explicit reports. Treating the missing values as zeros would invent reports. Both operations can change the base and interpretation of a comparison, so the download retains positive, zero and unavailable counts separately.
The source documentation already provides distributions and valid-response counts for individual fields. This analysis credits that work. Its additional question concerns the intersections: which entities supply the fields together, and what changes when a comparison moves from separate available columns to a shared set of reporters?
Three calculations that answer different reporting questions
The first calculation uses every nonnegative ebook value and every nonnegative e-audio value in the eligible frame, independently. The e-audio sum is divided by the sum of those two available component totals. That produces 43.645%. Because the two components draw on different sets of entities, this is explicitly labelled the mismatched-base illustration. It is not a common-cohort estimate.
The second calculation requires an entity to have both component values. There are 7,193 such entities. Of these, 406 report a zero for both components, leaving 6,787 with a positive combined ebook-and-e-audio amount. The matched e-audio sum is 244,311,306 and the matched combined amount is 507,722,602. Their ratio is 48.119%. Zero-pair records contribute nothing to either pooled sum, but they remain visible in the cohort count rather than disappearing without explanation.
The third calculation requires all four electronic-format component fields to be available, while keeping the same two-format ratio. This selects 6,385 entities, including 396 zero ebook-and-e-audio pairs and 5,989 positive pairs. Within that more restrictive cohort, the e-audio amount divided by the combined ebook-and-e-audio amount is 48.280%.
The first-to-second difference is about 4.474 percentage points. The second-to-third difference is much smaller, about 0.161 points. Both are results of the declared selection rules on this frozen file. They do not show that missing reporting always has a large effect, that requiring more fields always improves an estimate, or that the final number is the true national mix. In this example, imposing a common pair matters more to the displayed ratio than additionally requiring the other two format fields.
The distinction matters when a table is repurposed. An author discussing ebook and audio use might naturally select two columns. A library analyst preparing a four-format chart might select all four. A journalist might instead copy sums from separate summaries. These are different analytical choices. The chart should make the reporting base visible so that readers can recognize which choice was made.
A pooled ratio is not the average entity’s ratio
Even after choosing the same reporting cohort, two familiar averages answer different questions. The pooled calculation adds the two component counts across entities before dividing. Entities contributing more reported transactions consequently influence the result more strongly. The mean of within-entity ratios instead gives each entity with a positive two-format amount the same weight.
For the matched-pair cohort, the pooled e-audio proportion is 48.119%, while the mean of the 6,787 positive within-entity proportions is 48.923%. For the all-four-known cohort, the corresponding figures are 48.280% and 49.047%. These differences are descriptive consequences of the aggregation rule. They are not confidence intervals and do not identify the behaviour of a typical borrower.
An entity operating a large multi-outlet system is still one entity in the equal-weight mean. A small single-outlet entity is also one entity. Neither calculation weights people equally, and neither incorporates unavailable values. A statement about the average system therefore needs a different label from a statement about the composition of the selected reported transaction amounts.
The public recipe retains the pooled numerator and denominator exactly. It calculates the within-entity mean using rational arithmetic internally and supplies a declared decimal display. The extra numerical precision supports reproduction; it does not make the source a more precise measure of national behaviour or overcome the missing reporting.
Complete components do not make every total available
All four electronic-format components are available together for 6,385 eligible entities, or 70.709% of the main frame. In every one of those records, their sum equals the released electronic-material total. This is a diagnostic comparison of the actual public cells. The frozen user guide's definition of the electronic-material total does not explicitly enumerate a four-term equation. The audit therefore reports the observed equality without attributing a more detailed rule to that document than it states.
The guide does explicitly define overall circulation as electronic-material use plus physical circulation. All three released values are available together for 6,375 eligible entities. The documented relationship holds exactly in those 6,375 computable records. No tolerance adjustment, rounding repair or replacement of a source value is needed for that comparison.
There is still an important difference between the two cohorts. Ten entities have all four electronic components and an electronic total available but lack a released overall total. The audit does not fill that missing total by subtraction or addition. A reader can recognize that the fields needed for a possible arithmetic operation exist without treating the resulting calculated replacement as an observed source value.
Exact agreement on the computable records is reassuring about that particular arithmetic relationship. It does not prove that every transaction was reported correctly, that every provider used identical definitions, or that unavailable records would have the same format composition. Nor does it justify identifying a library as inaccurate when a relationship cannot be checked. Unavailable and inconsistent are different findings.
Reporting cohorts also have different administrative composition
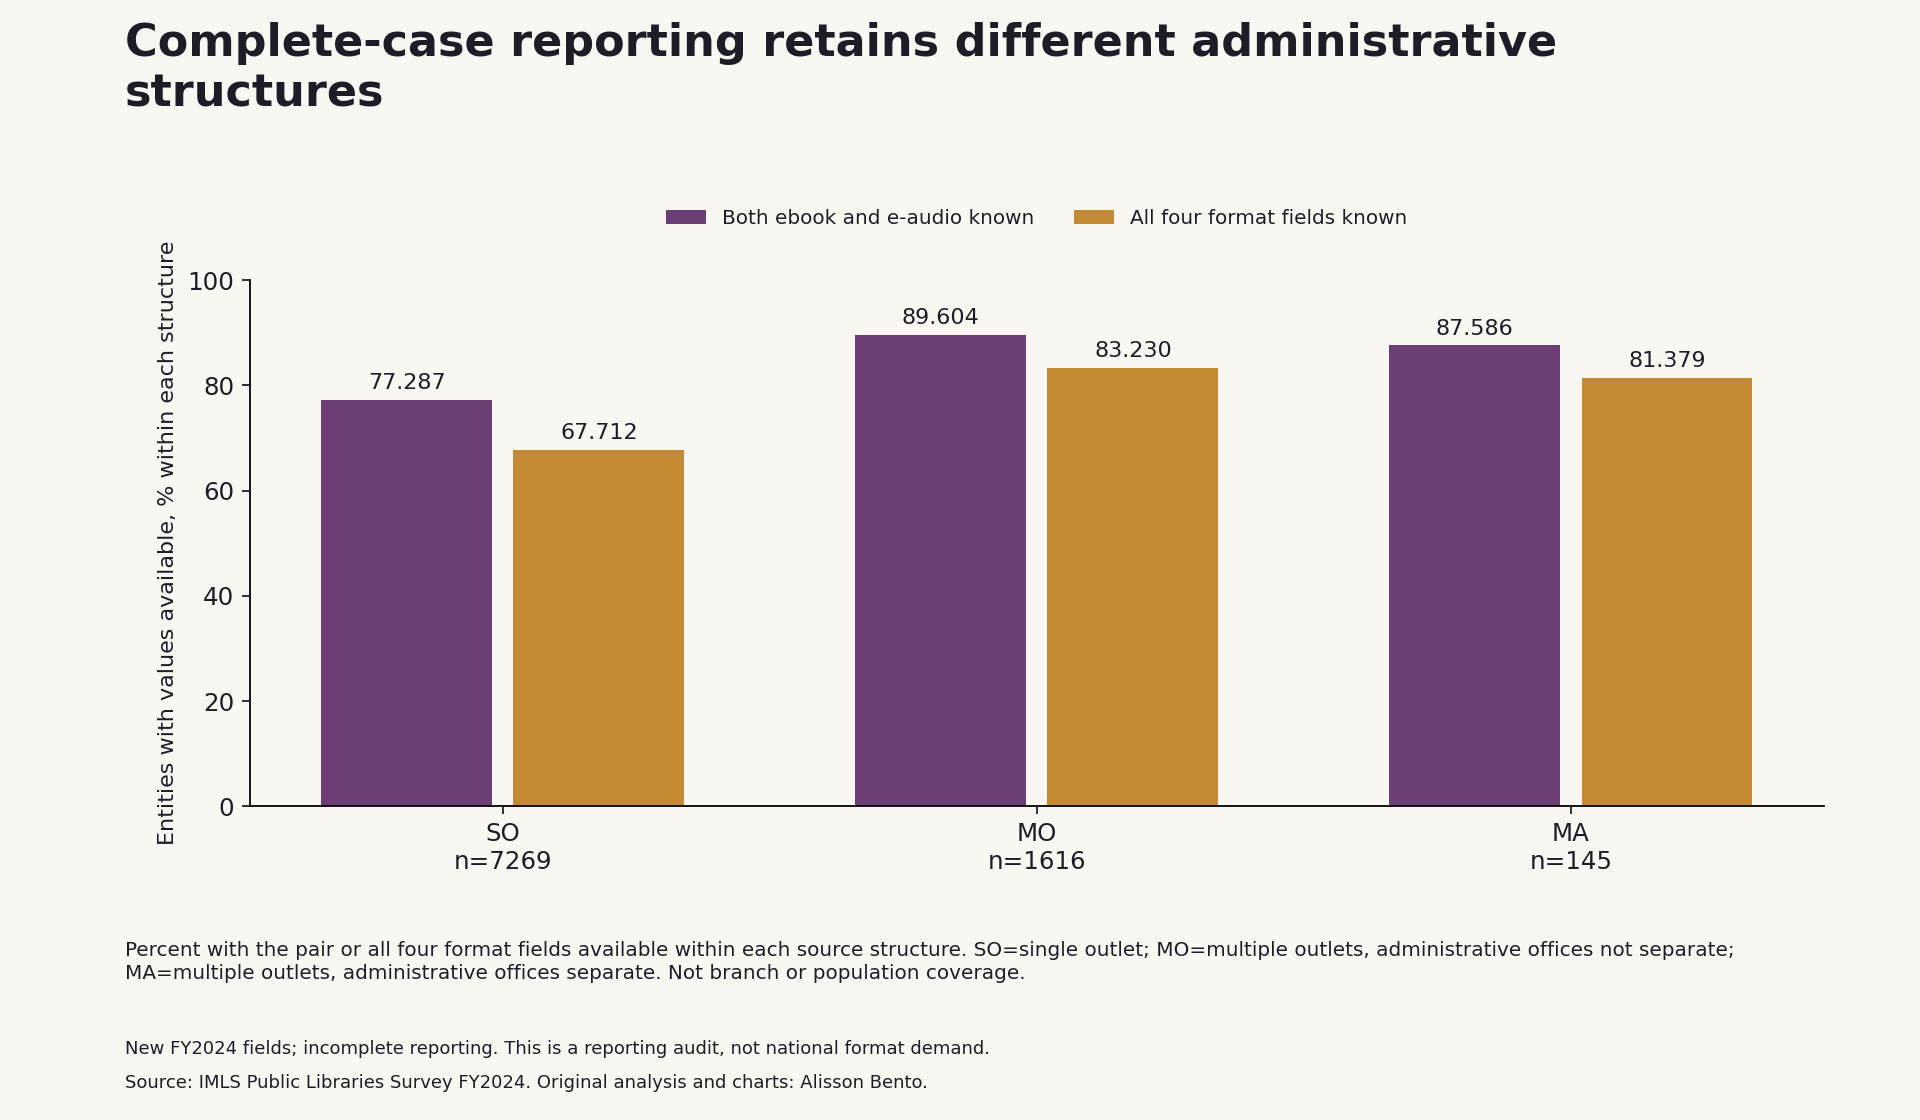
The common-base requirement changes which administrative structures remain in the calculation. Among 7,269 eligible single-outlet administrative entities, 77.287% supply the ebook-and-e-audio pair and 67.712% supply all four format components. For 1,616 multi-outlet entities whose administrative offices are not separate, the corresponding proportions are 89.604% and 83.230%. Among 145 multi-outlet entities with separate administrative offices, they are 87.586% and 81.379%.
These are reporting-completeness comparisons within the three source-defined structure categories. They are not estimates of the number of outlets retained, the share of residents covered, or the amount of reading taking place. An entity can operate many branches, and the structure categories are not equivalent to rural, suburban and urban populations.
The comparison does not explain why a particular entity reports a field. State reporting systems, provider arrangements, definitions, local processes and other factors may matter, but this audit does not identify their effects. Its narrower point is that selecting complete records can change the composition of the reporting cohort. Reusing the resulting ratio as if it described the entire eligible frame would conceal that selection.
The file’s imputed label does not apply equally to every field
The archive member used here is the public-use file containing imputed values for eligible variables. That description should not be read as a guarantee that every missing item has been filled. The FY2024 documentation specifically states that the electronic-material total and overall circulation total were not imputed because their underlying source variables changed. It also explains the staged process for adding and revising survey elements.
Table 8 places the new FY2024 format fields in the first year of its displayed timeline, with later stages extending to FY2027. The general process describes trial reporting in its second year. The source also explains that new items are not imputed or included in its regular data tables and research until they have been collected systematically, without further significant definition changes, for three years. This reporting-structure audit does not turn those new fields into mature population-format estimates. It does not relabel FY2024 as the second-year trial stage or present an expected future processing step as something already completed.
In the main frame, 220 physical-circulation values carry an imputation flag beginning with I. The electronic and overall totals carry reported or non-imputed flags rather than I-prefix flags. Removing the records with any of those three I-prefix flags leaves the same 6,375 computable overall-total relationships, all still equal. The exclusion changes the pool of unavailable records; it does not reveal an additional set of observed electronic totals.
Flags must be read alongside values and definitions. In this file, non-imputed flags accompany missing electronic and overall totals within the eligible state-and-DC frame. The analysis does not convert those flags into zeros or assume that they identify an outlying-area record. A flag describes a processing state; it is not a substitute for the circulation value.
What can be reused, and what remains unanswered
The useful reporting statement is bounded: in this exact FY2024 public-use file and declared eligible frame, separate available component sums and a common two-format reporting cohort produce noticeably different e-audio proportions within the ebook-and-e-audio comparison. The result is a warning about the base of a calculation, not evidence of growth, decline, format preference or a national audiobook market share.
E-audio includes music, and ebooks include electronic comics under the source definitions. Circulation counts transactions rather than people. Fiscal periods vary, some fields are new, and reporting is incomplete. This single-release audit measures neither recovery since FY2019 nor change over time.
Reproduction takes the exact source ZIP as a local input. The program makes no network requests and stops if its fingerprint differs. It extracts only the declared circulation, frame, structure and flag fields, then writes aggregate results. The official source locations and original acquisition date are documented, but no claim is made that a later download will remain available or identical.
When reusing a chart, retain the fiscal-year label, reporting-cohort definition, e-audio scope and missing-value treatment. When using the code, preserve the distinction between a mismatched illustration and a coherent common-cohort calculation. The most informative question is not which number looks more compelling. It is whether the numerator, denominator and reporting unit support the statement the chart is being asked to make.
A reporting-base choice moves the two-format ratio
FY2024 released-file audit; main frame 9,030 administrative entities. The separate-column case has unequal reporting bases and is not a common-cohort estimate. E-audio includes music; none is a national audiobook share.
Full chart and source

Scroll horizontally to inspect the chart. ↔
Chart and values
Scroll horizontally to see all columns.
| Case | Ebook reporting entities | E-audio reporting entities | Common positive pairs | Selected e-audio circulation count | Selected ebook circulation count | Pooled two-format e-audio (%) | Mean entity two-format e-audio (%) |
|---|---|---|---|---|---|---|---|
| A | 7,520 | 7,228 | — | 244,711,628 | 315,973,003 | 43.645 | — |
| B | 7,193 | 7,193 | 6,787 | 244,311,306 | 263,411,296 | 48.119 | 48.923 |
| C | 6,385 | 6,385 | 5,989 | 233,923,795 | 250,590,840 | 48.280 | 49.047 |
A: separate available component sums with unequal reporter bases; not a common-cohort estimate. B: both fields known. C: all four format fields known. E-audio includes music. Dashes mean no single-cohort quantity. Pooled percentages divide e-audio by ebook plus e-audio only.

Released zeros and missing values select different reporting bases
Each bar has the same 9,030 eligible administrative entities. A released zero is available; missing is not zero. Some physical values are imputed. These counts describe field availability, not format demand.
Full chart and source
Scroll horizontally to inspect the chart. ↔
Chart and values
Scroll horizontally to see all columns.
| Source field | Frame records | Positive | Released zero | Missing (−1) | Closed (−3) | Not applicable (−4) | Suppressed (−9) | Released nonnegative |
|---|---|---|---|---|---|---|---|---|
| EBOOK_CIR | 9,030 | 7,068 | 452 | 1,510 | 0 | 0 | 0 | 7,520 |
| EAUDIO_CIR | 9,030 | 6,526 | 702 | 1,802 | 0 | 0 | 0 | 7,228 |
| ESERIAL_CIR | 9,030 | 4,377 | 2,366 | 2,287 | 0 | 0 | 0 | 6,743 |
| EVIDEO_CIR | 9,030 | 3,164 | 3,837 | 2,029 | 0 | 0 | 0 | 7,001 |
| ELMATCIR | 9,030 | 5,991 | 394 | 2,645 | 0 | 0 | 0 | 6,385 |
| PHYSCIR | 9,030 | 9,019 | 11 | 0 | 0 | 0 | 0 | 9,030 |
| TOTCIR | 9,030 | 6,375 | 0 | 2,655 | 0 | 0 | 0 | 6,375 |
Same eligible frame of 9,030 entities for every row. A released zero is available; physical values may be reported or imputed. Negative source codes are not zero. No unavailable value is filled.

Complete-case reporting retains different administrative structures
Percent with the pair or all four format fields available within each source structure. SO=single outlet; MO=multiple outlets, administrative offices not separate; MA=multiple outlets, administrative offices separate. Not branch or population coverage.
Full chart and source

Scroll horizontally to inspect the chart. ↔
Chart and values
Scroll horizontally to see all columns.
| Structure code | Frame entities | Pair known | Pair known (%) | All four known | All four known (%) |
|---|---|---|---|---|---|
| SO | 7,269 | 5,618 | 77.287 | 4,922 | 67.712 |
| MO | 1,616 | 1,448 | 89.604 | 1,345 | 83.230 |
| MA | 145 | 127 | 87.586 | 118 | 81.379 |
| Other | 0 | 0 | — | 0 | — |
SO: single outlet; MO: multiple outlets with offices not separate; MA: multiple outlets with separate offices. Percentages use the frame count of each structure, not people or branches. A dash means no defined denominator.
Data & downloads
Scroll horizontally to see all columns.
| Frame step | Records |
|---|---|
| All source administrative-entity records | 9,249 |
| Outside fifty states and DC: excluded | 44 |
| Not marked FSCS public library: excluded | 171 |
| Temporarily closed: excluded | 4 |
| Main eligible administrative-entity frame | 9,030 |
Apply exclusions in this order; counts are mutually exclusive. These are entities, not outlets or people.
Scroll horizontally to see all columns.
| Source field | Frame records | Positive | Released zero | Missing (−1) | Closed (−3) | Not applicable (−4) | Suppressed (−9) | Released nonnegative |
|---|---|---|---|---|---|---|---|---|
| EBOOK_CIR | 9,030 | 7,068 | 452 | 1,510 | 0 | 0 | 0 | 7,520 |
| EAUDIO_CIR | 9,030 | 6,526 | 702 | 1,802 | 0 | 0 | 0 | 7,228 |
| ESERIAL_CIR | 9,030 | 4,377 | 2,366 | 2,287 | 0 | 0 | 0 | 6,743 |
| EVIDEO_CIR | 9,030 | 3,164 | 3,837 | 2,029 | 0 | 0 | 0 | 7,001 |
| ELMATCIR | 9,030 | 5,991 | 394 | 2,645 | 0 | 0 | 0 | 6,385 |
| PHYSCIR | 9,030 | 9,019 | 11 | 0 | 0 | 0 | 0 | 9,030 |
| TOTCIR | 9,030 | 6,375 | 0 | 2,655 | 0 | 0 | 0 | 6,375 |
Same eligible frame of 9,030 entities for every row. A released zero is available; physical values may be reported or imputed. Negative source codes are not zero. No unavailable value is filled.
Scroll horizontally to see all columns.
| Availability pattern | Entities |
|---|---|
| 0000 | 1,422 |
| 0001 | 37 |
| 0010 | 3 |
| 0011 | 13 |
| 0100 | 1 |
| 0101 | 3 |
| 0110 | 0 |
| 0111 | 31 |
| 1000 | 263 |
| 1001 | 13 |
| 1010 | 8 |
| 1011 | 43 |
| 1100 | 72 |
| 1101 | 476 |
| 1110 | 260 |
| 1111 | 6,385 |
Bit order: EBOOK_CIR, EAUDIO_CIR, ESERIAL_CIR, EVIDEO_CIR. A bit of 1 means a nonnegative released value, including a reported zero; a bit of 0 means unavailable. Bits are not circulation values.
Scroll horizontally to see all columns.
| Structure code | Frame entities | Pair known | Pair known (%) | All four known | All four known (%) |
|---|---|---|---|---|---|
| SO | 7,269 | 5,618 | 77.287 | 4,922 | 67.712 |
| MO | 1,616 | 1,448 | 89.604 | 1,345 | 83.230 |
| MA | 145 | 127 | 87.586 | 118 | 81.379 |
| Other | 0 | 0 | — | 0 | — |
SO: single outlet; MO: multiple outlets with offices not separate; MA: multiple outlets with separate offices. Percentages use the frame count of each structure, not people or branches. A dash means no defined denominator.
Scroll horizontally to see all columns.
| Case | Ebook reporting entities | E-audio reporting entities | Common positive pairs | Selected e-audio circulation count | Selected ebook circulation count | Pooled two-format e-audio (%) | Mean entity two-format e-audio (%) |
|---|---|---|---|---|---|---|---|
| A | 7,520 | 7,228 | — | 244,711,628 | 315,973,003 | 43.645 | — |
| B | 7,193 | 7,193 | 6,787 | 244,311,306 | 263,411,296 | 48.119 | 48.923 |
| C | 6,385 | 6,385 | 5,989 | 233,923,795 | 250,590,840 | 48.280 | 49.047 |
A: separate available component sums with unequal reporter bases; not a common-cohort estimate. B: both fields known. C: all four format fields known. E-audio includes music. Dashes mean no single-cohort quantity. Pooled percentages divide e-audio by ebook plus e-audio only.
Scroll horizontally to see all columns.
| Comparison | Frame entities | Computable | Unavailable | Components below total | Equal | Components above total | Largest absolute difference |
|---|---|---|---|---|---|---|---|
| D1 | 9,030 | 6,385 | 2,645 | 0 | 6,385 | 0 | 0 |
| D2 | 9,030 | 6,375 | 2,655 | 0 | 6,375 | 0 | 0 |
| D3 | 8,810 | 6,375 | 2,435 | 0 | 6,375 | 0 | 0 |
D1: four-component sum versus ELMATCIR, diagnostic only. D2: documented electronic plus physical versus overall total. D3: D2 after excluding any I-prefix flag among those three variables. No missing total is replaced. Equality is not proof of complete or accurate reporting.
Scroll horizontally to see all columns.
| Source field | Flag | Entities | I-prefix indicator (1=yes) |
|---|---|---|---|
| ELMATCIR | R_24 | 6,385 | 0 |
| ELMATCIR | U_24 | 2,645 | 0 |
| PHYSCIR | IG20 | 13 | 1 |
| PHYSCIR | IG21 | 20 | 1 |
| PHYSCIR | IG22 | 20 | 1 |
| PHYSCIR | IG23 | 59 | 1 |
| PHYSCIR | IQ24 | 108 | 1 |
| PHYSCIR | R_24 | 8,810 | 0 |
| TOTCIR | R_24 | 6,375 | 0 |
| TOTCIR | U_24 | 2,655 | 0 |
Within the main eligible frame. I-prefix flags identify imputed values. A non-imputed flag does not mean that the associated value is zero or available. These are aggregate flag counts, not identification of individual respondents.
Evidence & method
How we calculated it
- Use the exact already acquired public-use FY2024 AE ZIP, decode its CSV as cp1252 and retain only declared circulation, frame, structure and processing-flag fields. No network requests or external record matching.
- Apply the fixed fifty-states-plus-DC, C_FSCS=Y, non-temporarily-closed frame. Keep nonresponse in the denominator; distinguish positive, zero, missing, closed, not-applicable and suppressed codes.
- Compare separate available component sums with a matched ebook/e-audio cohort and a nested all-four-format-known cohort. Report pooled component ratios and equal-entity mean ratios separately; zero pairs stay visible.
- Enumerate all sixteen component-availability patterns and source-defined administrative structures. Compare computable totals without replacing missing values or identifying errors in individual respondents.
- Source documentation already provides univariate distributions and processing cautions. This is a bounded joint-reporting-base audit with reproducible aggregates, not a demand, recovery or national market-share study.
What the data cannot tell us
- E-audio includes music as well as audiobooks; ebooks include e-comics. The two-format denominator excludes electronic serials and video.
- Administrative entities can operate one or many outlets. Neither ratio weights residents or unique borrowers equally, and reporting cohorts are incomplete.
- FY2024 reporting periods vary. New format fields and changed totals have processing cautions; Table 8 places FY2024 in Year 1, not the Year 2 trial stage. The source defers new items from regular tables and research until three years of systematic collection. Electronic and overall totals were not imputed in this release.
- No missing or suppressed value is converted to zero or reconstructed. Four-component agreement and total agreement are comparisons only on released, computable records.
- No causal interpretation, confidence interval, state ranking, record matching, private-cost reconstruction, FY2019 recovery or national audiobook market share is established.
Original sources
- IMLS Public Libraries Survey FY2024: public-use CSV ZIP
Public-use administrative-entity CSV: released circulation, frame, administrative structure and processing flags; no outlet join or external record matching.
Accessed October 28, 2026
- IMLS Public Libraries Survey FY2024: Data Documentation and User’s Guide
Primary definitions, survey coverage, source status codes, processing cautions and the FY2024 Year 1 timeline. Appendix H already reports univariate distributions.
Accessed October 28, 2026
- IMLS Public Libraries Survey: original survey and release page
Original survey landing page and data release reference, acquired with the ZIP and guide on 28 October 2026.
Accessed October 28, 2026
Cite & reuse this study
Alisson Bento. Ebooks, e-audio and missing totals: reading FY2024 library figures on a shared base. 2026. Original reporting-base audit of the IMLS Public Libraries Survey FY2024 public-use administrative-entity file. https://alissonbento.com/research/us-library-electronic-format-reporting-2024/
Source: IMLS, Public Libraries Survey FY2024. Original analysis and charts: Alisson Bento. Reuse original charts and derived tables with source and analysis attribution, retaining the reporting-cohort and scope notes. Original reproduction code is MIT licensed. No IMLS endorsement, restricted-data access or rights to third-party book content are implied.
Corrections or editorial questions