Which income groups account for reading expenditure?
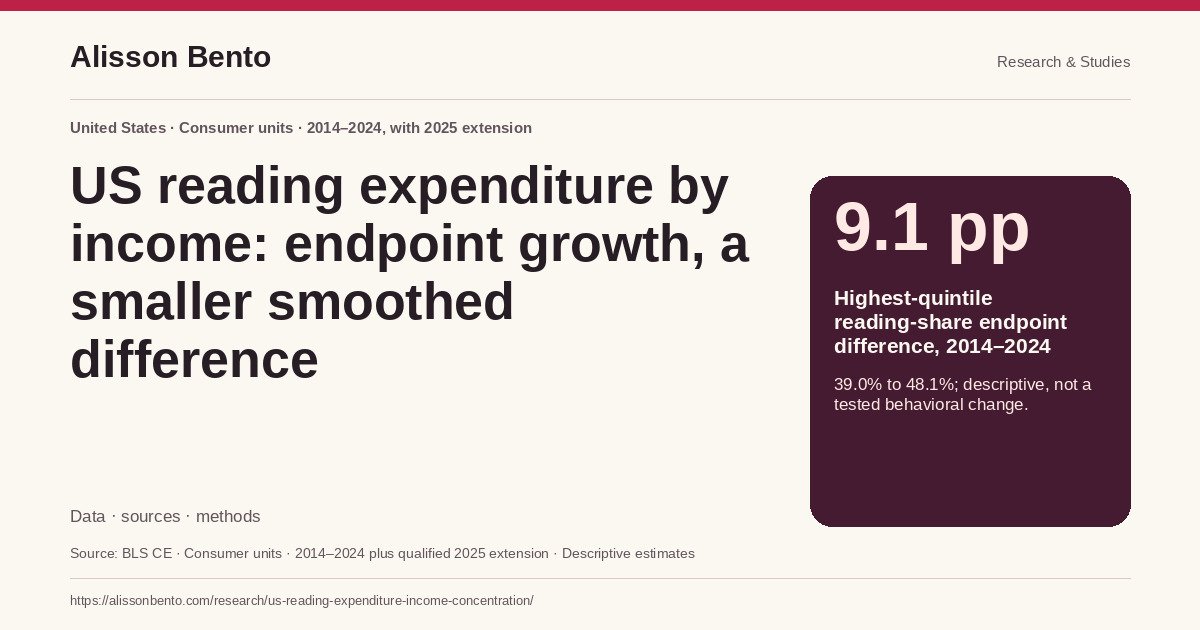
The highest income quintile accounted for 48.1% of estimated US consumer expenditure on Reading in 2024, compared with 39.0% in 2014. That is an increase of 9.1 percentage points between the original study endpoints. The comparison describes the distribution of dollars within a broad survey category. It does not show that the highest-income fifth bought nearly half of all books, read nearly half of all pages, or financed nearly half of publishing revenue. Those would require different measures and different sources.
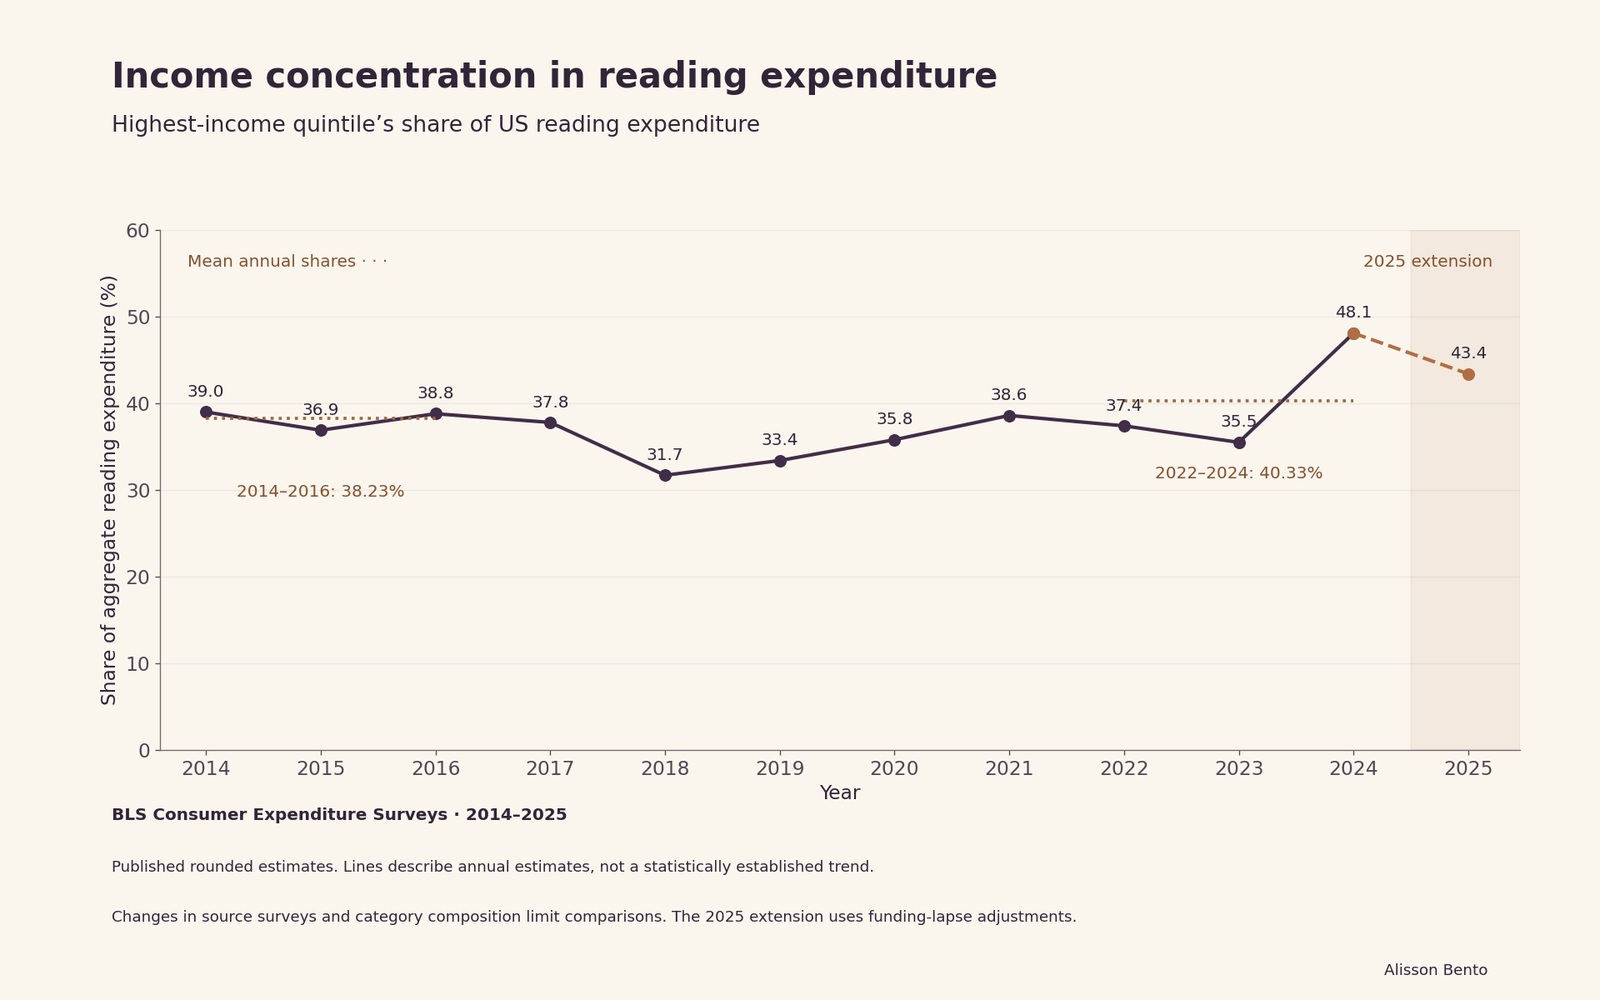
The complete annual record makes the endpoint result more useful and less dramatic. The highest-quintile share did not rise continuously. It reached 31.7% in 2018, remained below its 2014 value through 2023, and increased to 48.1% in 2024. Averaging the first and last three years of the original window gives a much smaller difference. The 2014–2016 average was 38.23%; the 2022–2024 average was 40.33%. The resulting 2.10-point difference should accompany the 9.1-point endpoint comparison whenever the study is summarized. Neither calculation establishes statistical significance or isolates a behavioral change.
Reading is a broader expenditure category than books
The Consumer Expenditure Surveys category Reading includes several kinds of purchases. The BLS glossary describes newspapers, magazines, books, digital reading materials and reference works. Its integration file also places digital book readers within the category. This mixture matters for publishing readers: a change in newspaper expenditure, device purchases or subscriptions can affect the total without indicating an equivalent change in books. There is no print-versus-digital split in the summary rows used here, and no basis for attributing the result to ebooks or to a particular genre.
Textbooks sit within Education rather than the Reading total. Expenditures include gifts, while purchases assigned directly to business purposes are excluded. A gift purchase can therefore contribute to the spending of a consumer unit whose members do not themselves read the item. Free reading, borrowing from libraries, using existing books and time spent reading are outside the measured outcome. This is why the article retains the category name and calls the result expenditure concentration. It is evidence about estimated consumer spending, not a complete account of literary participation, access to knowledge or the commercial publishing market.
The quintiles contain consumer units, not individual readers
BLS organizes the estimates by consumer units, abbreviated CUs. These include families, financially independent individuals and people living together who share major expenses. A CU can contain more than one person, and the income groups can differ in their average size, age composition and number of earners. The comparisons therefore concern spending per consumer unit or shares of expenditure attributable to consumer units. They are not adjusted comparisons between otherwise similar individuals. A larger mean for the highest quintile cannot be interpreted as the same multiple of spending by each person.
Income quintiles are constructed by ranking CUs on income before taxes and applying their survey weights. The groups contain approximately a fifth of the represented population of CUs, rather than a fifth of individual Americans. Counts are not perfectly identical because construction takes place within quarters. Their composition also changes between years. The lowest-income group observed in 2014 is not the same set of families followed into 2024. Income thresholds move, membership changes and estimates are repeated cross-sections. Calling this a longitudinal account of household behavior would go beyond the design. The comparison instead follows the published distribution for each year's income-ranked groups.
The annual record does not support a steady increase
The highest quintile's reading share was 39.0% in 2014, 36.9% in 2015 and 38.8% in 2016. It was 37.8% in 2017, followed by 31.7% in 2018 and 33.4% in 2019. The next observations were 35.8% in 2020, 38.6% in 2021, 37.4% in 2022 and 35.5% in 2023. The 48.1% estimate in 2024 is consequently an unusually high endpoint within this particular window. These values are published survey estimates, not an exact enumeration of all spending, and a sequence of changes should not be read as a tested trend.
Showing every year protects the analysis from a misleading choice of comparison dates. Beginning at the lower 2018 estimate would make the increase to 2024 appear larger; stopping in 2023 would give a different endpoint story. The original 2014–2024 question is preserved rather than replaced after inspecting the outcomes. The annual table supplies the surrounding evidence. It also helps distinguish an endpoint contrast from a persistent pattern. Explanations involving prices, technology, publisher strategy or the pandemic would require additional evidence and an identification strategy. The dates alone do not establish why the estimates differ.
Three-year averages change the scale of the conclusion
The smoothing calculation gives equal weight to each published annual share. For the beginning of the original observation window, it averages 39.0%, 36.9% and 38.8%, producing 38.23%. At the end, it averages 37.4%, 35.5% and 48.1%, producing 40.33%. Their difference is 2.10 percentage points. This remains a comparison of estimates and contains no newly estimated confidence interval. Averaging can reduce the visual influence of an unusual year, but it does not remove survey error or make the underlying measurement constant across time.
These values are not pooled expenditure shares. A pooled share would combine spending totals across years and could weight years differently according to their aggregate expenditure. The calculation here instead answers what the average published annual share was within each three-year interval. It also does not follow the same consumers for three years. In particular, the early interval crosses documented source-selection changes. The average should therefore be understood as an endpoint-sensitivity check on the published series, not as a statistical repair. The contrast between 9.1 points and 2.10 points is itself an important result: the strength of the descriptive headline depends substantially on how the time comparison is framed.
Average spending and aggregate shares answer different questions
In 2014, the highest-quintile annual reading mean was $201 per CU, compared with $48 in the lowest quintile. Dividing the first published mean by the second gives approximately 4.19. In 2024, the corresponding means were $300 and $47, producing a ratio of approximately 6.38. These are ratios of spending means within a year, not counts of purchases or books. They include CUs that reported no relevant expenditure. They should not be labelled the spending of a typical purchaser or used to describe what every member of either group did.
The ratios help explain the distribution, but they are not interchangeable with aggregate shares. Group population weights and differing CU counts also enter aggregate spending. This study therefore takes the aggregate-share values directly from BLS rather than reconstructing them by treating the quintiles as exactly equal-sized. The means are rounded dollar estimates, so calculated ratios should be reported with modest precision. Dollar means across years are nominal: the 2014 and 2024 amounts have not been converted into constant purchasing power. A within-year top-to-bottom ratio does not require that adjustment, but it still remains sensitive to the composition and uncertainty of both groups.
Reading concentration can be compared with all expenditure
The highest quintile's share of all consumer expenditure was 39.0% in 2014 and 38.4% in 2024. Its Reading share was therefore equal to its all-expenditure share at the first endpoint and 9.7 percentage points higher at the second. This offers a contextual comparison: the 2024 concentration of reading dollars at the top was greater than the concentration of all expenditure in that group. It does not demonstrate why the difference occurred or whether its size is statistically distinguishable from another year. The relevant estimates share respondents and denominators, so their uncertainty cannot be treated as independent without further work.
A separate measure asks how much of a group's own budget went to Reading. Using published rounded means, the 2024 calculation is $300 divided by $150,342 for the highest quintile, or about 0.200%. For the lowest quintile it is $47 divided by $35,046, or about 0.134%. The denominator here is expenditure within the income group, not national reading expenditure. A group can account for a large fraction of reading dollars while devoting a small fraction of its own budget to the category. Keeping these two percentages separate prevents a common but consequential confusion in reporting spending data.
The published category is not a fixed measurement basket
The official BLS source-integration workbook identifies changes inside Reading during the study window. In 2014, the newspaper and magazine subscription and non-subscription components were drawn from the Interview Survey. Newspaper and magazine components use the Diary Survey from 2015. The encyclopedia and reference-book component also changes from Interview to Diary between those years. Books through book clubs move from Interview to Diary in 2017. These are changes in the inputs used for the published category, not conclusions inferred from an unusual point in the numerical series.
The same workbook marks book-club and encyclopedia/reference-book component codes as ending after the fourth quarter of 2024, with no active source shown for those codes in 2025. That does not, by itself, prove that the associated purchases vanished or were entirely excluded rather than reorganized. It does establish that unchanged labels cannot be assumed to mean an unchanged component structure. Digital book readers appear throughout 2014–2025. The correct historical statement is therefore about shares of the category as BLS published it in each year. This brief does not construct a constant-definition basket, and it cannot separate source changes from genuine changes in the spending distribution.
Standard errors qualify the means, not the derived shares
The mean-expenditure tables provide standard errors and relative standard errors. For the highest-quintile 2024 reading mean of $300, the published standard error is $45.78 and the relative standard error is 15.24%. For the lowest-quintile mean of $47, they are $7.28 and 15.42%. All five 2024 reading-mean RSEs lie below the BLS 25% caution threshold, but that does not make them precise enough to treat small contrasts as certain. The 2014 highest- and lowest-quintile RSEs were 4.33% and 7.29%, respectively. Uncertainty differs across years and groups.
A mean's standard error cannot simply be attached to a quintile's aggregate share as an error bar. Nor does it establish the standard error of a top-to-bottom ratio, a cross-category difference or a three-year average. Those calculations need the relevant joint sampling information and covariance treatment. This study does not supply significance tests for its concentration claims. The published means are rounded, while BLS calculates relative errors using underlying values, so small differences between a recomputed RSE and the published RSE are expected. Preserving the supplied errors alongside the means is preferable to replacing them with false precision or presenting them as uncertainty measures for a different statistic.
The 2025 extension needs two prominent qualifications
BLS released the 2025 annual expenditure estimates on October 29, 2026. The highest quintile's reading share is 43.4%, below the 2024 estimate, while the lowest quintile's share is 5.9%. Published mean reading spending is $248 and $33 in those groups, respectively, giving a ratio of approximately 7.52. The 2023–2025 average highest-quintile share is 42.33%. These observations are retained as an update rather than silently substituting a new endpoint for the original 2014–2024 question. They also illustrate why aggregate concentration and the ratio between two group means need not move together.
First, 2025 crosses the component-code changes identified in the integration workbook. Second, the federal funding lapse prevented October and November data collection. BLS adjusted Interview expenditure weights and doubled September and December Diary weights to represent the missing months. The agency expects increased variances and notes that the true effect of missing data cannot be measured without the unavailable observations. This makes a confident claim about the one-year movement especially inappropriate. The update is informative about the published estimates, but neither the decline in the highest-quintile share nor the increase in the top-to-bottom mean ratio establishes a measured change in reading behavior.
How to use this evidence without overstating it
For researchers and publishing professionals, the useful result is a documented distribution with clear boundaries. The 2024 endpoint places nearly half of the estimated Reading expenditure in the highest income quintile. The earlier annual values, the three-year sensitivity calculation, sampling uncertainty and source changes all belong with that finding. A short quotation that retains only the 48.1% figure loses the distinction between an observed survey estimate and a stable market characteristic. The accompanying table and downloads make it possible to check the full comparison rather than rely on that isolated headline.
The analysis can inform questions about consumer expenditure and the composition of paid demand. It cannot establish who reads most, who values books most, which formats will sell, or how much access lower-income readers have through libraries and free materials. A next-stage causal or constant-definition analysis would require additional source work, suitable survey methods and a separate documented plan. For the present study, the defensible conclusion is narrower: the published distribution was more concentrated at the top in 2024 than at the original 2014 endpoint, but the magnitude is sensitive to time framing and the series is not methodologically constant. Those qualifications should travel with every translation or reuse.
Income concentration in reading expenditure
Annual highest-income quintile shares of aggregate US Reading expenditure, 2014–2024, with a separately marked 2025 extension and arithmetic mean annual shares for 2014–2016 and 2022–2024.
Full chart and source

Scroll horizontally to inspect the chart. ↔
Chart and values
Scroll horizontally to see all columns.
| Year | Highest-quintile reading share (%) | Lowest-quintile reading share (%) | Top two quintiles reading share (%) | Highest/lowest mean ratio | Top reading share minus top all-expenditure share (pp) |
|---|---|---|---|---|---|
| 2014 | 39.0 | 9.2 | 60.6 | 4.1875 | 0.0 |
| 2015 | 36.9 | 6.4 | 60.5 | 5.6757 | -2.7 |
| 2016 | 38.8 | 10.9 | 58.2 | 3.5781 | -0.3 |
| 2017 | 37.8 | 8.8 | 61.4 | 4.3333 | -1.1 |
| 2018 | 31.7 | 12.6 | 53.2 | 2.5147 | -7.2 |
| 2019 | 33.4 | 13.2 | 53.7 | 2.5082 | -5.3 |
| 2020 | 35.8 | 12.0 | 55.5 | 3.0000 | -1.5 |
| 2021 | 38.6 | 10.3 | 62.6 | 3.7288 | 0.1 |
| 2022 | 37.4 | 12.1 | 58.8 | 3.0704 | -1.2 |
| 2023 | 35.5 | 11.0 | 61.7 | 3.2000 | -3.4 |
| 2024 | 48.1 | 7.5 | 67.5 | 6.3830 | 9.7 |
| 2025 | 43.4 | 5.9 | 64.3 | 7.5152 | 4.6 |
Original period 2014–2024; 2025 extension. Published rounded estimates; source changes and sampling uncertainty apply.
Data & downloads
Scroll horizontally to see all columns.
| Year | Highest-quintile reading share (%) | Lowest-quintile reading share (%) | Top two quintiles reading share (%) | Highest/lowest mean ratio | Top reading share minus top all-expenditure share (pp) |
|---|---|---|---|---|---|
| 2014 | 39.0 | 9.2 | 60.6 | 4.1875 | 0.0 |
| 2015 | 36.9 | 6.4 | 60.5 | 5.6757 | -2.7 |
| 2016 | 38.8 | 10.9 | 58.2 | 3.5781 | -0.3 |
| 2017 | 37.8 | 8.8 | 61.4 | 4.3333 | -1.1 |
| 2018 | 31.7 | 12.6 | 53.2 | 2.5147 | -7.2 |
| 2019 | 33.4 | 13.2 | 53.7 | 2.5082 | -5.3 |
| 2020 | 35.8 | 12.0 | 55.5 | 3.0000 | -1.5 |
| 2021 | 38.6 | 10.3 | 62.6 | 3.7288 | 0.1 |
| 2022 | 37.4 | 12.1 | 58.8 | 3.0704 | -1.2 |
| 2023 | 35.5 | 11.0 | 61.7 | 3.2000 | -3.4 |
| 2024 | 48.1 | 7.5 | 67.5 | 6.3830 | 9.7 |
| 2025 | 43.4 | 5.9 | 64.3 | 7.5152 | 4.6 |
Original period 2014–2024; 2025 extension. Published rounded estimates; source changes and sampling uncertainty apply.
Scroll horizontally to see all columns.
| Year | Quintile | Aggregate reading share (%) | Mean reading USD/CU | Mean SE (USD) | Mean RSE (%) | Published reading budget share (%) | Mean all expenditure USD/CU | Reading aggregate source cell | Reading mean source cell |
|---|---|---|---|---|---|---|---|---|---|
| 2014 | 1 | 9.2 | 48.0 | 3.48 | 7.29 | 0.2 | 23713.0 | C153 | C534 |
| 2014 | 2 | 13.7 | 71.0 | 4.89 | 6.91 | 0.2 | 33546.0 | D153 | D534 |
| 2014 | 3 | 16.4 | 84.0 | 4.74 | 5.63 | 0.2 | 45395.0 | E153 | E534 |
| 2014 | 4 | 21.6 | 112.0 | 7.41 | 6.64 | 0.2 | 60417.0 | F153 | F534 |
| 2014 | 5 | 39.0 | 201.0 | 8.7 | 4.33 | 0.2 | 104363.0 | G153 | G534 |
| 2015 | 1 | 6.4 | 37.0 | 3.86 | 10.56 | 0.1 | 24470.0 | C153 | C534 |
| 2015 | 2 | 14.4 | 82.0 | 10.29 | 12.5 | 0.2 | 35063.0 | D153 | D534 |
| 2015 | 3 | 18.8 | 107.0 | 9.18 | 8.58 | 0.2 | 45912.0 | E153 | E534 |
| 2015 | 4 | 23.6 | 134.0 | 15.6 | 11.61 | 0.2 | 63671.0 | F153 | F534 |
| 2015 | 5 | 36.9 | 210.0 | 14.16 | 6.75 | 0.2 | 110508.0 | G153 | G534 |
| 2016 | 1 | 10.9 | 64.0 | 8.3 | 12.89 | 0.3 | 25138.0 | C153 | C534 |
| 2016 | 2 | 14.6 | 86.0 | 14.34 | 16.74 | 0.2 | 36770.0 | D153 | D534 |
| 2016 | 3 | 16.3 | 96.0 | 9.29 | 9.65 | 0.2 | 47664.0 | E153 | E534 |
| 2016 | 4 | 19.4 | 115.0 | 11.54 | 10.07 | 0.2 | 64910.0 | F153 | F534 |
| 2016 | 5 | 38.8 | 229.0 | 17.36 | 7.59 | 0.2 | 112221.0 | G153 | G534 |
| 2017 | 1 | 8.8 | 48.0 | 9.17 | 19.02 | 0.2 | 26019.0 | C153 | C534 |
| 2017 | 2 | 11.2 | 62.0 | 6.37 | 10.31 | 0.2 | 39300.0 | D153 | D534 |
| 2017 | 3 | 18.6 | 102.0 | 11.47 | 11.2 | 0.2 | 50470.0 | E153 | E534 |
| 2017 | 4 | 23.6 | 130.0 | 15.14 | 11.68 | 0.2 | 67604.0 | F153 | F534 |
| 2017 | 5 | 37.8 | 208.0 | 16.21 | 7.8 | 0.2 | 116988.0 | G153 | G534 |
| 2018 | 1 | 12.6 | 68.0 | 12.56 | 18.39 | 0.3 | 26399.0 | C153 | C534 |
| 2018 | 2 | 17.6 | 95.0 | 13.56 | 14.24 | 0.2 | 39968.0 | D153 | D534 |
| 2018 | 3 | 16.5 | 89.0 | 8.76 | 9.79 | 0.2 | 51729.0 | E153 | E534 |
| 2018 | 4 | 21.5 | 116.0 | 12.62 | 10.88 | 0.2 | 69131.0 | F153 | F534 |
| 2018 | 5 | 31.7 | 171.0 | 11.19 | 6.55 | 0.1 | 118781.0 | G153 | G534 |
| 2019 | 1 | 13.2 | 61.0 | 11.39 | 18.72 | 0.2 | 28672.0 | C153 | C534 |
| 2019 | 2 | 13.4 | 62.0 | 9.57 | 15.45 | 0.2 | 40472.0 | D153 | D534 |
| 2019 | 3 | 19.7 | 90.0 | 16.37 | 18.12 | 0.2 | 53045.0 | E153 | E534 |
| 2019 | 4 | 20.3 | 94.0 | 9.47 | 10.11 | 0.1 | 71173.0 | F153 | F534 |
| 2019 | 5 | 33.4 | 153.0 | 13.8 | 9.0 | 0.1 | 121571.0 | G153 | G534 |
| 2020 | 1 | 12.0 | 68.0 | 16.27 | 23.78 | 0.2 | 28724.0 | C153 | C534 |
| 2020 | 2 | 15.1 | 86.0 | 18.67 | 21.74 | 0.2 | 39890.0 | D153 | D534 |
| 2020 | 3 | 17.4 | 99.0 | 12.2 | 12.37 | 0.2 | 51543.0 | E153 | E534 |
| 2020 | 4 | 19.7 | 112.0 | 11.99 | 10.66 | 0.2 | 71942.0 | F153 | F534 |
| 2020 | 5 | 35.8 | 204.0 | 26.79 | 13.12 | 0.2 | 114840.0 | G153 | G534 |
| 2021 | 1 | 10.3 | 59.0 | 10.34 | 17.62 | 0.2 | 30869.0 | C153 | C534 |
| 2021 | 2 | 13.7 | 78.0 | 12.36 | 15.84 | 0.2 | 43918.0 | D153 | D534 |
| 2021 | 3 | 13.5 | 77.0 | 9.44 | 12.26 | 0.1 | 55914.0 | E153 | E534 |
| 2021 | 4 | 24.0 | 137.0 | 14.24 | 10.43 | 0.2 | 75284.0 | F153 | F534 |
| 2021 | 5 | 38.6 | 220.0 | 15.64 | 7.13 | 0.2 | 128213.0 | G153 | G534 |
| 2022 | 1 | 12.1 | 71.0 | 11.17 | 15.81 | 0.2 | 32612.0 | C153 | C534 |
| 2022 | 2 | 13.6 | 79.0 | 8.87 | 11.18 | 0.2 | 47657.0 | D153 | D534 |
| 2022 | 3 | 15.6 | 91.0 | 10.73 | 11.78 | 0.1 | 61950.0 | E153 | E534 |
| 2022 | 4 | 21.4 | 124.0 | 18.69 | 15.01 | 0.2 | 81957.0 | F153 | F534 |
| 2022 | 5 | 37.4 | 218.0 | 23.6 | 10.84 | 0.2 | 140654.0 | G153 | G534 |
| 2023 | 1 | 11.0 | 65.0 | 11.61 | 17.93 | 0.2 | 33776.0 | C153 | C534 |
| 2023 | 2 | 12.3 | 72.0 | 9.07 | 12.64 | 0.1 | 48923.0 | D153 | D534 |
| 2023 | 3 | 15.1 | 88.0 | 7.35 | 8.35 | 0.1 | 65487.0 | E153 | E534 |
| 2023 | 4 | 26.2 | 153.0 | 18.11 | 11.83 | 0.2 | 87922.0 | F153 | F534 |
| 2023 | 5 | 35.5 | 208.0 | 15.09 | 7.27 | 0.1 | 150093.0 | G153 | G534 |
| 2024 | 1 | 7.5 | 47.0 | 7.28 | 15.42 | 0.1 | 35046.0 | C151 | C525 |
| 2024 | 2 | 12.0 | 75.0 | 9.4 | 12.54 | 0.1 | 50054.0 | D151 | D525 |
| 2024 | 3 | 13.0 | 82.0 | 10.34 | 12.61 | 0.1 | 66900.0 | E151 | E525 |
| 2024 | 4 | 19.4 | 122.0 | 11.38 | 9.35 | 0.1 | 89972.0 | F151 | F525 |
| 2024 | 5 | 48.1 | 300.0 | 45.78 | 15.24 | 0.2 | 150342.0 | G151 | G525 |
| 2025 | 1 | 5.9 | 33.0 | 5.03 | 15.07 | 0.1 | 37935.0 | C151 | C525 |
| 2025 | 2 | 13.8 | 78.0 | 8.35 | 10.72 | 0.2 | 51405.0 | D151 | D525 |
| 2025 | 3 | 16.0 | 91.0 | 10.84 | 11.96 | 0.1 | 68983.0 | E151 | E525 |
| 2025 | 4 | 20.9 | 119.0 | 19.16 | 16.09 | 0.1 | 92250.0 | F151 | F525 |
| 2025 | 5 | 43.4 | 248.0 | 30.09 | 12.15 | 0.2 | 159512.0 | G151 | G525 |
Shares of national Reading spending differ from shares of each group budget. Mean SE/RSE do not describe share uncertainty. Q1 is lowest income, Q5 highest.
Evidence & method
How we calculated it
- Secondary descriptive analysis of 24 official BLS Table 1101 workbooks, 2014–2025, retrieved October 30, 2026. Original 2014–2024 endpoints retained; 2025 separately identified.
- Read the first main-budget Reading block. Earlier files repeat Reading within gifts; those later rows are not substituted or added. Retain source means, shares, standard errors and RSE/CV, with row/column locations. No missing values imputed.
- Calculate endpoint differences in percentage points, within-year top/bottom mean ratios, and equal-weight arithmetic means of annual shares over specified three-year intervals. Budget ratios use published rounded means. No pooled weighting, inflation adjustment or significance tests.
- Independent review checked all 60 quintile observations against 180 selected raw workbook cells, all 12 mean ratios and the window averages. Source-integration changes were inspected separately. This is not prospective preregistration.
What the data cannot tell us
- Reading includes periodicals, digital material and digital book readers; it is not books-only expenditure. Free reading and reading volume are unmeasured.
- Income-ranked consumer units are not people, purchasers or a longitudinal household panel; group size and composition can differ.
- Integration changes in 2015 and 2017 limit fixed-definition trend interpretation. Two component codes end after Q20244; disappearance of codes does not establish disappearance of spending.
- Mean SEs/RSEs do not establish uncertainty or significance for shares, ratios, differences or smoothed averages. No covariance-based tests were performed.
- 2025 includes shutdown-related weighting for missing data and increased uncertainty. Dollar estimates are nominal, and causal explanations are not identified.
Original sources
- BLS Table 1101 annual aggregate shares, 2014–2025
BLS Table 1101 annual aggregate shares, 2014–2025: Twelve annual official workbooks, exact URLs and frozen hashes retained.
Accessed October 30, 2026
- BLS Table 1101 annual means and standard errors, 2014–2025
BLS Table 1101 annual means and standard errors, 2014–2025: Mean, budget share, standard error and relative standard error; older files use CV(%).
Accessed October 30, 2026
- CE glossary
CE glossary: Consumer-unit, quintile, expenditure and Reading definitions.
Accessed October 30, 2026
- CE table guide
CE table guide: Integration, interpretation, variability and category changes.
Accessed October 30, 2026
- CE source integration
CE source integration: Rows 1047–1060; 2015 and 2017 source changes, two codes end after Q20244, device inclusion.
Accessed October 30, 2026
- 2025 funding-lapse adjustments
2025 funding-lapse adjustments: Missing October/November data and weight adjustments.
Accessed October 30, 2026
- 2025 CE release
2025 CE release: Released October 29, 2026; 2025 extension, not a replacement original endpoint.
Accessed October 30, 2026
- BLS reuse policy
BLS reuse policy: Public-domain data with attribution requested; no BLS emblem reuse.
Accessed October 30, 2026
Cite & reuse this study
Alisson Bento. US reading expenditure by income: endpoint growth, a smaller smoothed difference. Original secondary analysis of BLS Consumer Expenditure Surveys Table 1101, observations 2014–2025; sources retrieved October 30, 2026. https://alissonbento.com/research/us-reading-expenditure-income-concentration/
Source: US Bureau of Labor Statistics Consumer Expenditure Surveys. Original calculations and explanation: Alisson Bento. BLS published data are public domain; cite the source, dates, definitions and methodological changes when reusing the analysis. No endorsement or rights to the BLS emblem are implied.
Corrections or editorial questions