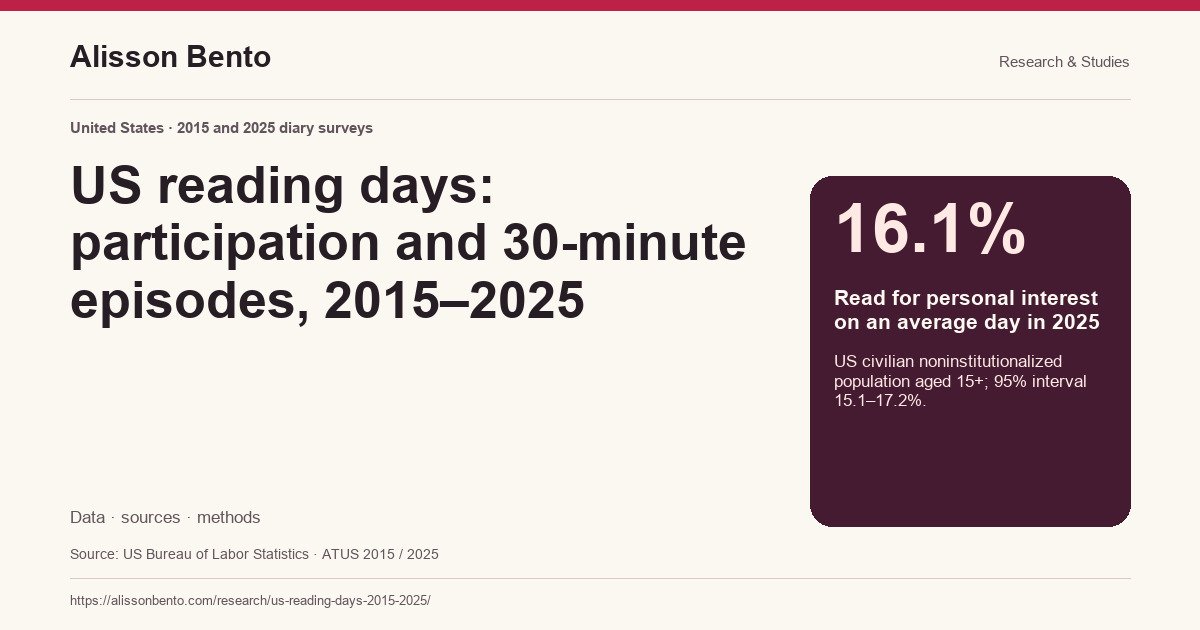
A reading day has two different denominators
A national daily average blends people who read with people who did not read that day. In this analysis, the population average was 19.4 minutes in 2015 and 16.1 minutes in 2025. Those figures do not mean that a typical reader stopped after sixteen minutes. They include zero-reading days across the full eligible population.
Among people who reported reading that day, estimated total reading time was 92.1 minutes in 2015 and 100.0 minutes in 2025. The estimated difference was 7.9 minutes, with a 95% interval from −1.0 to 16.8 minutes. That interval includes no change, so the data do not establish that reader-days became longer or shorter.
This distinction matters for authors, libraries and book clubs. A falling population average can coexist with substantial reading time among the people who read on a particular day. The analysis identifies a smaller daily participating share; it does not identify the same individuals abandoning reading, or measure how many people read at least one book during a year.
What a 30-minute episode adds to the picture
We examined each reported primary activity coded as reading for personal interest. A person counted toward the 30-minute measure when at least one such activity occupied thirty minutes or more within the survey diary. Several shorter entries that added up to thirty minutes did not qualify. A thirty-minute entry could coexist with other reading entries that day.
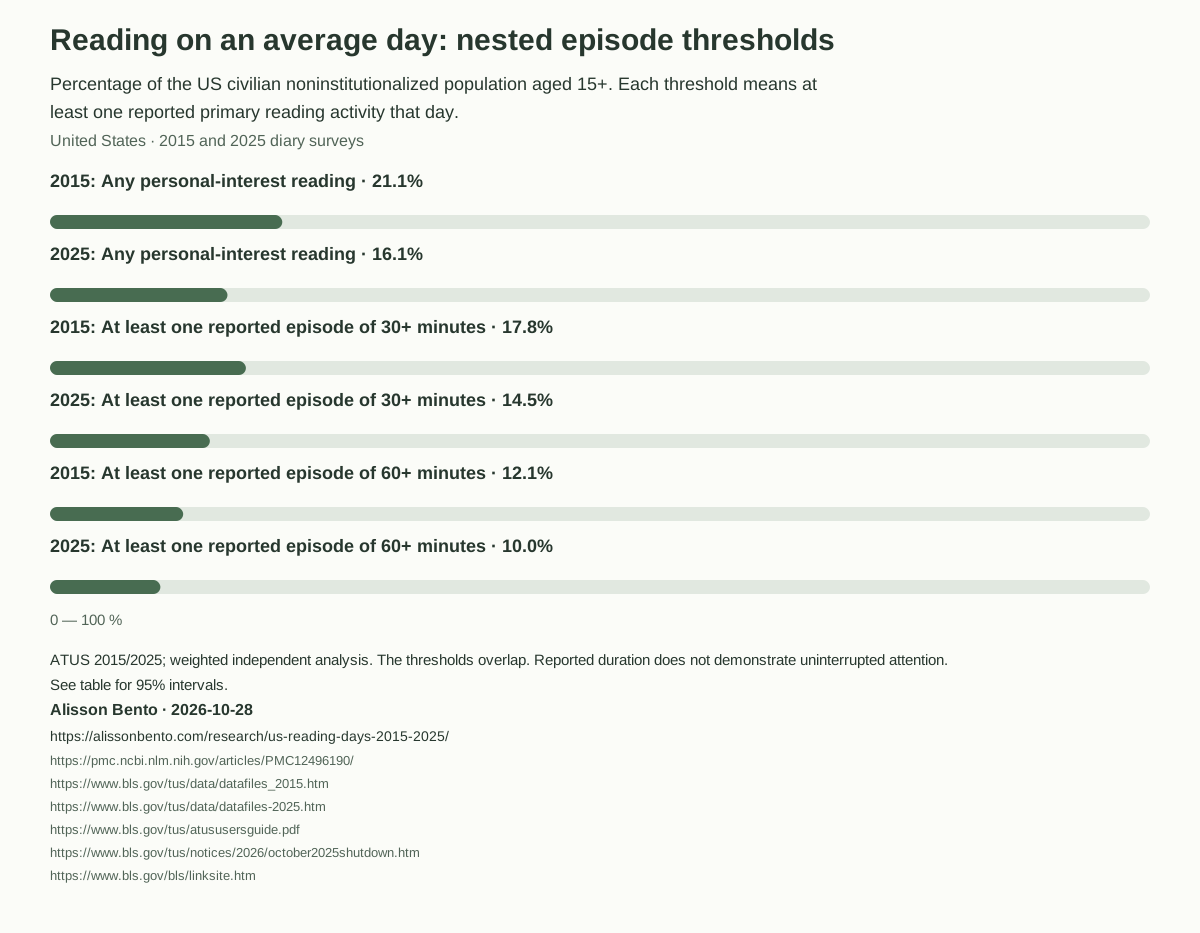
The 30-minute share declined by 3.3 percentage points between the two years, with a 95% interval from −4.6 to −2.0 points. The 60-minute share declined from 12.1% to 10.0%. The 15-minute share declined from 20.6% to 15.8%. These are nested thresholds, so their percentages must not be added.
Our initial research question was whether longer reported reading windows had declined disproportionately. The results do not support presenting that as the finding: participation in any reading fell by about 23.6% relative to its 2015 level, compared with about 18.4% for the 30-minute indicator. These relative changes are descriptive comparisons; the percentage-point differences and intervals are the primary estimates.
An activity diary cannot certify that attention was uninterrupted. A change in location or other diary detail can split activities, and concurrent activities are generally outside this reading measure. The study therefore uses “reported episode” rather than claims about concentration, attention spans or the ability to finish a chapter.
Age and work profiles help describe the audience
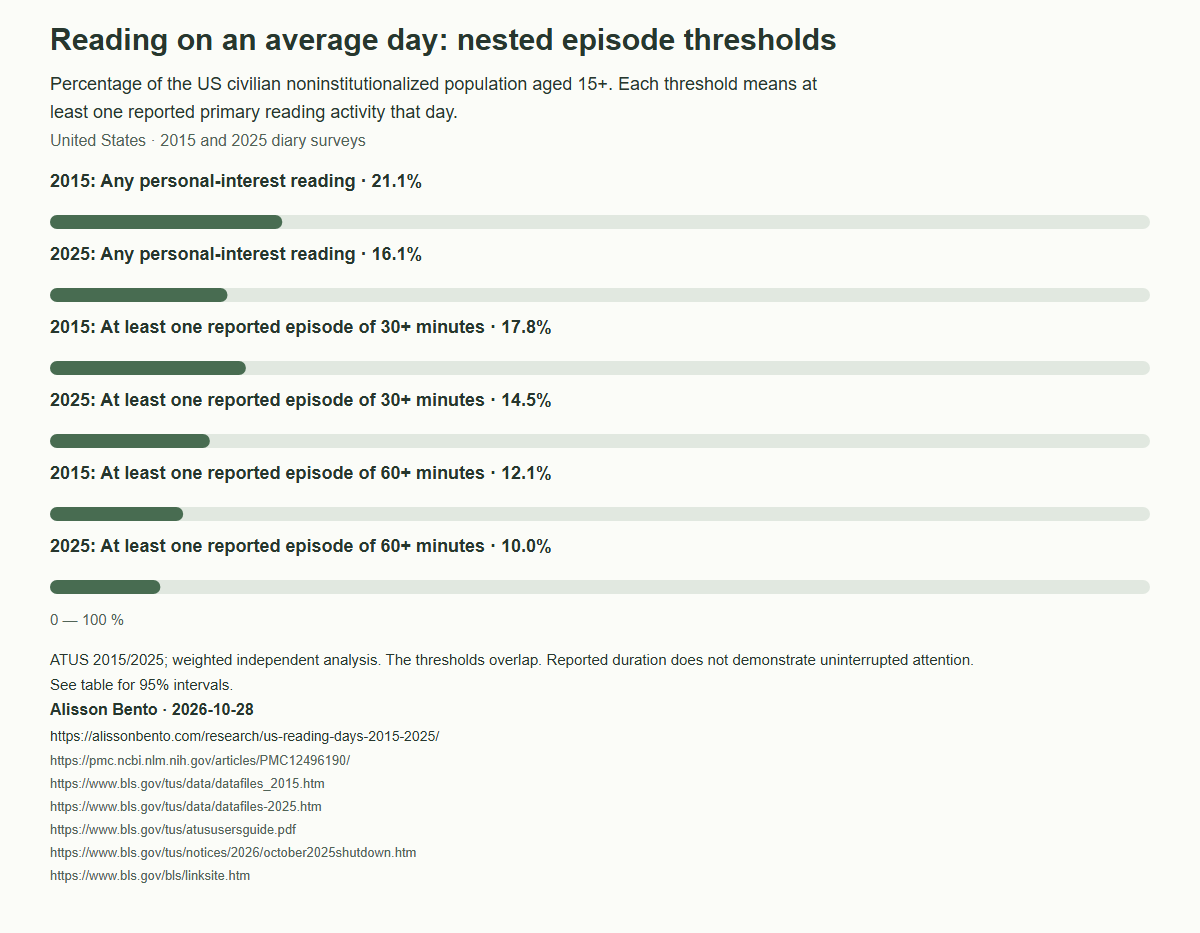
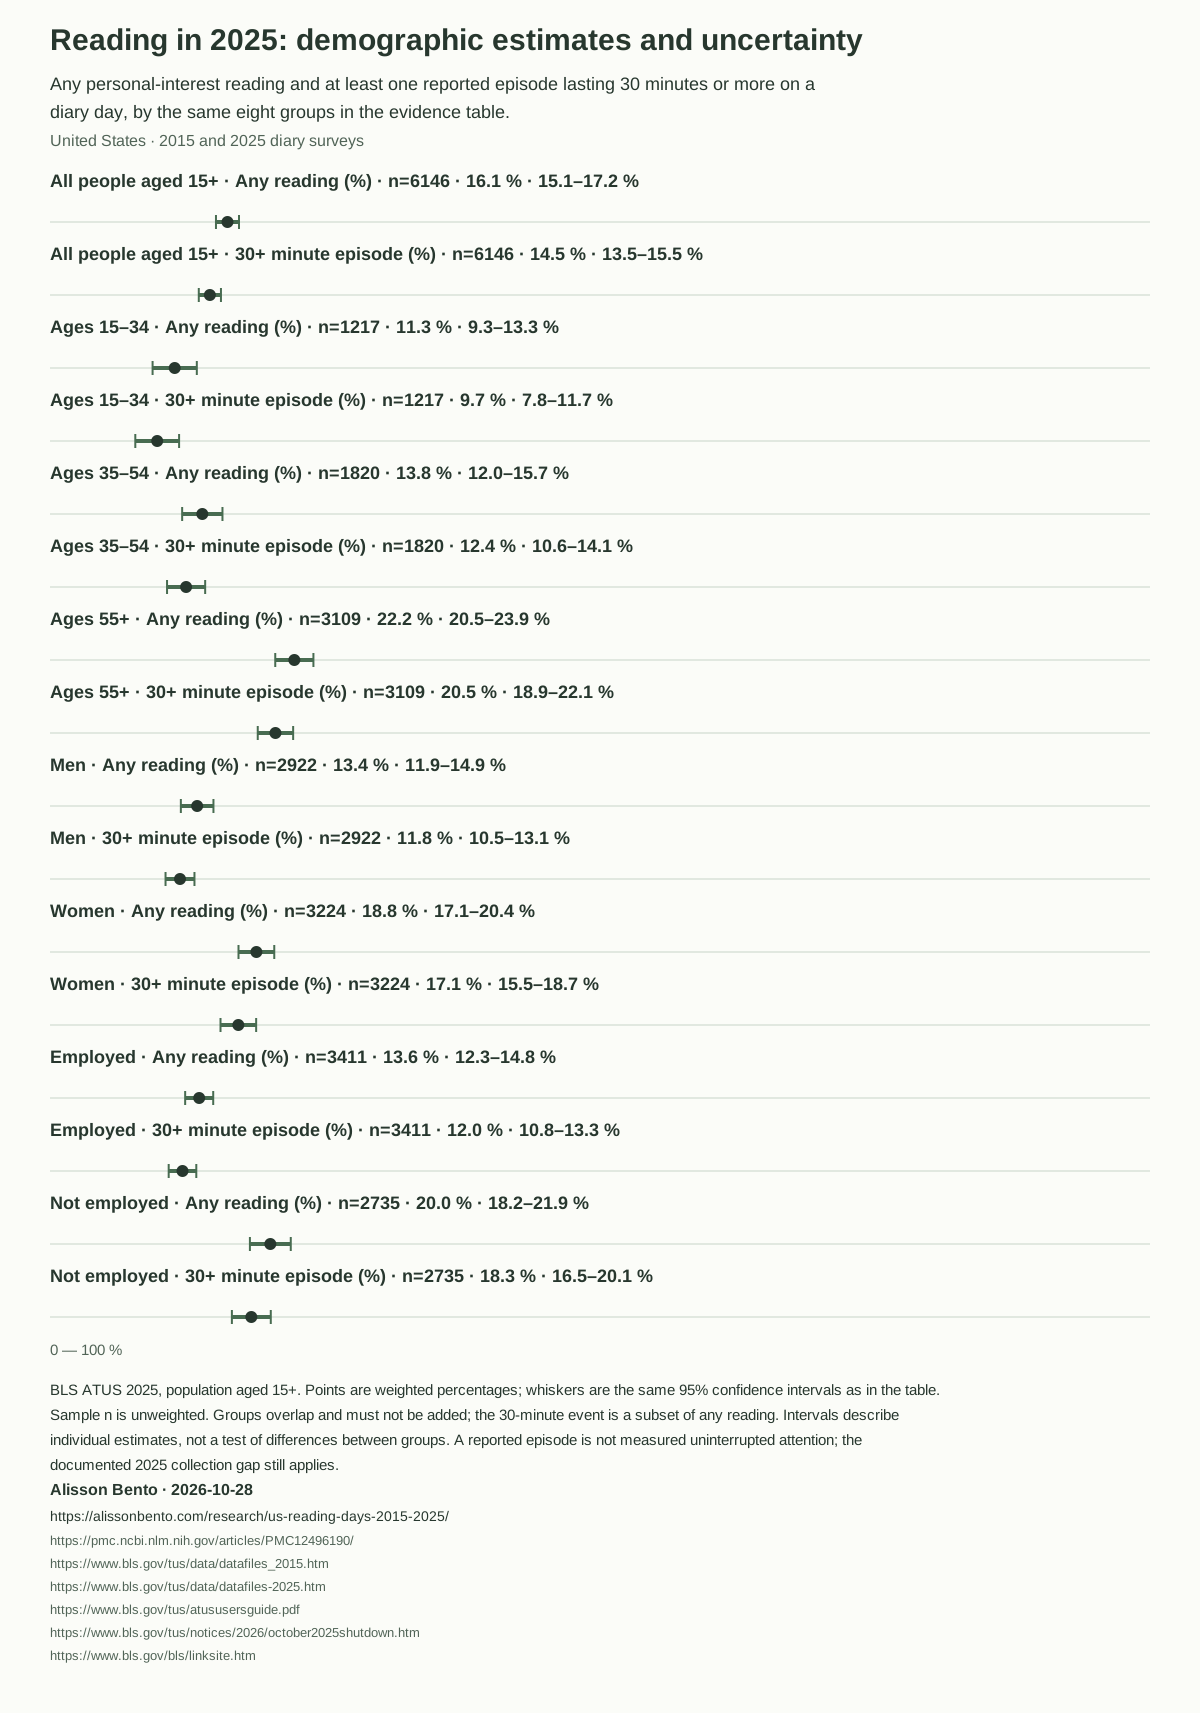
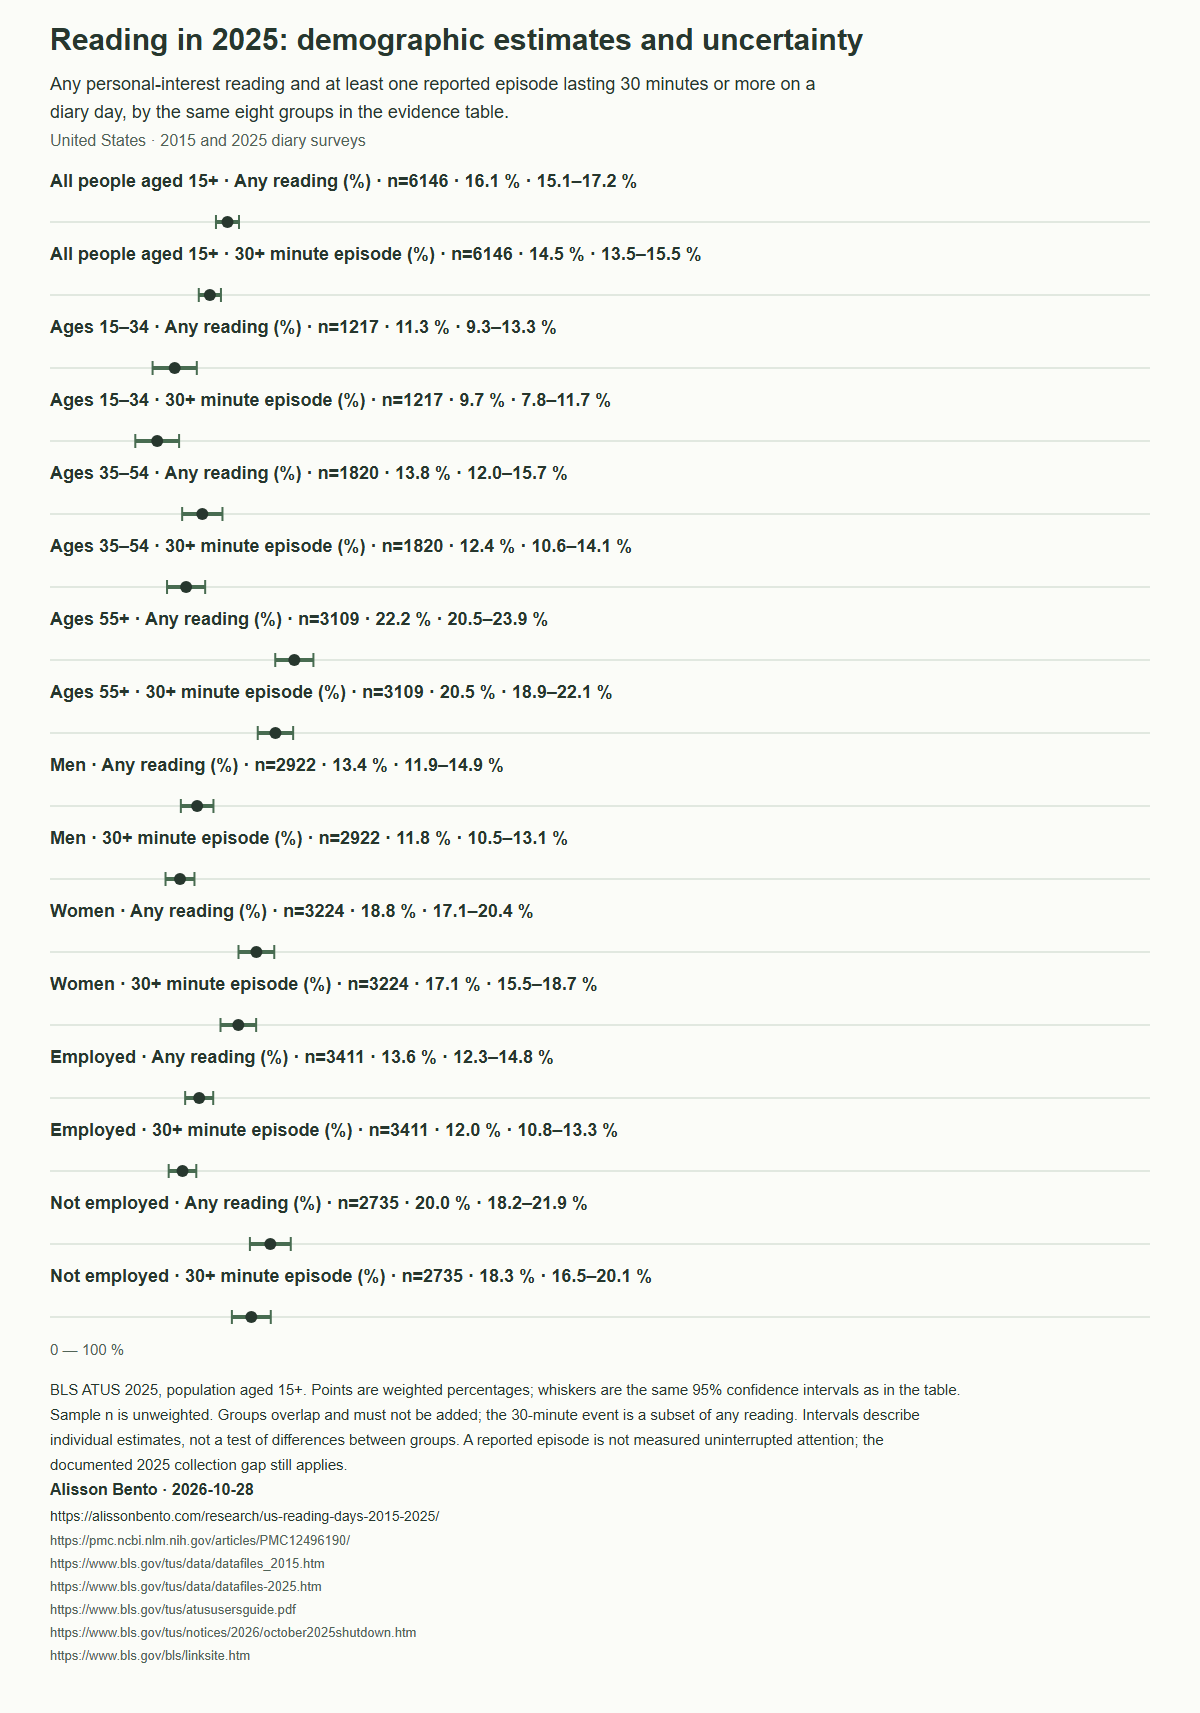
In 2025, the estimated daily reading participation share was 11.3% among people aged 15–34, 13.8% at ages 35–54 and 22.2% at ages 55+. At the 30-minute threshold the corresponding shares were 9.7%, 12.4% and 20.5%. The table reports uncertainty so that a precise-looking point estimate is not mistaken for an exact population count.
The estimated participation share was 13.6% among employed people and 20.0% among those not employed. These groups differ in age, retirement, schooling, health and many other characteristics. The comparison is unadjusted and cannot show that paid work reduces reading. “Not employed” includes more than unemployed jobseekers.
These age, sex and employment profiles are descriptive context, not a ranking of good readers. They concern US residents in the survey universe, not readers of English worldwide, and cannot identify the audience for romance, ebooks, an individual author or a particular reading platform.
Reading here covers more than novels
The American Time Use Survey category used here is reading for personal interest, code 120312. It can cover books and other reading material, in print or electronic form, when recorded as the primary activity. It is not a count of books, a literacy assessment, a measure of reading speed or a fiction-only category.
Reading that occurs as part of work or education belongs elsewhere in the survey coding structure. Listening to an audiobook while doing another main activity is not reliably captured by this primary-reading measure. The estimates therefore cannot establish total time spent consuming written or audio stories across every daily context.
For readers, the practical lesson is to be careful with comparisons: an average across everyone answers a different question from time among readers, and a daily diary answers a different question from an annual book survey. For editors, the downloadable tables retain both denominators instead of offering one dramatic number without its population.
The missing weeks in 2025 must travel with the figures
BLS reports that the 2025 federal shutdown interrupted survey operations. There are no diaries for September 30 through November 11, 2025. Published survey weights represent the missing days using observed diaries; BLS says the effect of the missing period cannot be quantified.
Our 2025 estimates use those official final and replicate weights. The confidence intervals describe sampling uncertainty under that weighting system; they do not quantify possible bias from the shutdown, nonresponse or recall. This limitation is material and should remain attached to any citation of the comparison.
The two endpoints also span changes in population composition and weight calibration. We do not fit a year-by-year trend or attribute the difference to phones, artificial intelligence, the pandemic, employment or any other cause. Additional years and adjusted models would answer different questions.
What this analysis adds to existing research
Declining daily reading participation has already been documented. Bone and colleagues analyzed ATUS 2003–2023 in iScience in 2025. Our contribution is a reproducible 2015–2025 endpoint comparison that adds reported 15-, 30- and 60-minute episode thresholds, full confidence intervals and a clear account of the 2025 shutdown limitation. It is not a claim to have discovered the general decline, and it is not a replacement for their multi-year statistical models.
Reading on an average day: nested episode thresholds
Percentage of the US civilian noninstitutionalized population aged 15+. Each threshold means at least one reported primary reading activity that day.
Scroll horizontally to inspect the chart. ↔
Chart values as text
Reading in 2025: demographic estimates and uncertainty
Any personal-interest reading and at least one reported episode lasting 30 minutes or more on a diary day, by the same eight groups in the evidence table.
Scroll horizontally to inspect the chart. ↔
Chart values as text
Data & downloads
Scroll horizontally to see all columns.
| Measure | 2015 estimate | 2015 95% interval | 2025 estimate | 2025 95% interval |
|---|---|---|---|---|
| Any personal-interest reading | 21.1 | 20.2–22.0 | 16.1 | 15.1–17.2 |
| At least one reported episode of 15+ minutes | 20.6 | 19.7–21.4 | 15.8 | 14.7–16.8 |
| At least one reported episode of 30+ minutes | 17.8 | 17.0–18.6 | 14.5 | 13.5–15.5 |
| At least one reported episode of 60+ minutes | 12.1 | 11.4–12.8 | 10.0 | 9.2–10.9 |
| Daily minutes across everyone, including zero-reading days | 19.4 | 18.2–20.7 | 16.1 | 14.6–17.7 |
| Daily minutes among people who read that day | 92.1 | 87.5–96.7 | 100.0 | 92.3–107.7 |
Percent for participation/episode indicators; minutes for duration. Intervals are normal approximations from 160 replicate weights.
Scroll horizontally to see all columns.
| Group | N | Any reading (%) | 95% interval | 30+ minute episode (%) | 95% interval |
|---|---|---|---|---|---|
| All people aged 15+ | 6146 | 16.1 | 15.1–17.2 | 14.5 | 13.5–15.5 |
| Ages 15–34 | 1217 | 11.3 | 9.3–13.3 | 9.7 | 7.8–11.7 |
| Ages 35–54 | 1820 | 13.8 | 12.0–15.7 | 12.4 | 10.6–14.1 |
| Ages 55+ | 3109 | 22.2 | 20.5–23.9 | 20.5 | 18.9–22.1 |
| Men | 2922 | 13.4 | 11.9–14.9 | 11.8 | 10.5–13.1 |
| Women | 3224 | 18.8 | 17.1–20.4 | 17.1 | 15.5–18.7 |
| Employed | 3411 | 13.6 | 12.3–14.8 | 12.0 | 10.8–13.3 |
| Not employed | 2735 | 20.0 | 18.2–21.9 | 18.3 | 16.5–20.1 |
Each percentage uses its own group population as denominator. Employment comparisons are unadjusted; groups overlap across classifications. N is the unweighted number of diary respondents.
Evidence & method
How we calculated it
- Endpoint comparison: calendar years 2015 and 2025; all respondents in the official annual ATUS Respondent files. The target universe is the US civilian noninstitutionalized population aged 15+.
- Link Respondent, Activity, Activity Summary and replicate-weight files by TUCASEID, preserving identifiers as strings. Check one respondent per ID, valid joins and exactly 1,440 recorded activity minutes per diary. The two samples contain 10,905 and 6,146 respondents.
- Select TRCODE 120312, reading for personal interest. Sum TUACTDUR24 per person and compute the maximum single reported activity duration. Verify every person’s summed minutes against the official Activity Summary t120312 column. Do not combine separate short activities into a qualifying episode.
- Calculate weighted means and indicator percentages using TUFINLWGT. People without a qualifying reading activity receive zero for daily participation/duration; the conditional duration estimate uses only those who read that day.
- Recompute each estimate with FINLWGT001 through FINLWGT160. Variance equals 4/160 times the sum of squared deviations from the full-weight estimate, following the ATUS guide. Standard error is its square root; a 95% interval is estimate ±1.96 standard errors.
- For 2015–2025 differences, combine independent endpoint variances by addition. The resulting intervals address sampling uncertainty only. Broad age/sex/employment groups use TEAGE, TESEX and TELFS; employment codes 1 and 2 are employed. No causal model, seasonal adjustment or demographic standardization is applied.
- Round published values to one decimal; retain full precision, unweighted event counts, standard errors and confidence limits in the downloadable aggregate CSVs. Source microdata are linked, not redistributed as part of this page.
What the data cannot tell us
- Two years are endpoints, not a continuous trend or a panel following the same people. The underlying surveys are independent cross-sections.
- The 2025 shutdown removed September 30–November 11 diaries. Official weighting covers missing days, but BLS cannot quantify the effect on estimates. Sampling confidence intervals do not measure that possible bias.
- A reported activity episode is not verified uninterrupted attention. Reading includes more than books; the study cannot identify genres, reading speed, book completion, literacy or sales.
- The survey generally captures primary activities, so simultaneous reading or audiobook listening may be missed. Recall, coding error and nonresponse remain possible.
- Age, sex and employment groups are unadjusted. The data cannot establish why differences exist or predict readership of any author’s work.
- No state estimates or international rankings are produced; this study’s universe is the United States aged 15+, including respondents under 18.
- This is Alisson Bento’s independent secondary analysis of public BLS data, not a new survey, a BLS publication or a claim of official agency endorsement.
Original sources
- Bone et al., iScience (2025): The decline in reading for pleasure over 20 years of the American Time Use Survey
Prior peer-reviewed analysis of 2003–2023 reading participation. This page does not claim first discovery of declining participation.
Accessed October 28, 2026
- BLS ATUS 2015 microdata and documentation
Official Respondent, Activity, Activity Summary and replicate-weight files; public microdata. Reading code checked against 2015 lexicon.
Accessed October 28, 2026
- BLS ATUS 2025 microdata and documentation
Official 2025 public-use data, released June 2026; reading code checked against 2025 lexicon.
Accessed October 28, 2026
- ATUS User’s Guide, September 2026
Universe, primary-activity limitations, weighting and 160-replicate variance method, chapter 7.
Accessed October 28, 2026
- BLS: Federal Government Shutdown and 2025 ATUS
No diaries September 30–November 11; weighting and unquantifiable shutdown effects.
Accessed October 28, 2026
- BLS linking and copyright information
Source attribution and official material reuse information; independent analysis implies no endorsement.
Accessed October 28, 2026
Cite & reuse this study
Alisson Bento. US reading days: participation and 30-minute episodes, 2015–2025. Independent analysis of BLS American Time Use Survey public microdata. Published 28 October 2026. https://alissonbento.com/research/us-reading-days-2015-2025/
You may reuse our aggregate tables, charts and analysis with attribution and a link to this study. Keep the observation years, population and limitations attached. Original BLS materials retain their own source terms; no agency endorsement is implied.
Corrections or editorial questions