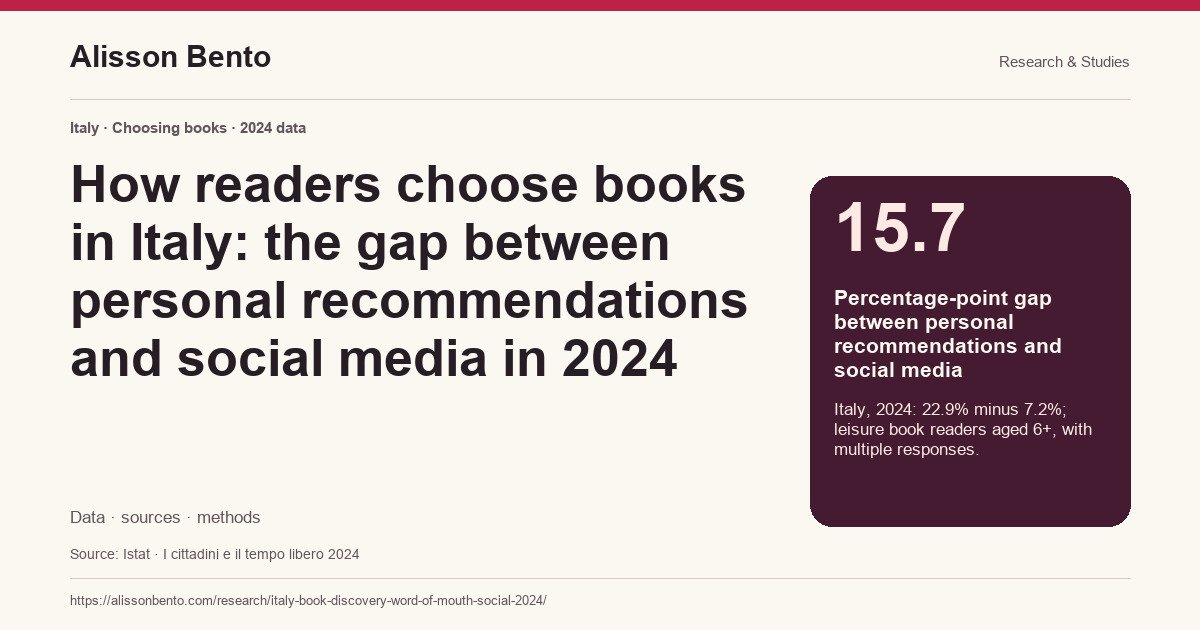
The question: how does the comparison change beyond the national average?
Finding the next book may involve recognising a cover, listening to a friend, following a bookseller or encountering a recommendation online. These experiences can overlap. We therefore compare the shares of readers reporting each approach separately, without ranking the channels by the sales they generate.
The evidence is public: Tables 21 and 22 of Istat’s I cittadini e il tempo libero survey, referring to 2024. Our contribution is a reproducible comparison of personal and social-media recommendations across the 20 regions, municipality types and available adult age bands. This is not a new survey conducted by Alisson Bento and is not presented as a finding about behaviour in 2026.
Independent choice comes first, alongside recommendations
The largest national share is the 85.4% choosing books according to personal taste. Personal recommendations account for 22.9%, expert recommendations for 8.6%, social media for 7.2%, and TV, radio, newspapers and magazines for 7.1%. The other option is 2.3%. These percentages should not add to 100: they describe compatible responses.
Subtracting 7.2 from 22.9 gives 15.7 percentage points. The ratio between the two shares is approximately 3.18. These are two descriptions of the same difference in reported behaviour; they do not mean personal recommendations generate three times the sales, or that social-media users do not also ask friends for advice.
A pattern shared by every region, with different gaps
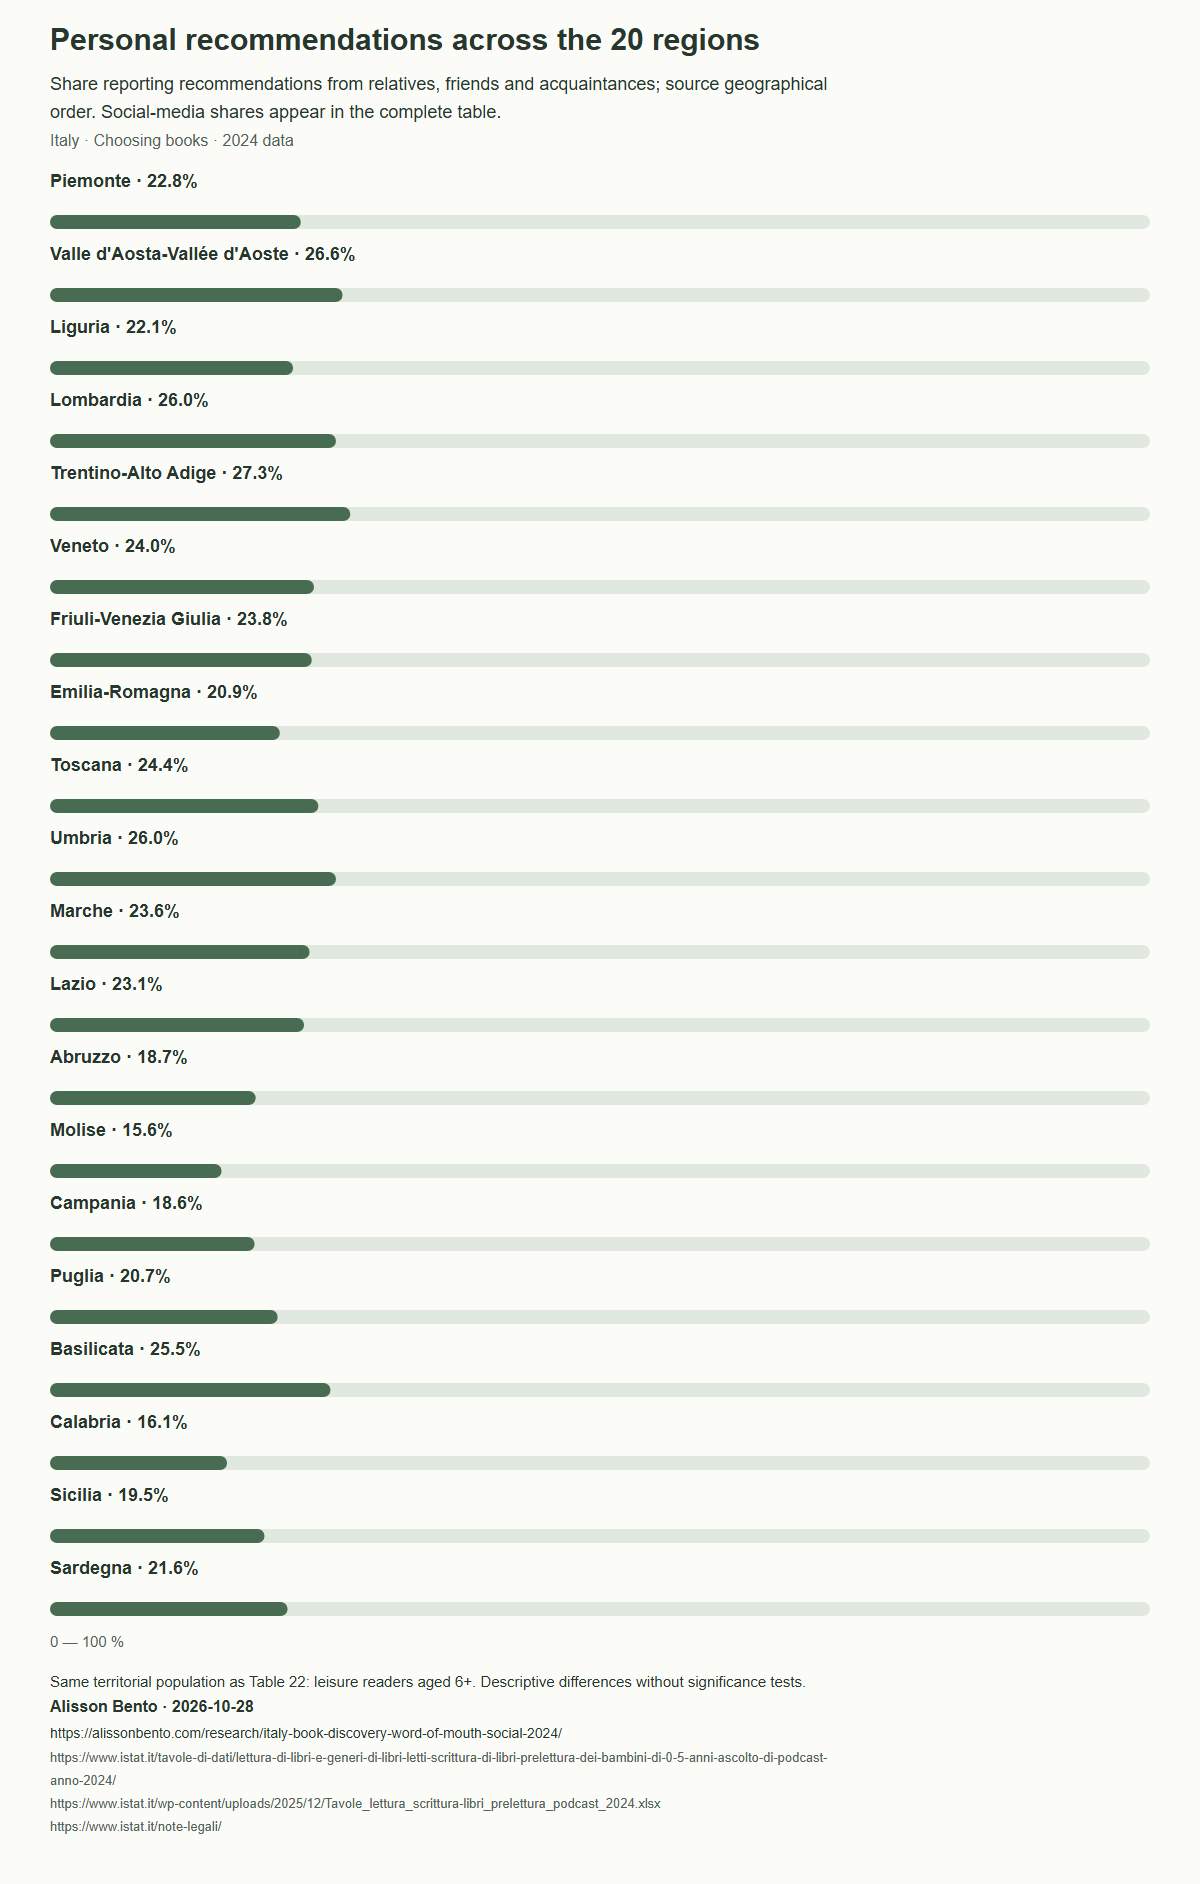
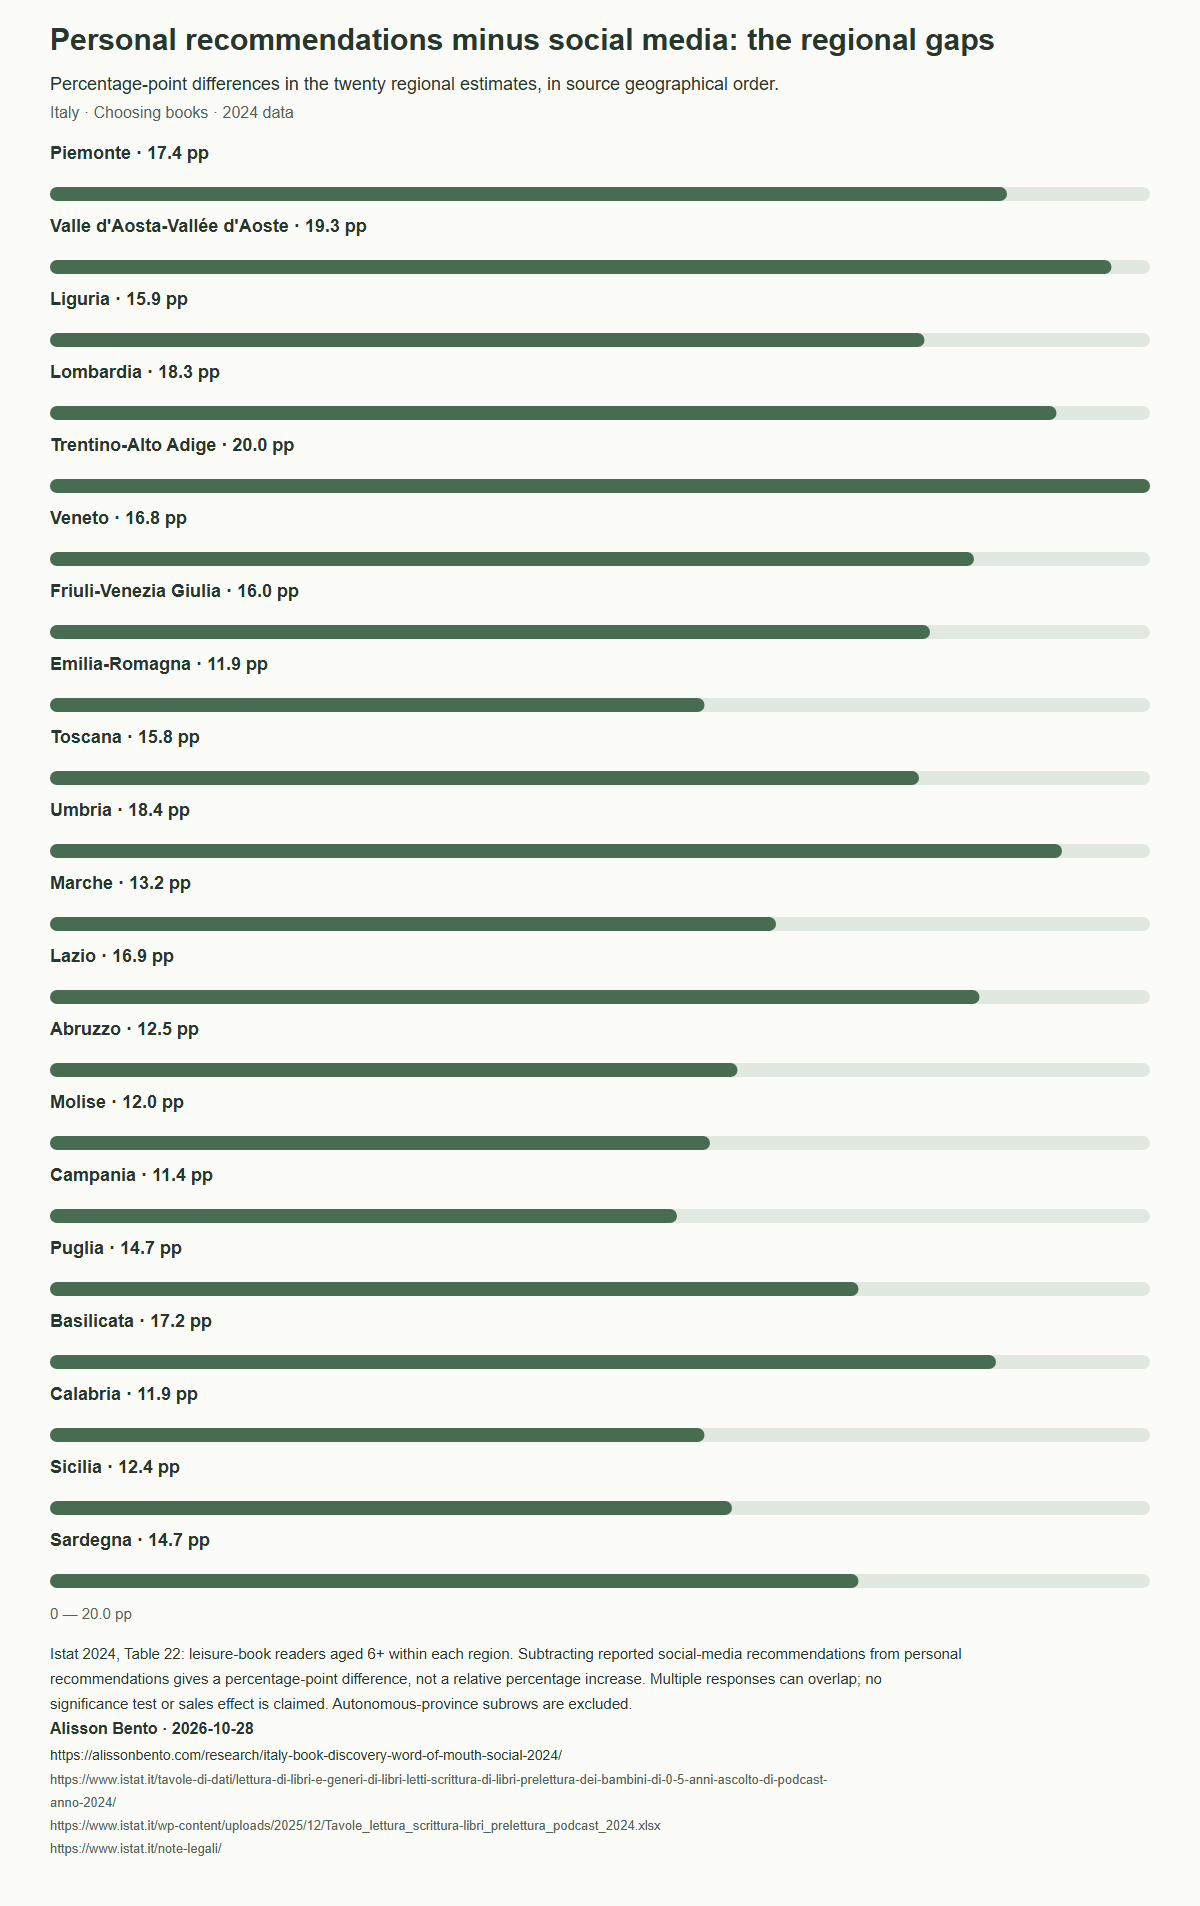
In the 20 regional estimates, personal recommendations always exceed social media, with a share at least twice as large. Trentino-Alto Adige counts as one region in this comparison; the provinces of Bolzano and Trento appear in the complete table but are not added to the regional count.
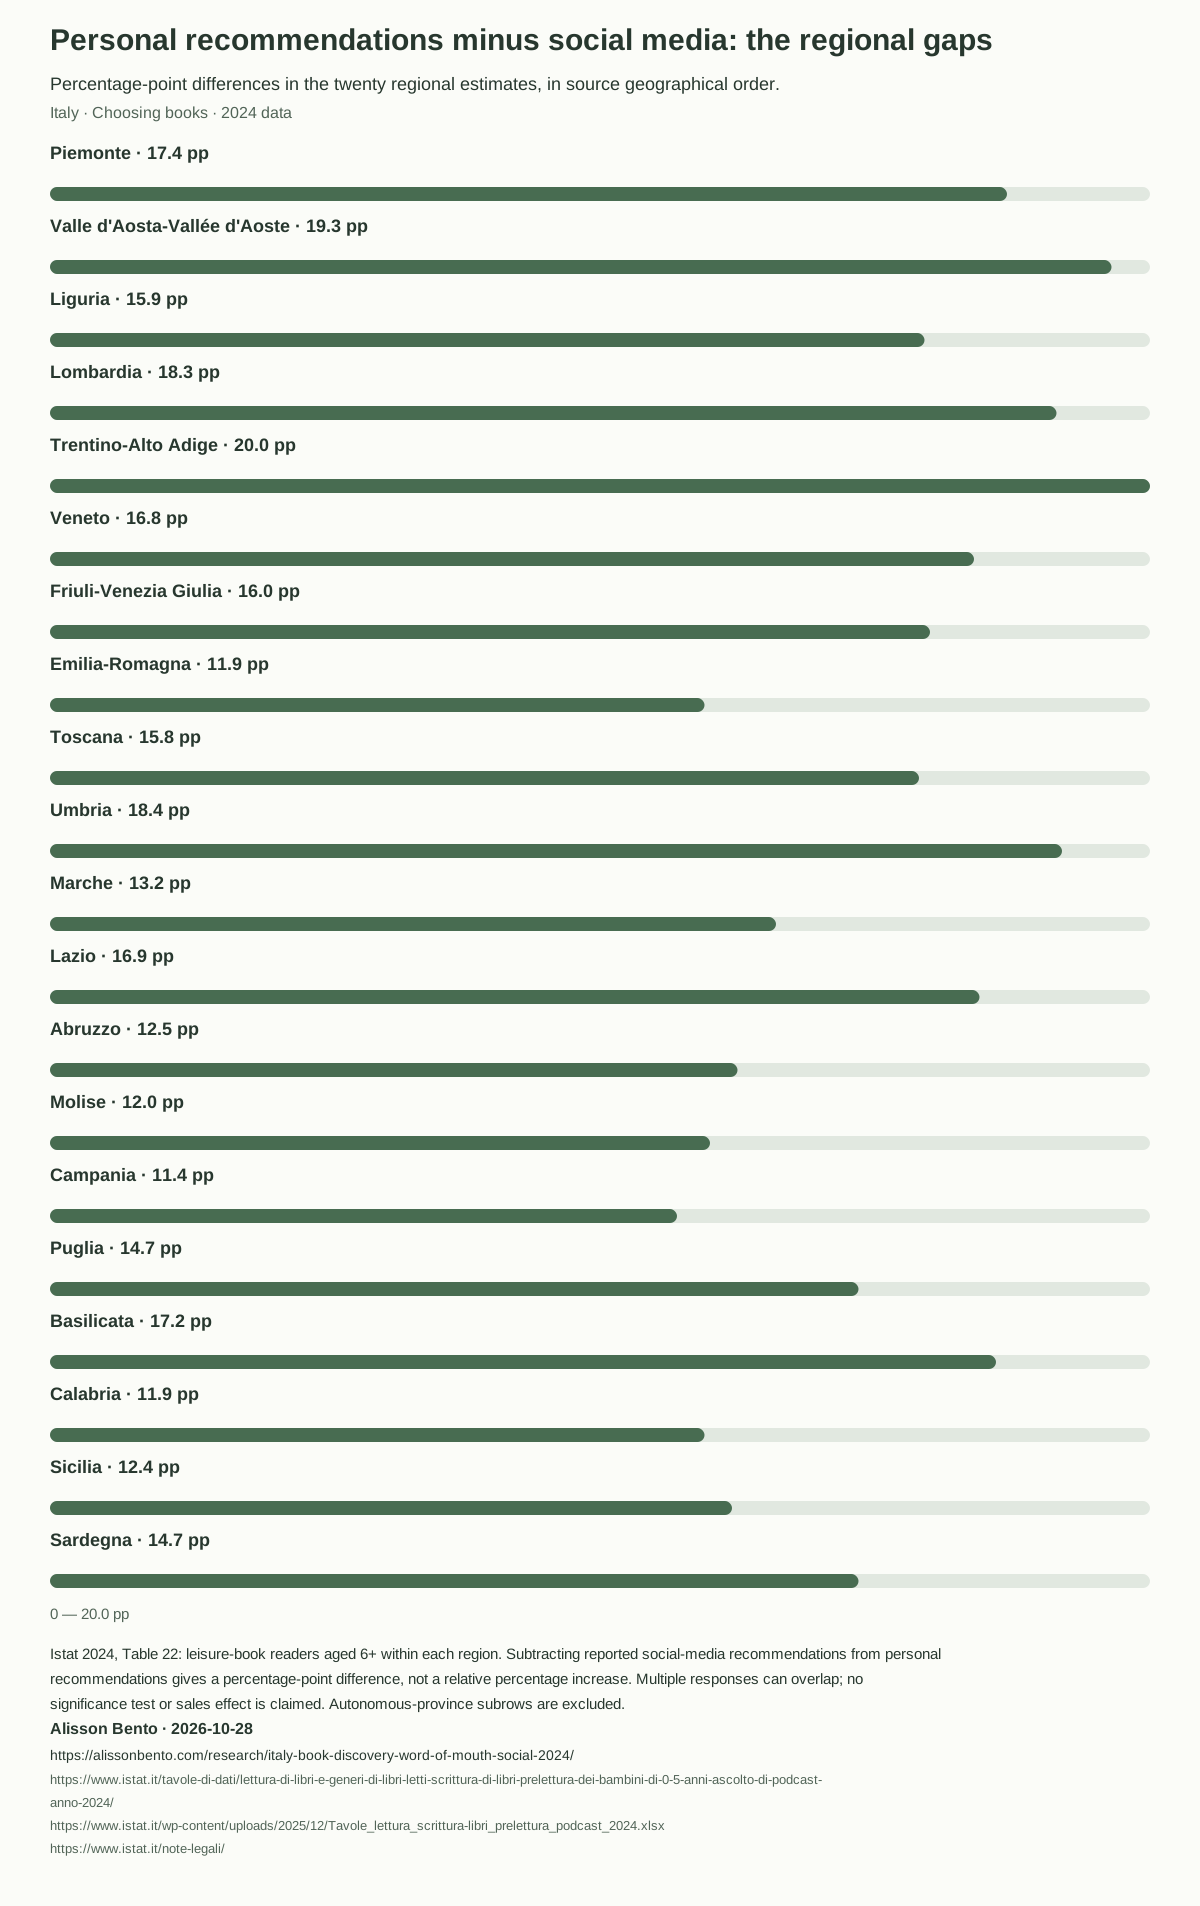
The smallest descriptive gap is in Campania: 18.6% for relatives, friends and acquaintances and 7.2% for social media, a difference of 11.4 points. In Trentino-Alto Adige the shares are 27.3% and 7.3%, a gap of 20.0 points. These differences do not rank the quality of readers or cultural services: age and other population characteristics differ across areas.
Municipality size provides another useful comparison. In municipalities with up to 2,000 residents, the shares are 18.4% and 6.9%, a gap of 11.5 points; in metropolitan centres they are 24.9% and 8.1%, a gap of 16.8 points. We do not have sufficient information to attribute this difference to the presence of bookshops, libraries or reading groups.
Social-media recommendations differ across adult age bands
The territorial table includes readers from age 6 and cannot isolate adults within each region. We therefore provide a separate adult perspective using Table 21 rows from age 18, retaining their separate denominators.
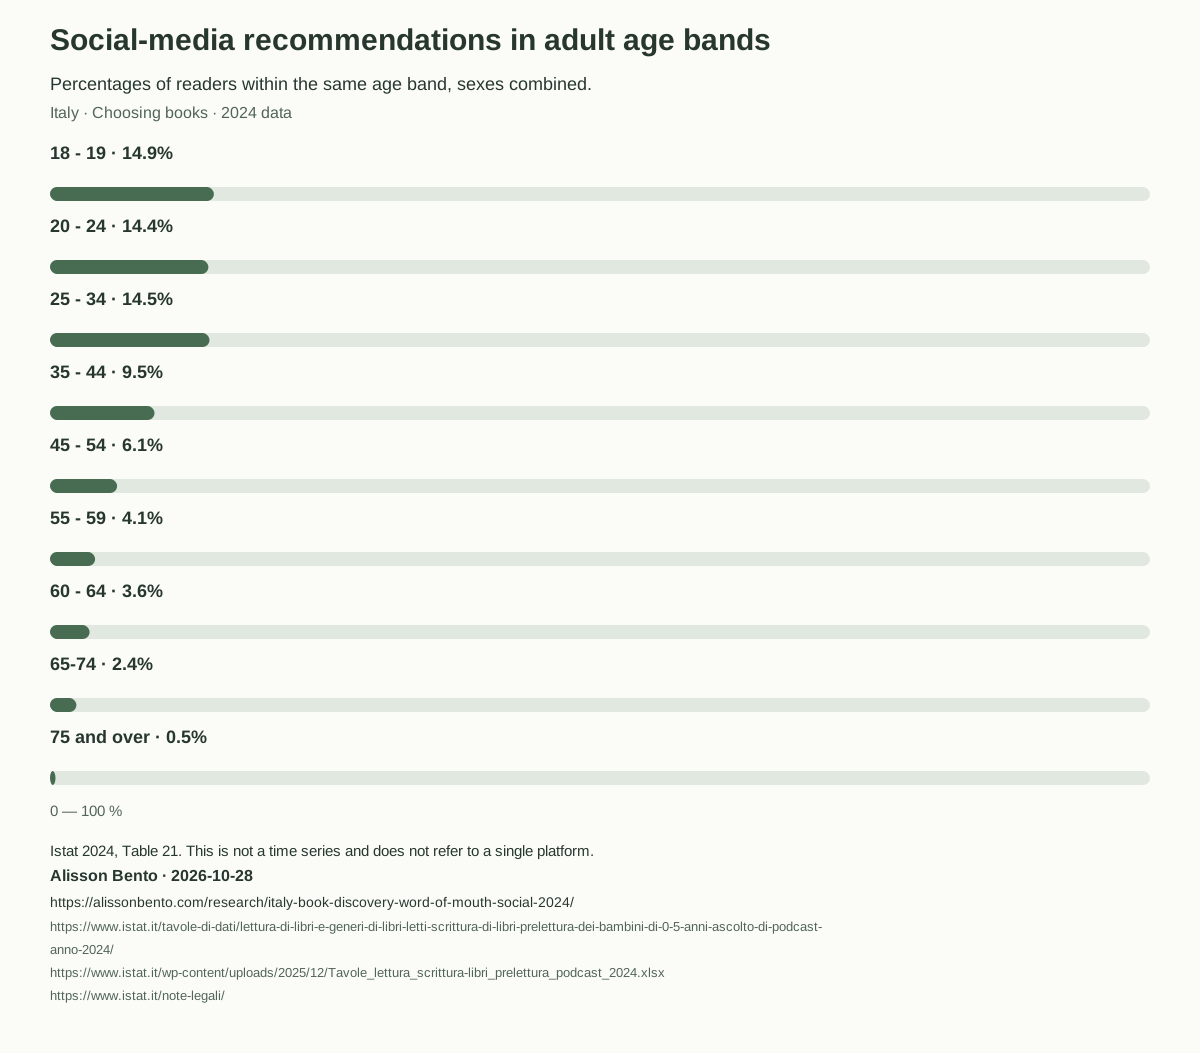
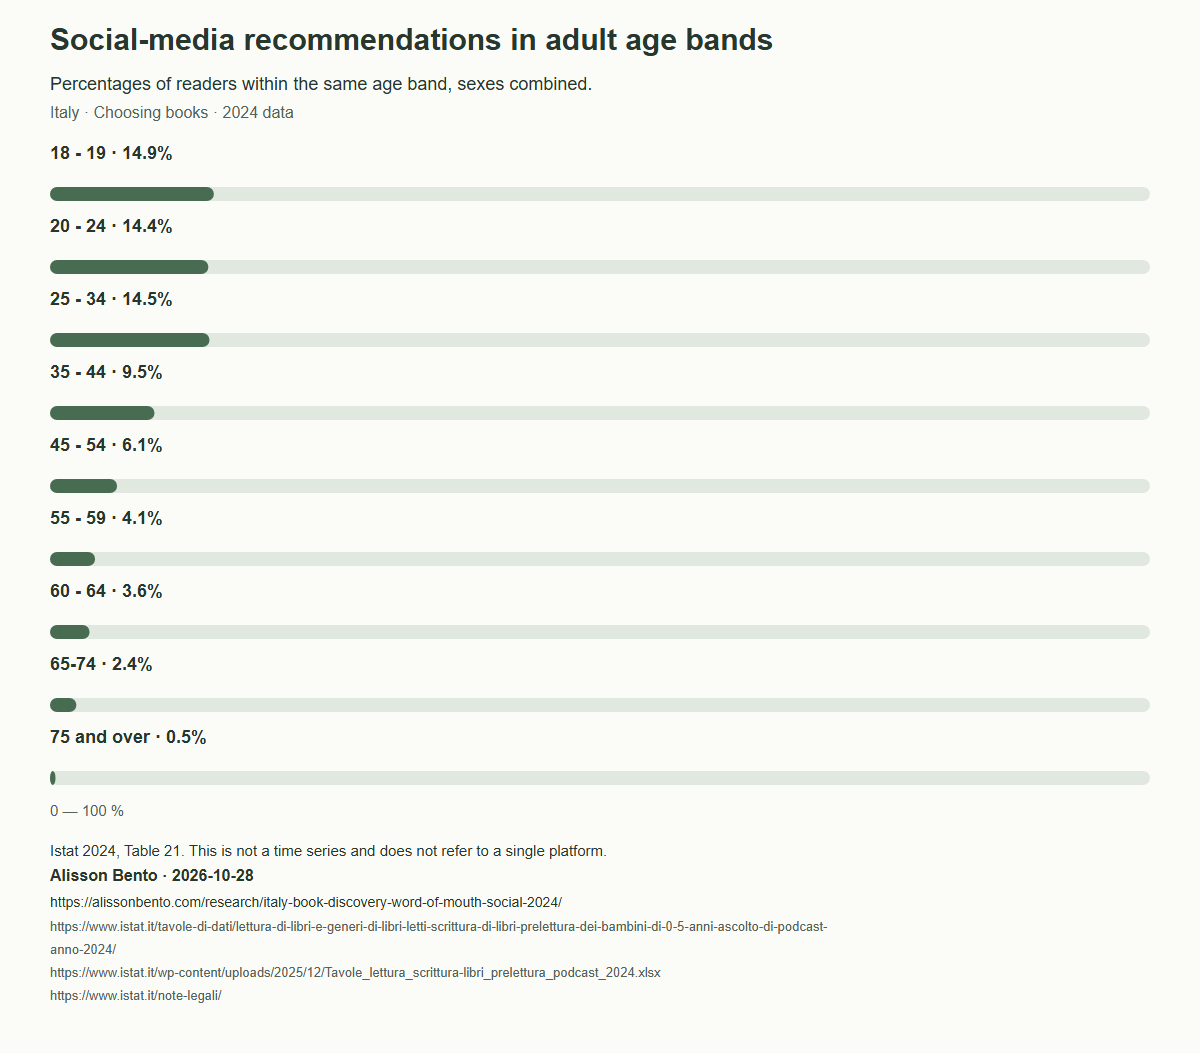
Among readers aged 18–19, personal recommendations are reported by 28.8% and social-media recommendations by 14.9%; among those aged 20–24, by 26.7% and 14.4%; and among those aged 25–34, by 24.2% and 14.5%. In subsequent age bands the social-media share is 9.5% at 35–44, 6.1% at 45–54, 4.1% at 55–59, 3.6% at 60–64, 2.4% at 65–74 and 0.5% from age 75.
These estimates describe different groups observed in the same year, not how an individual changes habits while ageing. They do not identify users of a particular platform, romance readers or people who purchase the books they discover online.
Using the data to discuss reading
For a newsroom, the results can sit alongside interviews with readers and professionals, distinguishing measured observations from questions requiring an interview. For a reading group, they offer a starting point for discussing the next choice without requiring people to choose just one discovery channel.
For an author, this is not a plan for automatically reallocating an advertising budget: the survey measures reported ways of choosing books, not conversions, revenue or campaign effectiveness. The conclusion supported by the tables is more precise: personal recommendations remain an important reported approach, alongside widespread independent choice and age differences in the use of social-media recommendations.
Checks, updates and corrections
The extraction retains the source sheet and row for every record. Comparisons use percentages published to one decimal place, keeping the 20 regions separate from autonomous provinces and macroregions. Manual checks include national cells, Molise, Marche and readers aged 18–19; the downloadable code contains explicit checks.
The complete tables allow every comparison to be checked again. If Istat revises the workbook, the method requires a fresh review before results are updated. Comments and corrections can be sent to contact@alissonbento.com. No private data about this website’s readers were used.
Italy: independent choice and reported recommendations
Percentages of leisure book readers aged 6 and over. Responses can overlap.
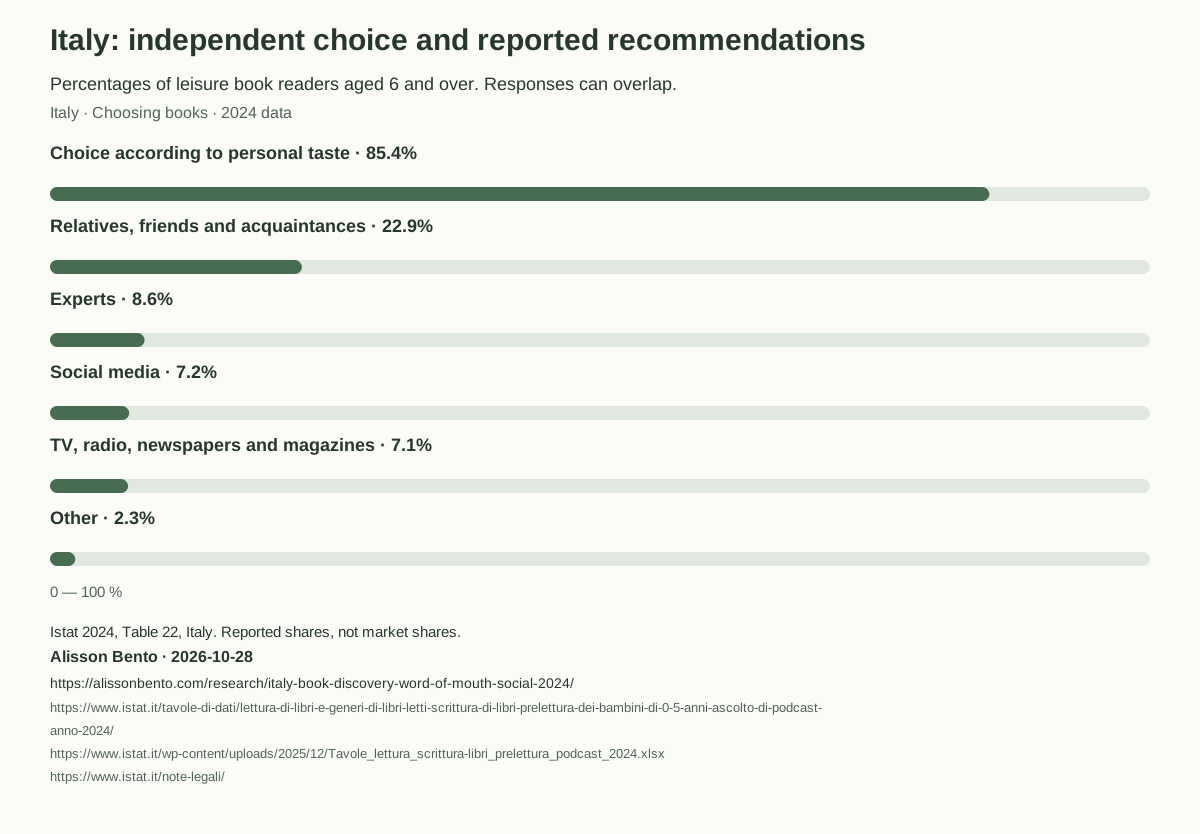
Scroll horizontally to inspect the chart. ↔
Chart values as text
Personal recommendations across the 20 regions
Share reporting recommendations from relatives, friends and acquaintances; source geographical order. Social-media shares appear in the complete table.
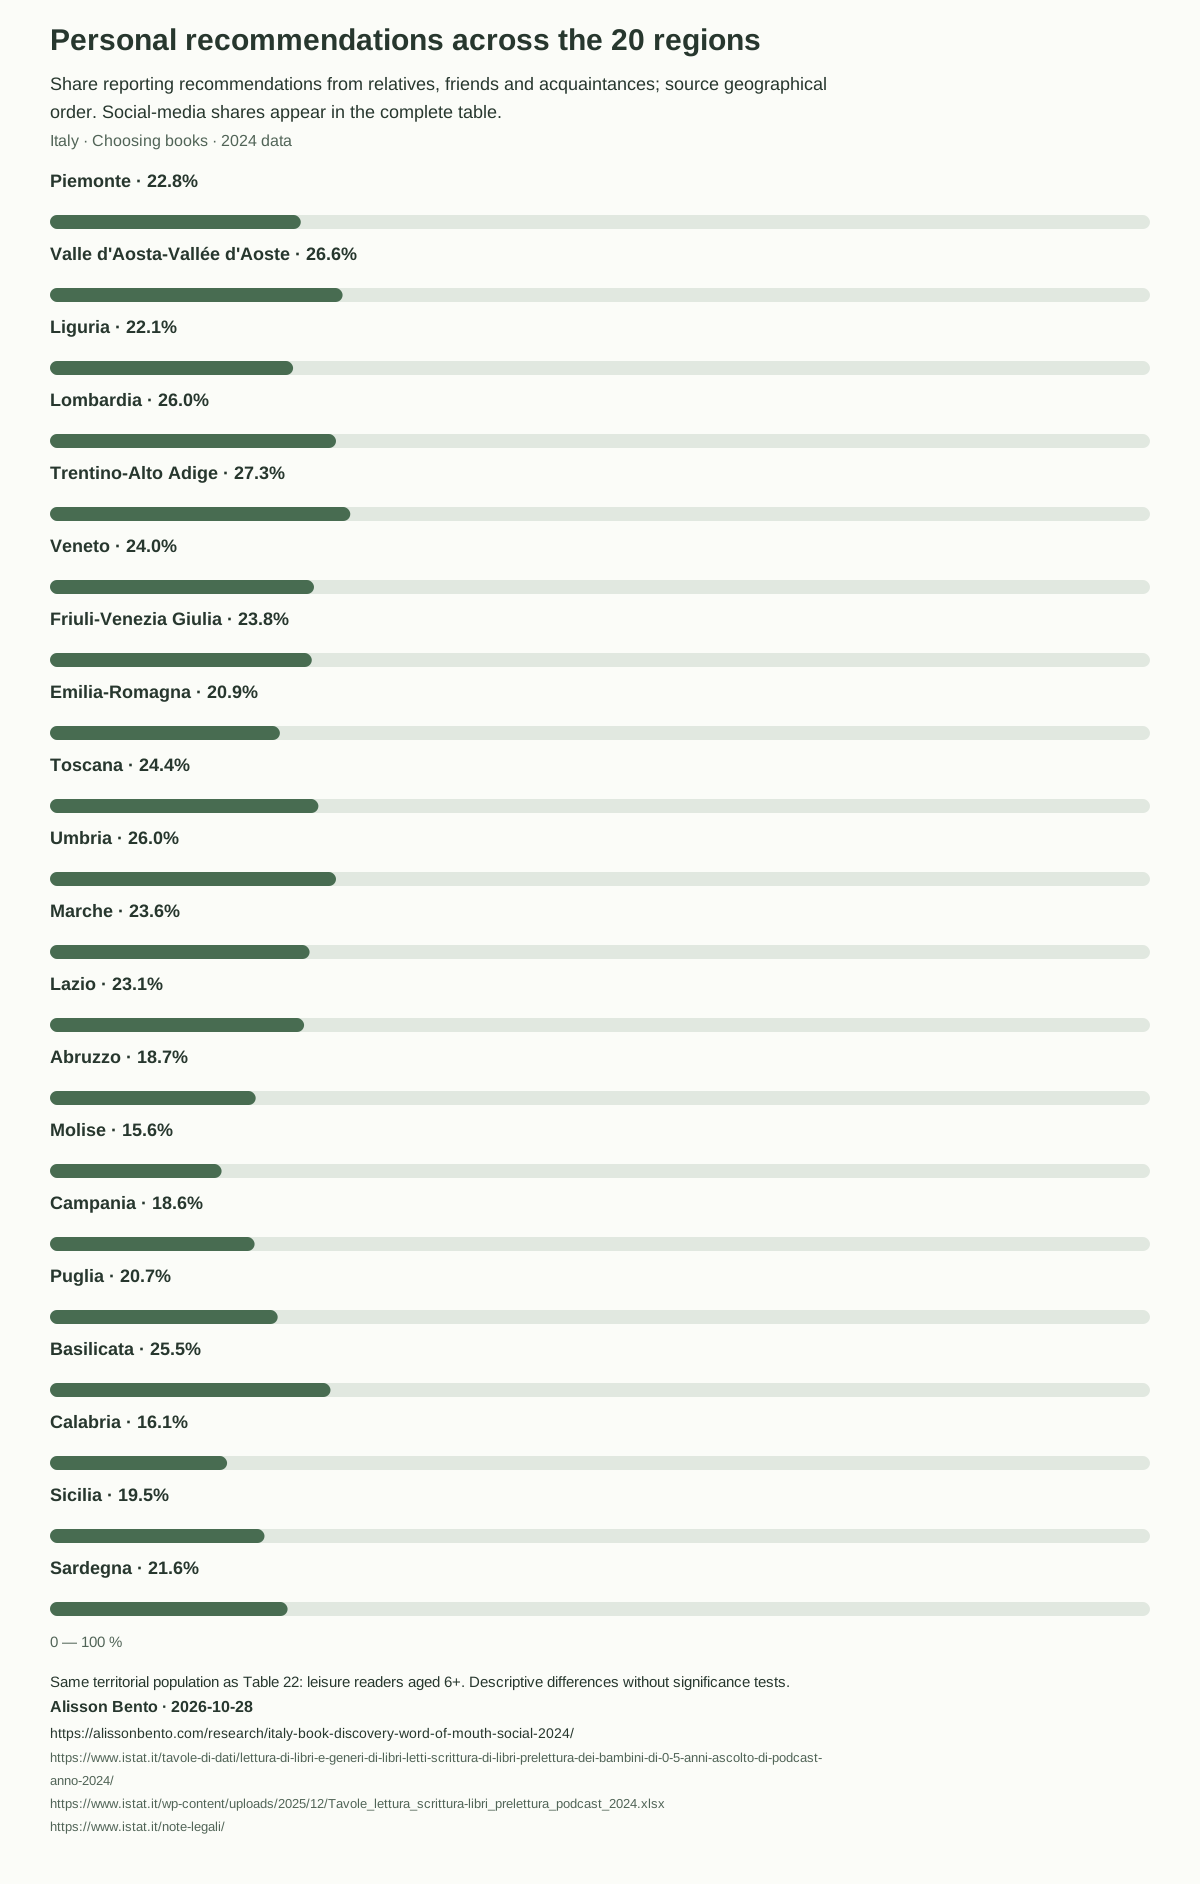
Scroll horizontally to inspect the chart. ↔
Chart values as text
Social-media recommendations in adult age bands
Percentages of readers within the same age band, sexes combined.
Scroll horizontally to inspect the chart. ↔
Chart values as text
Personal recommendations minus social media: the regional gaps
Percentage-point differences in the twenty regional estimates, in source geographical order.
Scroll horizontally to inspect the chart. ↔
Chart values as text
Data & downloads
Scroll horizontally to see all columns.
| Area / age | Independent choice (%) | Relatives, friends, acquaintances (%) | Experts (%) | Social media (%) | TV, radio, press (%) | Other (%) | Personal recommendations minus social media (percentage points) |
|---|---|---|---|---|---|---|---|
| Piemonte | 84.8 | 22.8 | 9.4 | 5.4 | 8.4 | 2.0 | 17.4 |
| Valle d'Aosta-Vallée d'Aoste | 84.4 | 26.6 | 10.9 | 7.3 | 6.8 | 2.2 | 19.3 |
| Liguria | 87.3 | 22.1 | 8.4 | 6.2 | 7.0 | 2.3 | 15.9 |
| Lombardia | 83.4 | 26.0 | 8.9 | 7.7 | 8.9 | 2.0 | 18.3 |
| Trentino-Alto Adige | 87.9 | 27.3 | 13.0 | 7.3 | 9.6 | 1.5 | 20.0 |
| - Bolzano - Bozen | 87.8 | 27.5 | 12.5 | 6.7 | 8.7 | 2.0 | 20.8 |
| - Trento | 87.9 | 27.0 | 13.5 | 7.9 | 10.5 | 0.9 | 19.1 |
| Veneto | 86.4 | 24.0 | 7.9 | 7.2 | 6.6 | 3.1 | 16.8 |
| Friuli-Venezia Giulia | 83.2 | 23.8 | 9.3 | 7.8 | 8.1 | 2.3 | 16.0 |
| Emilia-Romagna | 86.4 | 20.9 | 9.3 | 9.0 | 8.0 | 2.0 | 11.9 |
| Toscana | 86.8 | 24.4 | 9.6 | 8.6 | 7.7 | 3.3 | 15.8 |
| Umbria | 83.6 | 26.0 | 8.1 | 7.6 | 6.7 | 2.7 | 18.4 |
| Marche | 87.2 | 23.6 | 11.0 | 10.4 | 9.0 | 1.6 | 13.2 |
| Lazio | 87.8 | 23.1 | 9.3 | 6.2 | 5.0 | 1.9 | 16.9 |
| Abruzzo | 88.9 | 18.7 | 8.6 | 6.2 | 4.7 | 2.4 | 12.5 |
| Molise | 87.5 | 15.6 | 6.6 | 3.6 | 4.9 | 1.2 | 12.0 |
| Campania | 84.3 | 18.6 | 5.5 | 7.2 | 3.8 | 2.3 | 11.4 |
| Puglia | 83.9 | 20.7 | 8.2 | 6.0 | 4.4 | 3.0 | 14.7 |
| Basilicata | 82.9 | 25.5 | 9.6 | 8.3 | 6.0 | 1.9 | 17.2 |
| Calabria | 85.6 | 16.1 | 3.7 | 4.2 | 5.5 | 2.2 | 11.9 |
| Sicilia | 84.1 | 19.5 | 8.0 | 7.1 | 7.4 | 3.0 | 12.4 |
| Sardegna | 86.2 | 21.6 | 7.9 | 6.9 | 7.2 | 1.7 | 14.7 |
Percentages of leisure book readers aged 6+ in the same area; gap in percentage points. Autonomous provinces shown separately and excluded from the 20-region count.
Scroll horizontally to see all columns.
| Area / age | Independent choice (%) | Relatives, friends, acquaintances (%) | Experts (%) | Social media (%) | TV, radio, press (%) | Other (%) | Personal recommendations minus social media (percentage points) |
|---|---|---|---|---|---|---|---|
| North-western Italy | 84.1 | 24.8 | 9.0 | 7.0 | 8.6 | 2.1 | 17.8 |
| North-eastern Italy | 86.2 | 23.1 | 9.1 | 8.0 | 7.6 | 2.4 | 15.1 |
| Central Italy | 87.2 | 23.7 | 9.5 | 7.5 | 6.4 | 2.4 | 16.2 |
| Southern Italy | 84.9 | 19.1 | 6.6 | 6.3 | 4.4 | 2.4 | 12.8 |
| Insular Italy | 84.7 | 20.2 | 8.0 | 7.0 | 7.4 | 2.6 | 13.2 |
| Metropolitan centre municipality | 86.1 | 24.9 | 10.7 | 8.1 | 8.7 | 1.8 | 16.8 |
| Metropolitan outskirts | 85.2 | 24.1 | 9.2 | 7.2 | 7.3 | 2.5 | 16.9 |
| Up to 2,000 residents | 84.3 | 18.4 | 8.2 | 6.9 | 7.2 | 4.7 | 11.5 |
| 2,001–10,000 residents | 86.2 | 21.6 | 7.1 | 6.3 | 5.4 | 2.3 | 15.3 |
| 10,001–50,000 residents | 84.2 | 23.7 | 8.1 | 7.2 | 6.7 | 2.3 | 16.5 |
| 50,001 residents and over | 86.2 | 21.2 | 8.6 | 7.4 | 7.9 | 2.1 | 13.8 |
| Italy | 85.4 | 22.9 | 8.6 | 7.2 | 7.1 | 2.3 | 15.7 |
Source aggregate estimates, without summing or reweighting. Same population aged 6+.
Scroll horizontally to see all columns.
| Area / age | Independent choice (%) | Relatives, friends, acquaintances (%) | Experts (%) | Social media (%) | TV, radio, press (%) | Other (%) | Personal recommendations minus social media (percentage points) |
|---|---|---|---|---|---|---|---|
| 18 - 19 | 86.6 | 28.8 | 7.9 | 14.9 | 2.4 | 0.8 | 13.9 |
| 20 - 24 | 86.4 | 26.7 | 10.2 | 14.4 | 2.3 | 1.4 | 12.3 |
| 25 - 34 | 88.5 | 24.2 | 7.8 | 14.5 | 5.5 | 2.9 | 9.7 |
| 35 - 44 | 86.2 | 21.5 | 10.4 | 9.5 | 5.7 | 1.7 | 12.0 |
| 45 - 54 | 87.5 | 21.5 | 8.6 | 6.1 | 8.0 | 2.5 | 15.4 |
| 55 - 59 | 89.4 | 22.7 | 12.2 | 4.1 | 9.8 | 2.3 | 18.6 |
| 60 - 64 | 88.6 | 21.5 | 11.0 | 3.6 | 12.2 | 2.0 | 17.9 |
| 65-74 | 88.1 | 16.7 | 9.4 | 2.4 | 12.8 | 1.7 | 14.3 |
| 75 and over | 82.0 | 20.1 | 7.1 | 0.5 | 10.2 | 2.6 | 19.6 |
Leisure book readers within the same age band, sexes combined. Do not reconstruct an adult average from these rows without weights.
Evidence & method
How we calculated it
- Download Istat’s official 2024 results workbook; the code records its SHA-256 fingerprint to identify the analysed version. Extract Table 22 for areas and Table 21 for adult age bands aged 18+.
- Keep the six approaches as distinct variables. Calculate gap = relatives/friends/acquaintances share minus social-media share, in percentage points; calculate the ratio by dividing the same shares. Do not add channels together.
- Count each of the 20 regions once. Retain Trento and Bolzano as informative rows without adding them to Trentino-Alto Adige; keep macroregions and municipality types separate.
- Use the published one-decimal rounding. Comparisons are descriptive; the extracted tables do not provide the standard errors needed to declare statistically significant differences. This is a reanalysis of official data, not an original survey of new respondents.
What the data cannot tell us
- Data refer to 2024, not behaviour measured in 2026. The territorial population includes readers aged 6+, not the entire population and not exclusively adults.
- The figures describe reported ways of choosing leisure books, with overlapping responses. They do not equal purchases, attributed sales, directly observed activity or advertising effectiveness.
- Adult age bands form a separate analysis. This study contains no region-by-age cross-tabs or estimates by platform, literary genre or romance subgenre.
- Territorial and age differences may reflect composition and sampling variability. No causes are assigned, and small gaps are not used to create statistical rankings.
- Rounded percentages limit the precision of differences and ratios. The 20-out-of-20 count describes published estimates; it is not evidence of simultaneous statistical significance in every region.
Original sources
- Istat: lettura di libri 2024, Tavole 21–22
Tables 21 and 22: published percentages for reported ways of choosing books; Istat is the primary source.
Accessed October 28, 2026
- Istat official2024 workbook
Official workbook analysed, also identified by SHA-256 in the metadata.
Accessed October 28, 2026
- Istat: note legali
Istat’s general conditions: CC BY 4.0 unless otherwise stated.
Accessed October 28, 2026
Cite & reuse this study
Alisson Bento. How readers choose books in Italy: the gap between personal recommendations and social media in 2024. Reanalysis of Istat Tables 21–22, I cittadini e il tempo libero 2024. Published 28 October 2026. https://alissonbento.com/research/italy-book-discovery-word-of-mouth-social-2024/
Analysis and tables shared with attribution to Alisson Bento and the Istat source; identify any changes. Istat data are under CC BY 4.0, without implying the Institute’s endorsement.
Corrections or editorial questions